-
Články
Top novinky
Reklama- Vzdělávání
- Časopisy
Top články
Nové číslo
- Témata
Top novinky
Reklama- Videa
- Podcasty
Nové podcasty
Reklama- Kariéra
Doporučené pozice
Reklama- Praxe
Top novinky
ReklamaCardiovascular disease (CVD) and chronic kidney disease (CKD) event rates in HIV-positive persons at high predicted CVD and CKD risk: A prospective analysis of the D:A:D observational study
In an observational study, Mark Boyd and colleagues report on risks of cardiovascular and renal events in people with HIV infection.
Published in the journal: . PLoS Med 14(11): e32767. doi:10.1371/journal.pmed.1002424
Category: Research Article
doi: https://doi.org/10.1371/journal.pmed.1002424Summary
In an observational study, Mark Boyd and colleagues report on risks of cardiovascular and renal events in people with HIV infection.
Introduction
Combination antiretroviral therapy has transformed the lives of HIV-positive people. Over the past 20 years in high-income countries, rates of opportunistic diseases have declined and life expectancy has reached levels similar to that of the HIV-negative population [1–4]. However, there is evidence suggesting that people living with HIV experience greater and earlier onset of comorbidities compared with their HIV-negative peers [5–7]. The relative extent to which this observation relates to a higher prevalence of behaviours and risks associated with such comorbidities, increased levels of immune activation and coagulopathy despite sustained virological suppression, antiretroviral treatment, and/or other mechanisms remains unclear [8,9].
In the general population, it is well established that chronic kidney disease (CKD) is an important and independent risk factor (covariate) for cardiovascular disease (CVD) [10]. It has been argued that CKD should be considered a coronary risk factor, and that aggressive risk factor reduction for other CVD risk factors should be part of standard therapy for patients with CKD [11].
CVD in turn is associated with CKD. This may be mediated by the development of atherosclerosis, or may result as a consequence of shared risk factors with CKD such as hypertension and diabetes mellitus. It is well recognised that the effects of comorbidity may be greater than the effects of the sum of risk of each disease, and that their co-existence may lead to more severe illness, poorer prognosis, and premature death [11].
In HIV-positive people, a similarly strong relationship between CKD and CVD has been reported [12]. The Data Collection on Adverse Events of Anti-HIV Drugs (D:A:D) collaboration has developed HIV-specific predictive risk models for CVD [13] and CKD [14] in an attempt to help guide care in these individuals. We hypothesized that participants in D:A:D at high (>5%) predicted risk for both CVD and CKD would be at even greater risk for CVD and CKD events, and may therefore warrant particularly close clinical attention and management.
Methods
The D:A:D study is a prospective observational study that combines 11 cohorts of HIV-positive people. Its objective is to establish whether the use of combination antiretroviral therapy is associated with an elevated risk of CVD, end-stage renal disease (ESRD), liver disease, cancer, and death. The 11 cohorts contribute data on 49,717 participants enrolled at 212 clinics in Europe, the US, Argentina, and Australia. The standardised dataset includes information on socio-demographics, AIDS events and death, known CVD risk factors, height and weight, laboratory markers, antiretroviral treatment history, estimated glomerular filtration rate (eGFR) (Cockcroft—Gault equation), and treatments including those prescribed for CVD risk.
The main analyses in this study were performed according to a prospectively established statistical analysis plan (S2 Text). The non-prospectively defined analyses were those investigating the covariates of the CVD risk score as predictors for CKD events adjusted for CKD risk group, the covariates of the CKD risk score as predictors for CVD events adjusted for CVD risk group, and the prevalence of diabetes at baseline according to predicted CKD and CVD risk group.
All participating cohorts in the D:A:D study followed local national guidelines/regulations regarding patient consent and ethical review.
Participants
In this study we included individuals for whom a complete set of risk covariate data was available after 1 January 2004 as required by both the D:A:D CVD and CKD risk equations, except for missing data for exposure to viral hepatitis C and family history of CVD, in which case these were imputed to be negative (thus slightly underestimating CVD risk in these individuals). All those included in the analysis had an eGFR > 60 ml/min/1.73 m2 at baseline and an eGFR ≤ 60 ml/min/1.73 m2 observed subsequently on at least 2 consecutive occasions at least 3 months apart. We used definitions of endpoints indicating CVD and CKD as defined in previous D:A:D publications [13,14], but note that CVD events were centrally validated clinical events (myocardial infarction, stroke, and invasive cardiac procedures), whereas CKD events were based on confirmed laboratory criteria.
Patient follow-up was censored at the earliest of the following: last eGFR, last visit plus 6 months, or 1 February 2015. We excluded participants with a previous history of CVD, baseline eGFR ≤ 60 ml/min/1.73 m2, or a CVD or CKD event that occurred within 30 days of baseline. We included CVD events and follow-up after the definition of a CKD event had been met and CKD events after the definition of a CVD event had been met.
We calculated the 5-year predicted risk for CKD and CVD using the D:A:D risk equations [13,14]. The CVD equation includes age, sex, diabetes, CVD family history, current and former smoking, total cholesterol, high-density lipoprotein (HDL) cholesterol, systolic blood pressure, current CD4 count, current receipt of abacavir, and cumulative exposure to protease inhibitors (PIs) and nucleoside/nucleotide reverse transcriptase inhibitors (N[t]RTIs). We censored PI and N(t)RTI at 3 and 7 years, respectively, as this reflects the range of data on which the models were developed and so avoids over-predicting risk. The CKD equation includes age, sex, exposure to HIV through injecting drug use, hepatitis C coinfection, baseline eGFR, nadir CD4 count, hypertension, prior CVD and diabetes, adjustment for current receipt of unboosted atazanavir or ritonavir-boosted lopinavir, and a higher adjustment for tenofovir disoproxil fumarate, ritonavir-boosted atazanavir and any other PI.
We stratified the 5-year predicted CKD and CVD risk into groups as ≤1%, >1%–5%, and >5%. We did this rather than use predicted risk as a continuous measure for 2 reasons. First, this reflects how clinicians and their patients use these risk equations, categorising predicted risk into groups that then indicate possible interventions. Second, using risk groups in this fashion allows clear presentation of the rates of CKD and CVD events in each predicted risk group. We deliberately chose not to use the low, moderate, and high CKD risk groups defined by Mocroft et al. [14] in order that the CVD and CKD risk groups could be interpreted in the same fashion. We performed a secondary analysis of events using the Framingham equation, recalibrated to the D:A:D study as described in a previous publication [13], to assess whether the results would be similar compared to the primary analysis. We also examined CKD and CVD events using predicted risks as continuous covariates as a sensitivity analysis.
Statistical methods
We calculated CKD and CVD event rates by CKD and CVD risk group. We fitted Poisson models to assess whether CKD and CVD risk group effects are additive or multiplicative. In an attempt to assess how the predicted CVD risk score was contributing to prediction of CKD events, we investigated predictors of CKD events, fitting the CKD risk score group and then each of the covariates in the CVD risk score that are not included in the CKD risk score. We also investigated predictors of CVD events, fitting the CVD risk score group and then each of the covariates in the CKD risk score that are not included in the CVD risk score.
Results
Baseline characteristics
Of the 49,717 individuals enrolled in the D:A:D study, 27,215 (55%) had the required complete covariate data after 1 January 2004 and were included in this analysis, contributing 202,034 person-years (pyrs) of follow-up.
Characteristics of the 27,215 individuals included at baseline, defined as the first time each individual had complete CVD and CKD risk factor data available after 1 January 2004, are shown in Table 1. The median (IQR) baseline year of follow-up was 2005 (2004, 2008). The cohort was 74% male, with a median (IQR) age of 42 (36, 49) years. Fifty percent were smokers at baseline, and 3.8% had a diagnosis of diabetes mellitus. The median (IQR) 5-year predicted CKD risk was 1.1% (0.6%, 3.7%), and the median (IQR) 5-year predicted CVD risk was 1.6% (0.8%, 3.3%).
Tab. 1. Participant baseline characteristics. 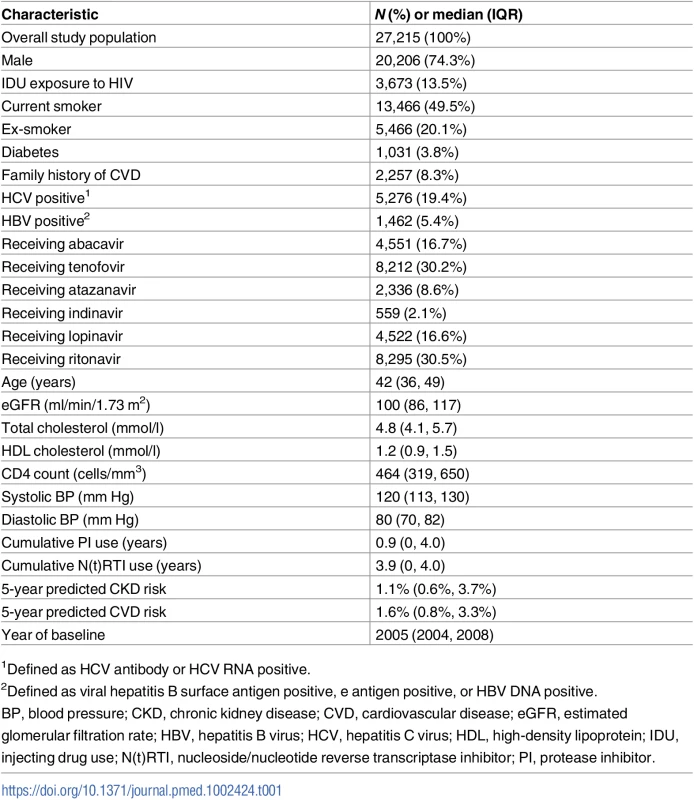
1Defined as HCV antibody or HCV RNA positive. Of the 1,415 people with a CKD event and 918 people with a CVD event, 154 (10.9%) experienced both types of event. Eighty-six (56%) of those who had both events experienced the CVD event first, and 67 (44%) the CKD event first. In 1 person the CKD and CVD event occurred on the same day. The majority of the CKD and CVD events (117, 76%) occurred 1 or more years apart.
Overall CVD and CKD risk
The numbers of participants in each predicted risk group combination are expressed in Table 2. Of the 3,560 people with a 5-year predicted CVD risk > 5%, 3,331 (94%) were men and 229 (6%) were women. In these 3,331 men there were 528 CKD events (rate 23.0 per 1,000 pyrs), and in the 229 women there were 53 CKD events (rate 37.3 per 1,000 pyrs).
Tab. 2. Numbers of participants in each predicted risk group combination. 
CKD, chronic kidney disease; CVD, cardiovascular disease. CKD event rates according to CKD and CVD risk
We observed 1,415 CKD events during follow-up, an overall rate of 7.00 per 1,000 pyrs (95% CI 6.6–7.7 per 1,000 pyrs). CKD event rates by predicted CKD and CVD risk group are shown in Fig 1, indicating that within each CKD risk group, the CKD event rate increases with higher predicted CVD risk.
Fig. 1. CKD event rates according to CKD and CVD risk. 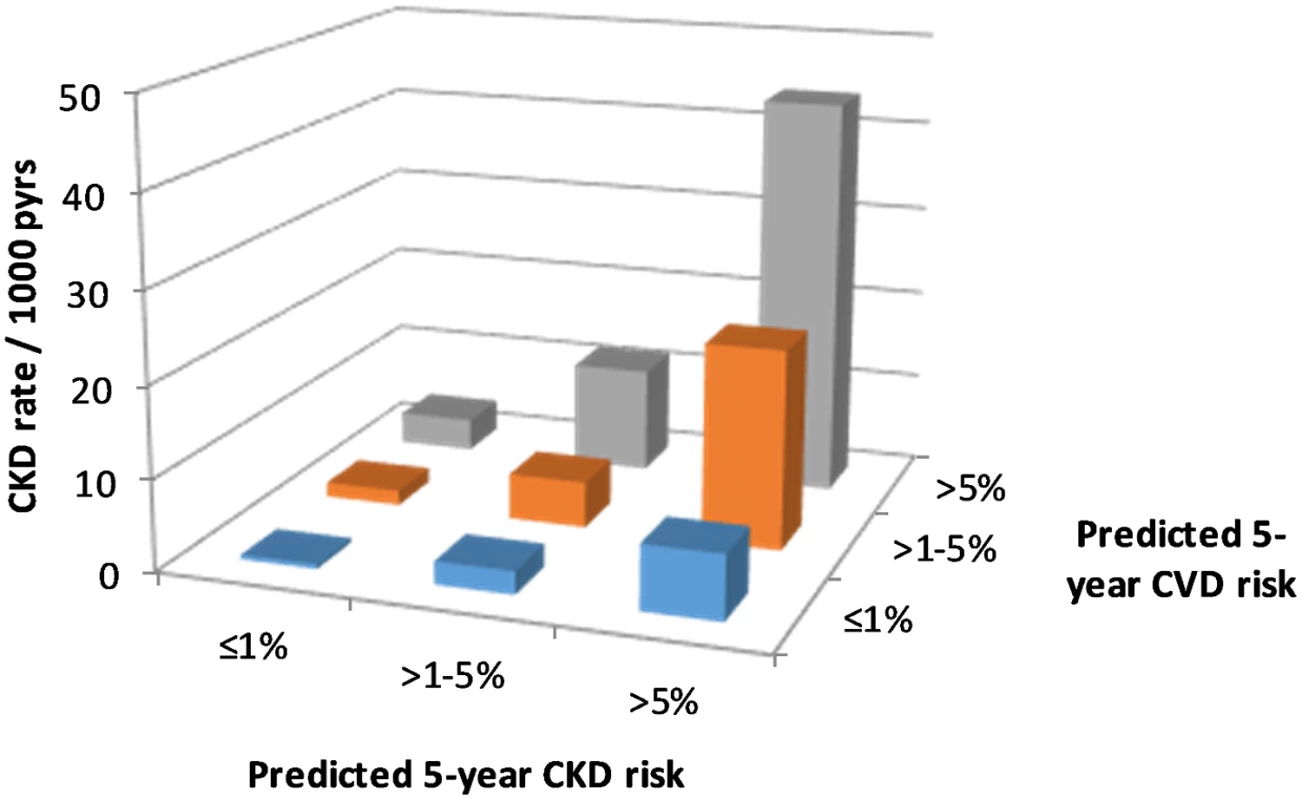
CKD, chronic kidney disease; CVD, cardiovascular disease; pyrs, person-years. This multiplicative effect of CKD and CVD predicted risk group on CKD events is confirmed by the Poisson regression models (Table 3), which show a highly statistically significant association between predicted CVD risk group and CKD events, after adjustment for CKD risk group. In these models there was no statistical evidence of an interaction between the predicted CKD and CVD risk groups, suggesting that the effects are multiplicative (i.e., additive on a log scale). This means, for example, that for an individual with a high predicted 5-year risk of both CKD and CVD, the incidence rate ratio (IRR) for CKD events would be 13.81 multiplied by 5.63, which equals 77.75, compared with an individual at low predicted risk for both CKD and CVD.
Tab. 3. Combined effect of CKD and CVD risk groups in predicting CKD and CVD events. 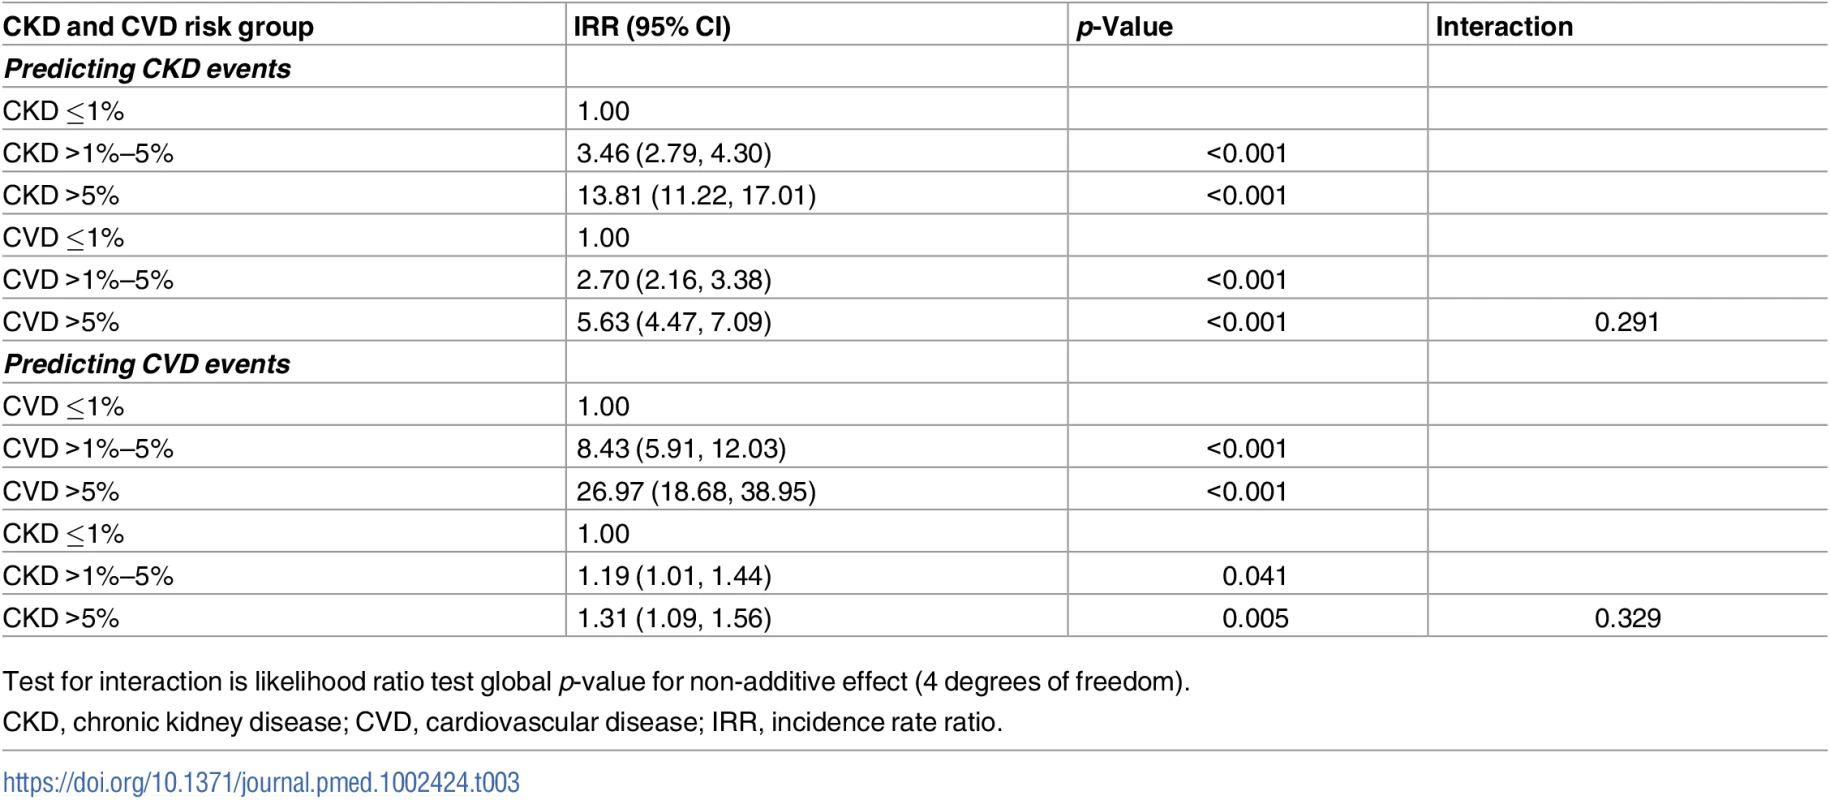
Test for interaction is likelihood ratio test global p-value for non-additive effect (4 degrees of freedom). The CKD event rates by predicted Framingham CVD and CKD risk strata were similar to the findings in the primary analysis (S1 Table).
CVD event rates according to CKD and CVD risk groups
There were 918 CVD events documented during follow-up, an overall rate of 4.5 per 1,000 pyrs (95% CI 4.2–4.8 per 1,000 pyrs). CVD event rates by predicted CVD and CKD risk groups are shown in Fig 2. This figure shows large increases in CVD event rates with increasing predicted CVD risk, as would be expected. But there is also some evidence of increasing CVD events with increasing predicted CKD risk.
Fig. 2. CVD event rates according to CKD and CVD risk. 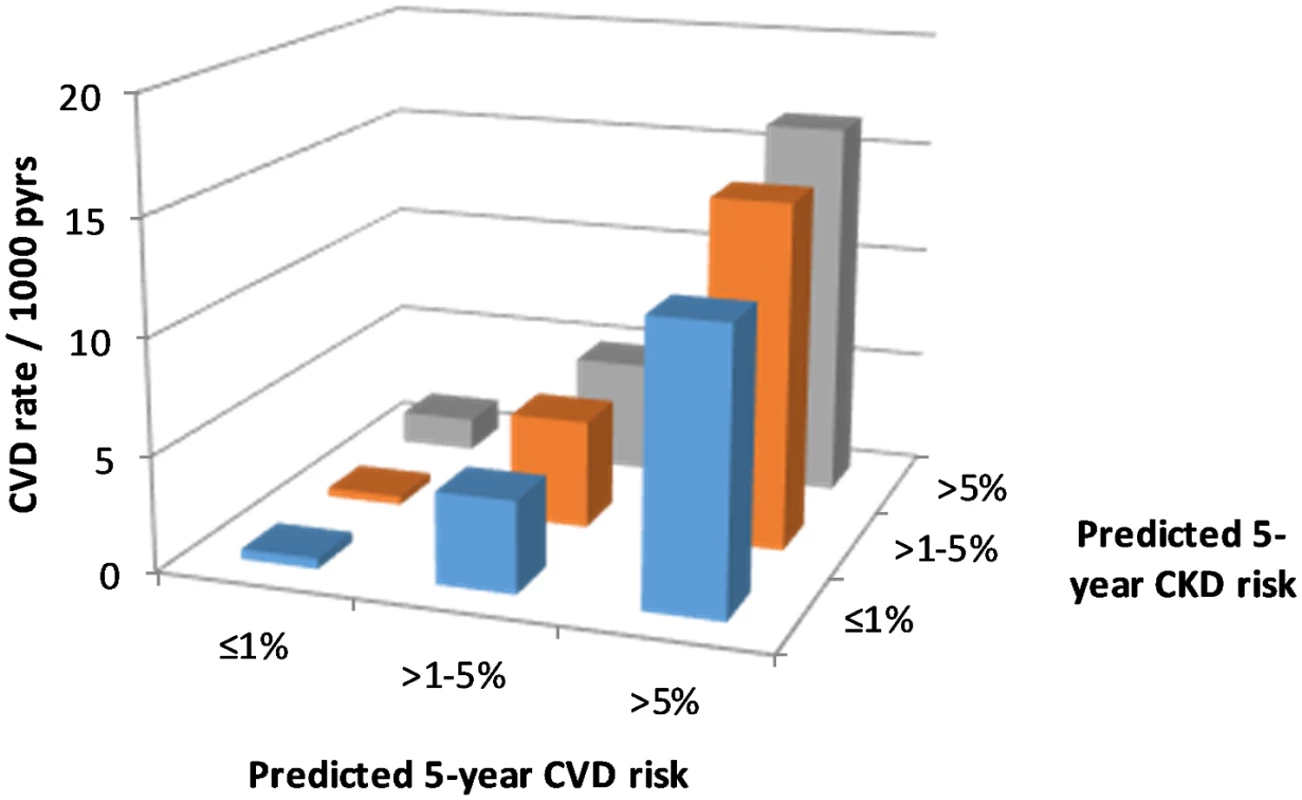
CKD, chronic kidney disease; CVD, cardiovascular disease; pyrs, person-years. The Poisson regression models did confirm a statistically significant association between higher predicted CKD risk group and CVD events after adjustment for predicted CVD risk (Table 3). But the magnitude of this association was smaller than was seen for the association between predicted CVD risk group and CKD events. Again, there was no statistical evidence of an interaction between predicted CVD and CKD risk groups.
The CVD event rates by predicted Framingham CVD and CKD risk strata were also similar to the findings made in the primary analysis (S2 Table).
Investigating covariates of the CVD risk score as predictors of CKD events
The relationship between the covariates of the CVD risk score and prediction of CKD events (adjusted for CKD risk group) is summarised in Table 4. We found that total plasma cholesterol level was associated with risk of a CKD event (IRR 1.48 per unit log total cholesterol, 95% CI 1.20, 1.83, p < 0.001), as were baseline CD4 count (IRR 0.90, 95% CI 0.86, 0.95, p < 0.001) and cumulative exposure to a PI (IRR 1.11 per year exposure, 95% CI 1.06, 1.15, p < 0.001) or to an N(t)RTI (IRR 1.05 per year exposure, 95% CI 1.03, 1.08, p < 0.001). We did not find statistically significant relationships for having a family history of CVD, being an ex - or current smoker, HDL cholesterol, or currently receiving abacavir.
Tab. 4. Covariates of CVD risk score as predictors for CKD events adjusted for CKD risk group. 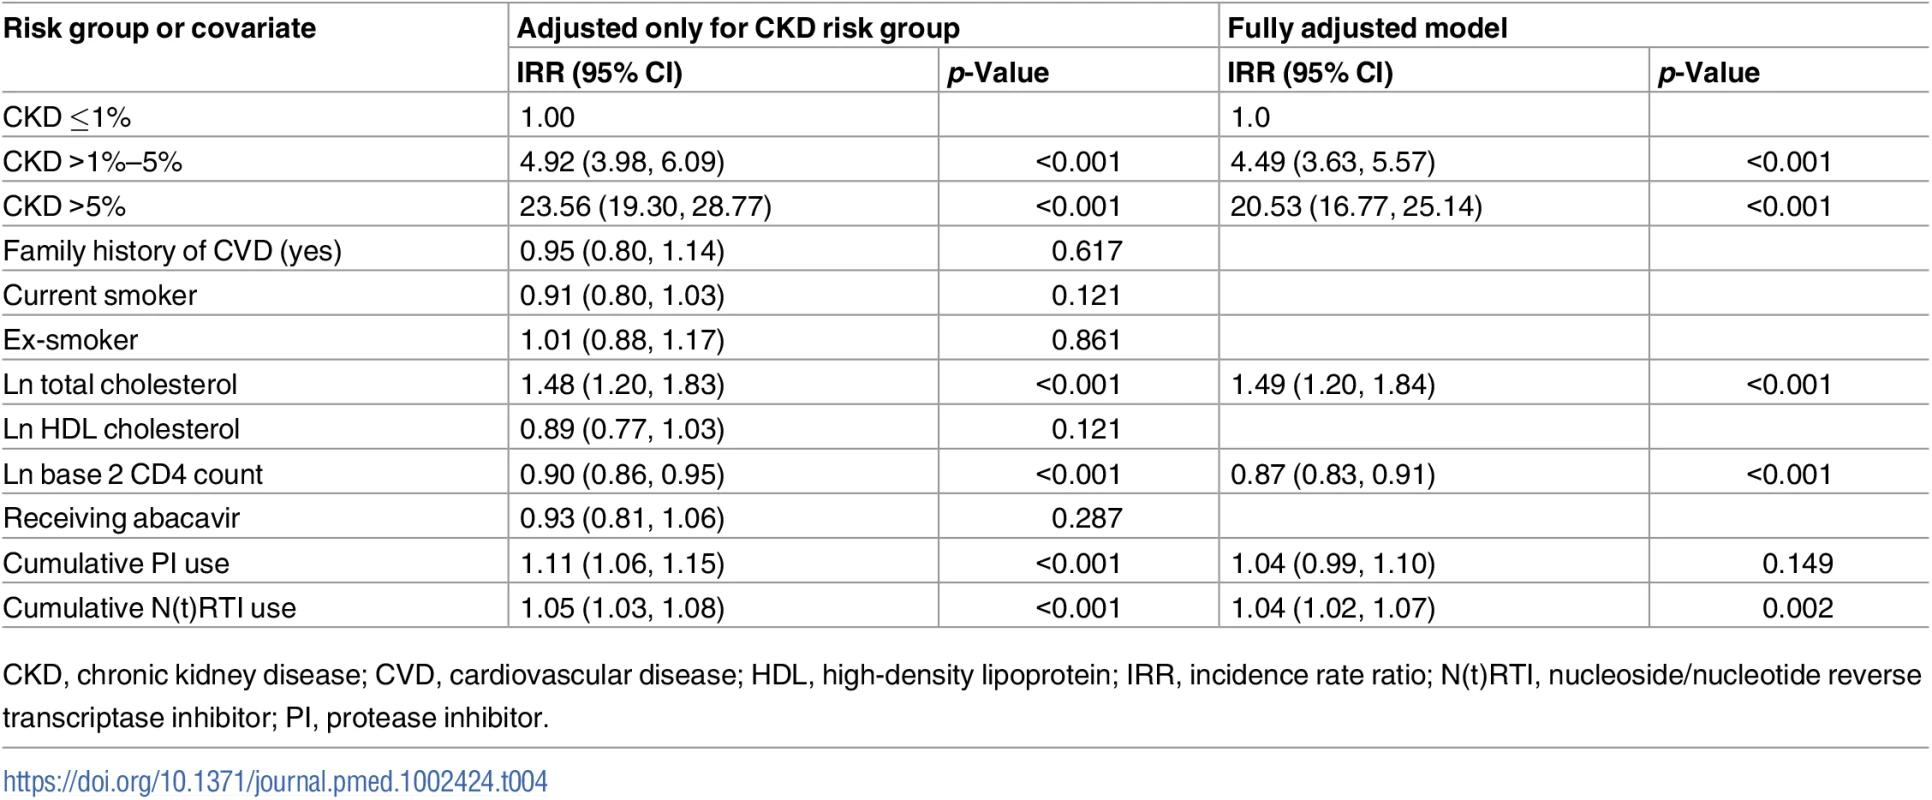
CKD, chronic kidney disease; CVD, cardiovascular disease; HDL, high-density lipoprotein; IRR, incidence rate ratio; N(t)RTI, nucleoside/nucleotide reverse transcriptase inhibitor; PI, protease inhibitor. In a multivariate analysis, after adjusting the covariates for each other as predictors of CKD events, we found similar associations as for the analysis adjusted only for CKD risk group, although the association for receiving a PI lost statistical significance (IRR 1.04, 95% CI 0.99, 1.10, p = 0.149).
Investigating covariates of the CKD risk score as predictors of CVD events
After adjustment for CVD risk group, we found 1 covariate in the CKD risk score that was associated with CVD events (Table 5). Higher nadir CD4 count was associated with a reduced risk of CVD events: IRR 0.94 per 100 cells (95% CI 0.091, 0.98, p = 0.002). We did not find associations between predicted CKD risk and HIV exposure through injecting drug use, baseline eGFR, or being coinfected with viral hepatitis C.
Tab. 5. Covariates of CKD risk score as predictors for CVD events adjusted for CVD risk group. 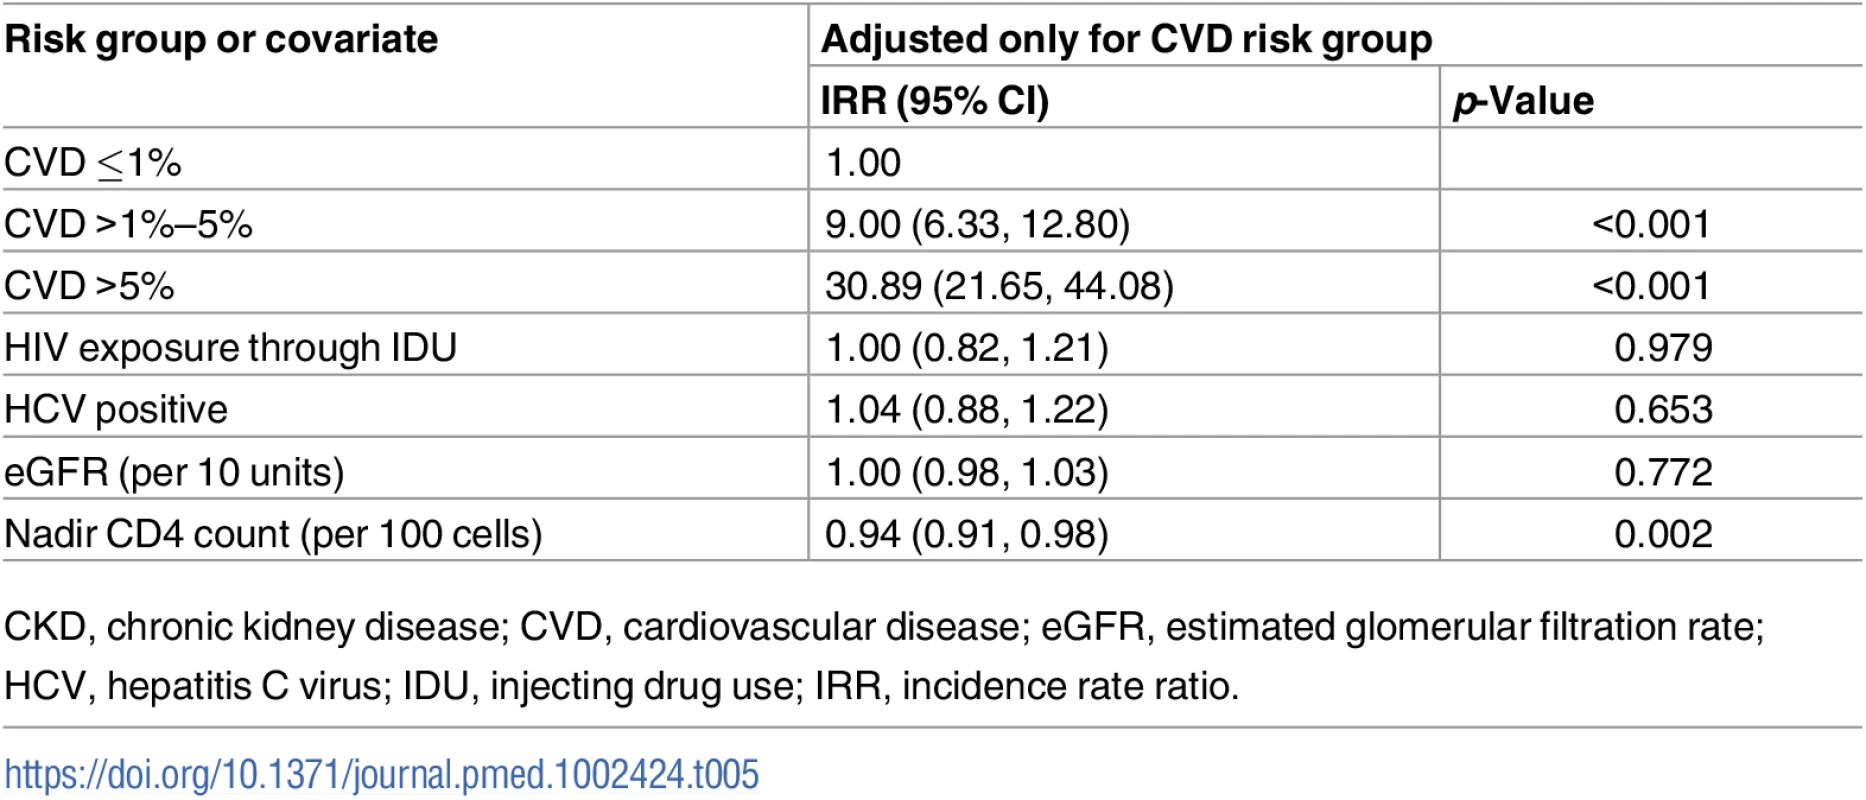
CKD, chronic kidney disease; CVD, cardiovascular disease; eGFR, estimated glomerular filtration rate; HCV, hepatitis C virus; IDU, injecting drug use; IRR, incidence rate ratio. Diabetes by predicted CKD and CVD risk
Diabetes is a key covariate in both the CKD and CVD risk scores. Therefore, we were interested in exploring the prevalence of diabetes in the CKD and CVD predicted risk groups (Table 6). The prevalence of diabetes at baseline increased markedly with higher predicted CVD risk group. The association was less clear with CKD risk group, but of the 1,585 people at >5% predicted risk for both CVD and CKD, 366 (23.1%) had been diagnosed with diabetes.
Tab. 6. Diabetes prevalence at baseline by predicted CKD and CVD risk group. 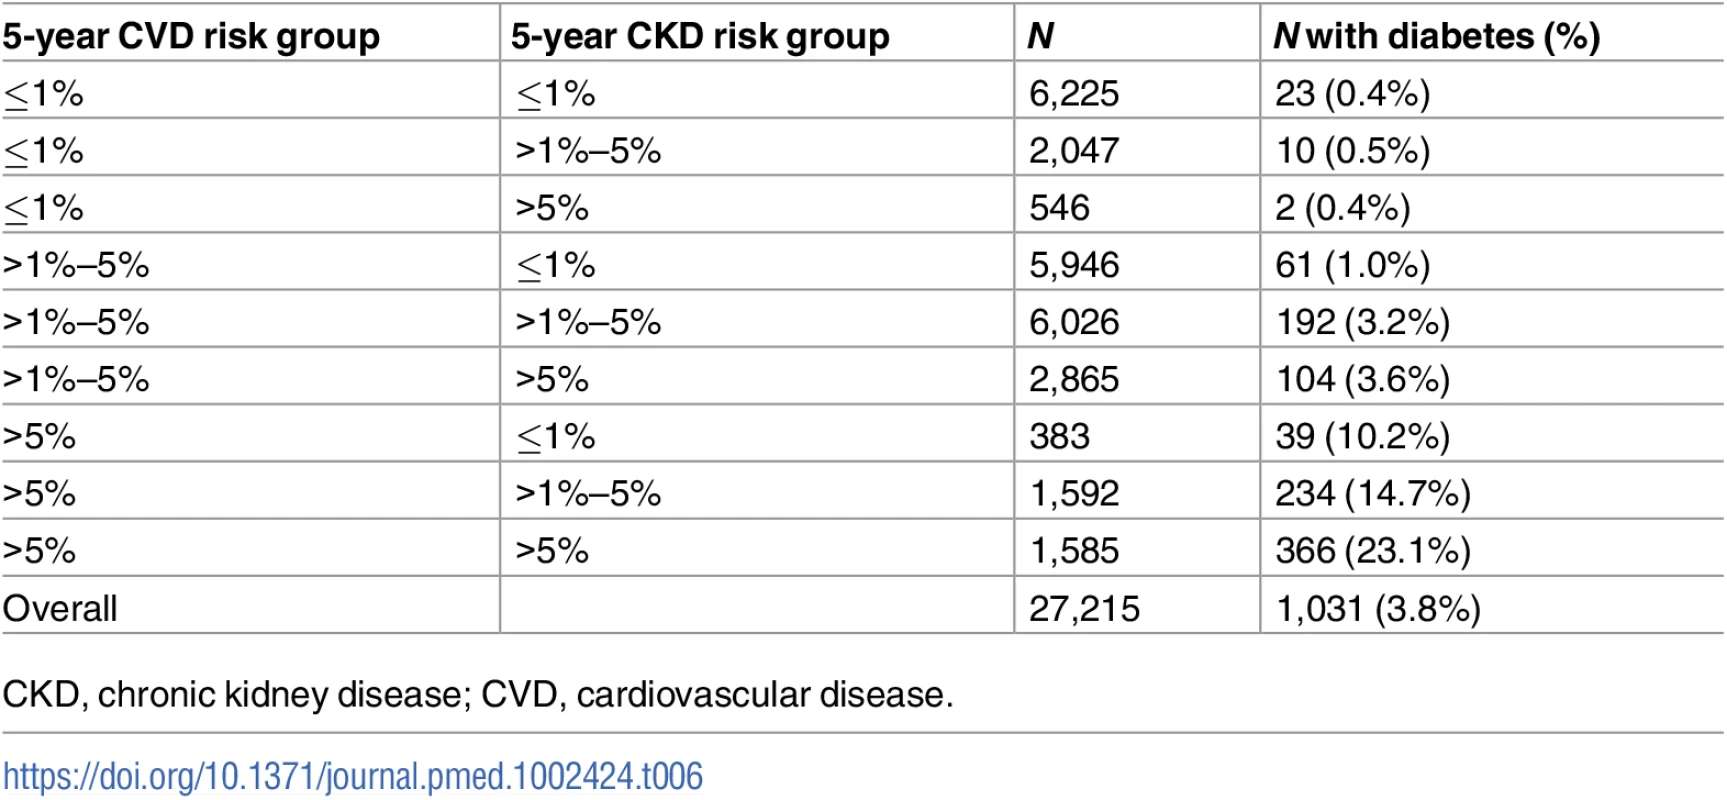
CKD, chronic kidney disease; CVD, cardiovascular disease. Sensitivity analyses
We conducted sensitivity analyses assessing the predicted CKD and CVD risk scores as continuous measures rather than in groups. After adjustment for 5-year predicted CKD risk, 5-year CVD predicted risk was significantly associated with CKD events: IRR 1.065 per 1% increase (95% CI 1.058, 1.072, p < 0.001). Five-year CKD predicted risk was not significantly associated with CVD events after adjustment for 5-year CVD predicted risk: IRR 1.005 per 1% increase (95% CI 1.000, 1.011, p = 0.052). These analyses suggest that the multiplicative effects of predicted CKD and CVD risk groups on CKD and CVD events are not simply due to a loss of precision by categorising the predicted risks as ≤1%, >1%–5%, and >5%.
Discussion
In this analysis we found that HIV-positive people with high predicted CVD or CKD risk were at significant risk for a future CVD or CKD event, and that this risk was multiplicative for those with greater degrees of risk. For instance, we observed a far higher CKD event rate for those at high risk (>5%) for both CVD and CKD (44.0 per 1,000 pyrs) compared to those at low risk for both (0.5 per 1,000 pyrs) and those at intermediate risk for both (5.1 per 1,000 pyrs). We found that the CKD event rate in those with a high CKD risk was highly sensitive to the degree of CVD risk, with a CKD event rate of 7.1, 21.9, and 44.0 events per 1,000 pyrs for a CVD risk of ≤1%, >1%–5%, and >5%, respectively. For CVD events we found that event rates were multiplicative in that there was a gradient from those at low risk for both events (0.45 per 1,000 pyrs) to those at high risk for both events (16.50 per 1,000 pyrs), with those at intermediate risk in between.
It is widely acknowledged that there are complex relationships between CVD and CKD, and that the risks that mediate both of these conditions can interact, leading to more severe illness and poorer prognosis [10]. Our results are consistent with this understanding in that we found that both chronic diseases were associated with an elevated risk for the other. Overall our results suggest that among people living with HIV, the association between CVD risk and a future CKD event is stronger than the association between CKD risk and a future CVD event, and that the strength of the association may be particularly marked in those who are at high risk for both CVD and CKD. This is a novel finding, as the opposite has consistently been noted in the general population, where those with CKD are at markedly elevated risk for CVD. For the general population, for instance, when adjusted for traditional cardiovascular risk factors, impaired kidney function and raised concentrations of albumin in urine increase the risk of CVD 2 - to 4-fold [11]. In interpreting these findings, it should be noted that this difference may be a function of the difference in the definition of the 2 disease endpoints used in the study; CVD is a clinical event adjudicated centrally according to specific criteria, whereas CKD is defined by the presence of impaired renal function as indicated by a laboratory biomarker (eGFR) observed over 2 consecutive occasions at least 3 months apart. This laboratory-based definition is thereby a sensitive measurement that captures people with true CKD but may also include people with transient decreases in eGFR not indicative of irreversible renal function deterioration.
In terms of the risk factors for development of CKD events in those with CVD risk, we found that total cholesterol level and cumulative PI and N(t)RTI use raised the risk of CKD events, and that a higher baseline CD4 count was associated with a lower rate of future CKD events. These findings are consistent with results previously reported in the D:A:D cohort [15–18]. We found that cumulative exposure to N(t)RTIs predicts CKD events, despite tenofovir exposure being included as an adjustment in the CKD predicted risk score. This may be because tenofovir exposure was included in the CKD predicted risk model as an acute effect rather than an effect that increases with increasing exposure.
For CVD events according to CKD risk, we did not find an association between eGFR and CVD risk. This is not consistent with findings in the general community. However, the failure to find such an association may be due to effective management of renal insufficiency, with a resultant decrease in the risk of CVD in this population. This finding also seems inconsistent with previous D:A:D analyses [12]. This apparent inconsistency is likely explained by the fact that the present analysis was based on a single baseline eGFR with participants selected with eGFR in a relatively healthy range (>60 ml/min/1.73 m2), whereas previous analyses were time updated and included far lower eGFR values.
It is recognised that both CKD and CVD are largely preventable conditions and that modifying and controlling their risk factors will reduce the risk of onset of both diseases. Despite this evidence and much effort over the past decade to focus attention on reducing CVD risk in HIV-positive people, a lack of attention to the management of CVD in people living with HIV has been documented [19]. A recent modelling analysis within the ATHENA cohort examined the impact of several interventions, such as earlier antiretroviral treatment, smoking cessation, and anti-hypertensive or lipid-lowering treatment, on future CVD events among HIV-positive people [20]. The results suggested that all the selected interventions, but especially smoking cessation and blood pressure and serum lipid control, would have a positive effect in reducing CVD.
We performed an analysis that assessed the extent to which the presence of diabetes in the participants may provide at least a partial explanation of the multiplicative risks we observed in those with higher degrees of risk, and particularly in those with a high risk for both events. We found that nearly a quarter of those with a high 5-year CKD and CVD risk had been diagnosed with diabetes, compared to very few individuals diagnosed with diabetes (0.4%) in the low CKD and CVD risk groups. This confirms that diabetes is a powerful risk factor for poor outcomes in HIV-positive people, as in the general community, and it behoves all clinicians to adequately screen, diagnose, treat, and, above all, prevent this complication to facilitate the optimal longevity and quality of life in HIV-positive people.
Our study has some limitations. Prediction models are limited by restrictions in the available data, and some variables that may affect CKD and CVD risk were not available for analysis (e.g., inflammatory markers). In this analysis, the risk equations were applied to the datasets that were largely used to develop them. It may be, therefore, that the equations predict more accurately in D:A:D data than they would in other independent datasets, and this may limit the generalisability of our findings. Both equations, however, were validated: the CVD equation using internal—external cross-validation, and the CKD equation on independent datasets. The CVD and CKD endpoints used in this analysis are quite different. CVD is a serious clinical event, subject to central validation, whereas CKD is an earlier, less serious event based on a confirmed laboratory marker. As noted above, compared with the more specific adjudicated CVD endpoint, the CKD definition may be capturing a broader set of events that might include true episodes of chronic and progressive CKD but also transient events in people who may be temporarily systemically unwell, hospitalised, and/or undergoing a medical procedure, all of which may lead to episodic decreases in eGFR without this necessarily resulting in persistent renal dysfunction. We attempted to minimise the possibility of miscategorising people with CKD by requiring there to be at least 2 consecutive eGFR measurements ≤ 60 ml/min/1.73 m2 to make the diagnosis. However, the ‘softer’ definition of CKD may at least partially explain the finding that the magnitude of association was greater when analysing CKD events by CVD risk than when analysing CVD events by CKD risk. It is uncertain how the results might have differed if a hard clinical endpoint for renal disease, such as ESRD, had been used. Such an approach, however, was not possible in our analyses, as a prediction tool for ESRD in HIV-positive people is not available, and the number of ESRD events in D:A:D is not large. In the D:A:D database, we are unable to distinguish cases of either CKD or CVD that were a direct result of a previous event.
In conclusion, we have shown that HIV-positive people not uncommonly have high predicted CVD and/or CKD risk, and that these interact to create substantial risks for future morbid events. We found that people at high predicted risk for both CVD and CKD have substantially greater risks for both CVD and CKD compared with those at low predicted risk for both, and those at high predicted risk for only CVD or only CKD. This suggests that CVD and CKD risk in HIV-positive persons should be assessed together. These data also suggest that the primary prevention and effective management of these comorbidities, prioritising those interventions that have been repeatedly shown to be effective in the general population, will convey the same if not greater benefits for the population of HIV-positive people. Primary prevention and the effective management of comorbidities should be incorporated into the development of guidelines and defining future research priorities for HIV-positive people.
Supporting Information
Zdroje
1. Palella FJ Jr, Delaney KM, Moorman AC, Loveless MO, Fuhrer J, Satten GA, et al. Declining morbidity and mortality among patients with advanced human immunodeficiency virus infection. HIV Outpatient Study Investigators. N Engl J Med. 1998;338 : 853–60. doi: 10.1056/NEJM199803263381301 9516219
2. Lohse N, Hansen AB, Pedersen G, Kronborg G, Gerstoft J, Sørensen HT, et al. Survival of persons with and without HIV infection in Denmark, 1995–2005. Ann Intern Med. 2007;146 : 87–95. 17227932
3. Samji H, Cescon A, Hogg RS, Modur SP, Althoff KN, Buchacz K, et al. Closing the gap: increases in life expectancy among treated HIV-positive individuals in the United States and Canada. PLoS ONE. 2013;8(12):e81355. doi: 10.1371/journal.pone.0081355 24367482
4. Antiretroviral Therapy Cohort Collaboration. Survival of HIV-positive patients starting antiretroviral therapy between 1996 and 2013: a collaborative analysis of cohort studies. Lancet HIV. 2017;4:e349–56. doi: 10.1016/S2352-3018(17)30066-8 28501495
5. Strategies for Management of Antiretroviral Therapy (SMART) Study Group, El-Sadr WM, Lundgren J, Neaton JD, Gordin F, Abrams D, et al. CD4+ count-guided interruption of antiretroviral treatment. N Engl J Med. 2006;355 : 2283–96. doi: 10.1056/NEJMoa062360 17135583
6. Grulich AE, van Leeuwen MT, Falster MO, Vajdic CM. Incidence of cancers in people with HIV/AIDS compared with immunosuppressed transplant recipients: a meta-analysis. Lancet. 2007;370 : 59–67. doi: 10.1016/S0140-6736(07)61050-2 17617273
7. Guaraldi G, Orlando G, Zona S, Menozzi M, Carli F, Garlassi E, et al. Premature age-related comorbidities among HIV-infected persons compared with the general population. Clin Infect Dis. 2011;53 : 1120–6. doi: 10.1093/cid/cir627 21998278
8. Kuller LH, Tracy R, Belloso W, De Wit S, Drummond F, Lane HC, et al. Inflammatory and coagulation biomarkers and mortality in patients with HIV infection. PLoS Med. 2008;5(10):e203. doi: 10.1371/journal.pmed.0050203 18942885
9. INSIGHT START Study Group, Lundgren JD, Babiker AG, Gordin F, Emery S, Grund B, et al. initiation of antiretroviral therapy in early asymptomatic HIV infection. N Engl J Med. 2015;373 : 795–807. doi: 10.1056/NEJMoa1506816 26192873
10. Gansevoort RT, Correa-Rotter R, Hemmelgarn BR, Jafar TH, Lambers Heerspink HJ, Mann JF, et al. Chronic kidney disease and cardiovascular risk: epidemiology, mechanisms, and prevention. Lancet. 2013;382 : 339–52. doi: 10.1016/S0140-6736(13)60595-4 23727170
11. Chronic Kidney Disease Prognosis Consortium, Matsushita K, van der Velde M, Astor BC, Woodward M, Levey AS, et al. Association of estimated glomerular filtration rate and albuminuria with all-cause and cardiovascular mortality in general population cohorts: a collaborative meta-analysis. Lancet. 2010;375 : 2073–81. doi: 10.1016/S0140-6736(10)60674-5 20483451
12. Ryom L, Lundgren JD, Ross M, Kirk O, Law M, Morlat P, et al. Renal impairment and cardiovascular disease in HIV-positive individuals: the D:A:D Study. J Infect Dis. 2016;214 : 1212–20. doi: 10.1093/infdis/jiw342 27485357
13. Friis-Møller N, Ryom L, Smith C, Weber R, Reiss P, Dabis F, et al. An updated prediction model of the global risk of cardiovascular disease in HIV-positive persons: the Data-collection on Adverse Effects of Anti-HIV Drugs (D:A:D) study. Eur J Prev Cardiol. 2016;23 : 214–23. doi: 10.1177/2047487315579291 25882821
14. Mocroft A, Lundgren JD, Ross M, Law M, Reiss P, Kirk O, et al. Development and validation of a risk score for chronic kidney disease in HIV infection using prospective cohort data from the D:A:D study. PLoS Med. 2015;12:e1001809. doi: 10.1371/journal.pmed.1001809 25826420
15. DAD Study Group, Friis-Møller N, Reiss P, Sabin CA, Weber R, Monforte Ad, et al. Class of antiretroviral drugs and the risk of myocardial infarction. N Engl J Med. 2007;26;356 : 1723–35. doi: 10.1056/NEJMoa062744 17460226
16. D:A:D Study Group, Sabin CA, Worm SW, Weber R, Reiss P, El-Sadr W, et al. Use of nucleoside reverse transcriptase inhibitors and risk of myocardial infarction in HIV-infected patients enrolled in the D:A:D study: a multi-cohort collaboration. Lancet. 2008;371 : 1417–26. Erratum in: Lancet. 2008;372 : 292. doi: 10.1016/S0140-6736(08)60423-7 18387667
17. Data Collection on Adverse Events of Anti-HIV Drugs Study Group, Sabin CA, d’Arminio Monforte A, Friis-Moller N, Weber R, El-Sadr WM, et al. Changes over time in risk factors for cardiovascular disease and use of lipid-lowering drugs in HIV-infected individuals and impact on myocardial infarction. Clin Infect Dis. 2008;46 : 1101–10. doi: 10.1086/528862 18461712
18. Mocroft A, Lundgren JD, Ross M, Fux CA, Reiss P, Moranne O, et al. Cumulative and current exposure to potentially nephrotoxic antiretrovirals and development of chronic kidney disease in HIV-positive individuals with a normal baseline estimated glomerular filtration rate: a prospective international cohort study. Lancet HIV. 2016;3:e23–32. doi: 10.1016/S2352-3018(15)00211-8 26762990
19. van Zoest RA, van der Valk M, Wit FW, Vaartjes I, Kooij KW, Hovius JW, et al. Suboptimal primary and secondary cardiovascular disease prevention in HIV-positive individuals on antiretroviral therapy. Eur J Prev Cardiol. 2017;24 : 1297–307. doi: 10.1177/2047487317714350 28578613
20. Smit M, van Zoest RA, Nichols BE, Vaartjes I, Smit C, van der Valk M, et al. Cardiovascular disease prevention policy in HIV: recommendations from a modelling study. Clin Infect Dis. 2017 Oct 6. 29029103
Štítky
Interní lékařství
Článek Contemporary disengagement from antiretroviral therapy in Khayelitsha, South Africa: A cohort studyČlánek Bioequivalence of twice-daily oral tacrolimus in transplant recipients: More evidence for consensus?
Článek vyšel v časopisePLOS Medicine
Nejčtenější tento týden
2017 Číslo 11- Berberin: přírodní hypolipidemikum se slibnými výsledky
- Léčba bolesti u seniorů
- Příznivý vliv Armolipidu Plus na hladinu cholesterolu a zánětlivé parametry u pacientů s chronickým subklinickým zánětem
- Jak postupovat při výběru betablokátoru − doporučení z kardiologické praxe
- Červená fermentovaná rýže účinně snižuje hladinu LDL cholesterolu jako vhodná alternativa ke statinové terapii
-
Všechny články tohoto čísla
- Labour trafficking: Challenges and opportunities from an occupational health perspective
- The end of HIV: Still a very long way to go, but progress continues
- Contemporary disengagement from antiretroviral therapy in Khayelitsha, South Africa: A cohort study
- Bioequivalence of twice-daily oral tacrolimus in transplant recipients: More evidence for consensus?
- Treatment guidelines and early loss from care for people living with HIV in Cape Town, South Africa: A retrospective cohort study
- Perinatal mortality associated with induction of labour versus expectant management in nulliparous women aged 35 years or over: An English national cohort study
- Core Outcome Set-STAndards for Development: The COS-STAD recommendations
- Closing the gaps in the HIV care continuum
- Association between the 2012 Health and Social Care Act and specialist visits and hospitalisations in England: A controlled interrupted time series analysis
- HIV pre-exposure prophylaxis and early antiretroviral treatment among female sex workers in South Africa: Results from a prospective observational demonstration project
- Sexual exploitation of unaccompanied migrant and refugee boys in Greece: Approaches to prevention
- Child sex trafficking in the United States: Challenges for the healthcare provider
- The expanding epidemic of HIV-1 in the Russian Federation
- Cardiovascular disease (CVD) and chronic kidney disease (CKD) event rates in HIV-positive persons at high predicted CVD and CKD risk: A prospective analysis of the D:A:D observational study
- Validity of a minimally invasive autopsy for cause of death determination in maternal deaths in Mozambique: An observational study
- malERA: An updated research agenda for malaria elimination and eradication
- malERA: An updated research agenda for health systems and policy research in malaria elimination and eradication
- A combination intervention strategy to improve linkage to and retention in HIV care following diagnosis in Mozambique: A cluster-randomized study
- Bioequivalence between innovator and generic tacrolimus in liver and kidney transplant recipients: A randomized, crossover clinical trial
- malERA: An updated research agenda for basic science and enabling technologies in malaria elimination and eradication
- Human trafficking and exploitation: A global health concern
- Virological response and resistance among HIV-infected children receiving long-term antiretroviral therapy without virological monitoring in Uganda and Zimbabwe: Observational analyses within the randomised ARROW trial
- Postmenopausal hormone therapy and risk of stroke: A pooled analysis of data from population-based cohort studies
- Lansoprazole use and tuberculosis incidence in the United Kingdom Clinical Practice Research Datalink: A population based cohort
- malERA: An updated research agenda for insecticide and drug resistance in malaria elimination and eradication
- Safety, pharmacokinetics, and immunological activities of multiple intravenous or subcutaneous doses of an anti-HIV monoclonal antibody, VRC01, administered to HIV-uninfected adults: Results of a phase 1 randomized trial
- HIV prevalence and behavioral and psychosocial factors among transgender women and cisgender men who have sex with men in 8 African countries: A cross-sectional analysis
- Treatment eligibility and retention in clinical HIV care: A regression discontinuity study in South Africa
- malERA: An updated research agenda for characterising the reservoir and measuring transmission in malaria elimination and eradication
- Effectiveness of a combination strategy for linkage and retention in adult HIV care in Swaziland: The Link4Health cluster randomized trial
- The value of confirmatory testing in early infant HIV diagnosis programmes in South Africa: A cost-effectiveness analysis
- HIV self-testing among female sex workers in Zambia: A cluster randomized controlled trial
- The US President's Malaria Initiative, transmission and mortality: A modelling study
- Comparison of two cash transfer strategies to prevent catastrophic costs for poor tuberculosis-affected households in low- and middle-income countries: An economic modelling study
- Direct provision versus facility collection of HIV self-tests among female sex workers in Uganda: A cluster-randomized controlled health systems trial
- malERA: An updated research agenda for diagnostics, drugs, vaccines, and vector control in malaria elimination and eradication
- malERA: An updated research agenda for combination interventions and modelling in malaria elimination and eradication
- HIV-1 persistence following extremely early initiation of antiretroviral therapy (ART) during acute HIV-1 infection: An observational study
- Respondent-driven sampling for identification of HIV- and HCV-infected people who inject drugs and men who have sex with men in India: A cross-sectional, community-based analysis
- Extensive virologic and immunologic characterization in an HIV-infected individual following allogeneic stem cell transplant and analytic cessation of antiretroviral therapy: A case study
- Measuring success: The challenge of social protection in helping eliminate tuberculosis
- Prospects for passive immunity to prevent HIV infection
- Reaching global HIV/AIDS goals: What got us here, won't get us there
- Evidence-based restructuring of health and social care
- Extreme exploitation in Southeast Asia waters: Challenges in progressing towards universal health coverage for migrant workers
- PLOS Medicine
- Archiv čísel
- Aktuální číslo
- Informace o časopisu
Nejčtenější v tomto čísle- Postmenopausal hormone therapy and risk of stroke: A pooled analysis of data from population-based cohort studies
- Bioequivalence between innovator and generic tacrolimus in liver and kidney transplant recipients: A randomized, crossover clinical trial
- HIV pre-exposure prophylaxis and early antiretroviral treatment among female sex workers in South Africa: Results from a prospective observational demonstration project
- Bioequivalence of twice-daily oral tacrolimus in transplant recipients: More evidence for consensus?
Kurzy
Zvyšte si kvalifikaci online z pohodlí domova
Současné možnosti léčby obezity
nový kurzAutoři: MUDr. Martin Hrubý
Všechny kurzyPřihlášení#ADS_BOTTOM_SCRIPTS#Zapomenuté hesloZadejte e-mailovou adresu, se kterou jste vytvářel(a) účet, budou Vám na ni zaslány informace k nastavení nového hesla.
- Vzdělávání


