-
Články
Top novinky
Reklama- Vzdělávání
- Časopisy
Top články
Nové číslo
- Témata
Top novinky
Reklama- Videa
- Podcasty
Nové podcasty
Reklama- Kariéra
Doporučené pozice
Reklama- Praxe
Top novinky
ReklamaFunctional Organization of a Multimodular Bacterial Chemosensory Apparatus
Myxococcus xanthus is a social bacterium that exhibits a complex life cycle including biofilm formation, microbial predation and the formation of multicellular fruiting bodies. Genomic analyses indicate that M. xanthus produces an unusual number of chemosensory proteins: eight chemosensory systems (CSS) and 21 chemoreceptors, 13 of which are orphans located outside operons. In this paper we used genetic, phylogenetic and cell biology techniques to analyze the organization of the chemoreceptors and their functions in the regulation of M. xanthus social behaviors. Results indicate the existence of one large and three small chemosensory modules that occupy different positions within cells. This organization is consistent with in vivo protein interaction assays. Our analyses revealed the presence of a complex network of regulators that might integrate different stimuli to modulate bacterial social behaviors. Such networks might be conserved in other bacterial species with a life cycle of similar complexity and whose genome carries multiple CSS encoding operons.
Published in the journal: . PLoS Genet 10(3): e32767. doi:10.1371/journal.pgen.1004164
Category: Research Article
doi: https://doi.org/10.1371/journal.pgen.1004164Summary
Myxococcus xanthus is a social bacterium that exhibits a complex life cycle including biofilm formation, microbial predation and the formation of multicellular fruiting bodies. Genomic analyses indicate that M. xanthus produces an unusual number of chemosensory proteins: eight chemosensory systems (CSS) and 21 chemoreceptors, 13 of which are orphans located outside operons. In this paper we used genetic, phylogenetic and cell biology techniques to analyze the organization of the chemoreceptors and their functions in the regulation of M. xanthus social behaviors. Results indicate the existence of one large and three small chemosensory modules that occupy different positions within cells. This organization is consistent with in vivo protein interaction assays. Our analyses revealed the presence of a complex network of regulators that might integrate different stimuli to modulate bacterial social behaviors. Such networks might be conserved in other bacterial species with a life cycle of similar complexity and whose genome carries multiple CSS encoding operons.
Introduction
Perceiving and responding to external stimuli allows living organisms to adapt to changes in their environment and thus enhance their survival fitness. Perception universally occurs through the aid of receptors coupled to signaling pathways that translate an initial signal into the appropriate cellular behaviors. Perception of stimuli in bacteria is largely mediated by one-component, two-component and chemosensory systems (CSS). CSS are modified two-component systems in which the histidine kinase, CheA, does not directly perceive the chemical signal [1]. Instead, this function is delegated to specialized chemoreceptors, known as Methyl-accepting Chemotaxis Proteins (MCPs) for the presence of a methyl-accepting domain in their C-terminal cytoplasmic region [2]. An adaptor protein, CheW, facilitates the interaction between the MCP and the CheA proteins. MCPs are methylated and demethylated on glutamate residues by a methyltransferase (CheR) and a methylesterase (CheB), respectively [2]. These enzymatic activities allow adaptation of the receptor to persistent stimuli [3]. The best-studied CSS are specialized for chemotaxis. In this case, the output response regulator CheY has the function of directly communicating with the flagellar motor proteins, FliM and FliN, in order to adjust the cell swimming behavior [4]. Interestingly, over the past years, many CSS have been identified that regulate behavioral responses other than taxis [5]. Examples are the Myxococcus xanthus Che3 system that regulates gene expression during development [6], the Pseudomonas aeruginosa Wsp system that regulates c-di-GMP production and biofilm formation [7] and the Rhodospirillum centenum Che3 system involved in cyst formation.
When multiple receptors mediate signal reception and stimulate kinase activity, the various signals must be integrated to generate a single response. For example, in the E. coli Che system that contains a single chemosensory pathway, five receptors of different ligand specificity signal to the same kinase, CheA [8], [9]. However, in bacteria with multiple chemosensory pathways, the recruitment of chemoreceptors to the different Che systems depends on protein specificity and the physical location of the Che modules [10], [11]. Structural studies have shown that receptor clusters are formed by interconnected heterotrimers of homodimers, which are associated with two CheWs and a dimer of CheA. Receptor homodimers can in turn form heterotrimers if they share common structural features and belong to the same class [12], [13]. The spatial segregation of MCPs to distinct cellular compartments also plays a role in the partitioning of MCPs among multiple CSS. For example, in Rhodobacter sphaeroides, membrane-associated and soluble MCPs are partitioned between polar and cytoplasmic clusters [10], [14].
We have been studying the multiple CSS of the Gram negative δ-proteobacterium Myxococcus xanthus. M. xanthus carries up to eight predicted chemosensory systems with 21 chemoreceptors [15], [16]. We speculate that the large number of CSS reflects the complexity of the M. xanthus life cycle, in which cells swarm as large groups to prey on other micro-organisms or build multicellular fruiting bodies [17]–[20]. Movement on surfaces does not employ flagella but instead requires two distinct motility machineries: polar retractile Type IV pili required for social (S) motility [21], [22] and distributed Agl-Glt complexes that form periodic foci and generate thrust for adventurous (A) motility [23]–[27].
Evidence suggests that M. xanthus motility behaviors are controlled by CSS. The Frz pathway, the first characterized Che-like system from M. xanthus, controls both motility systems by triggering periodic cellular reversals. This allows the bacteria to periodically reorient themselves, and may be similar to periodic switches in flagellar rotation, which allow the enteric bacteria to move along a chemotactic gradient by following a biased random swim. Motility is also regulated by Dif (Che2), a second sensory system that controls the production of surface exopolysaccharides in response to pilus activity [28]. Che4, a third CSS, also appears to be involved in the regulation of motility, although the specific mechanism remains unclear [29]. However, CSS are not exclusively dedicated to motility regulation in M. xanthus. In fact, the Che3 system regulates gene expression during fruiting body development [6], [29]–[32]. While future M. xanthus research on the exact contribution of each Che-like system to its life cycle will yield considerable biological insights, this task is complicated by the occurrence of 21 MCPs encoded in its chromosome, 13 of which are orphans. Furthermore, the activity of each CSS might be modulated by multiple MCPs as shown in other bacterial species. Cross-regulation and redundancies between additional pathways may also occur and thus further complicate the picture.
In this work, we set out to characterize each M. xanthus CSS and MCP and combine phylogenetic and cell biology analyses to examine their organization within cells to constitute functional modules. With this approach, we were able to show that MCPs belonging to the same phylogenetic group colocalize in cells and interact in vivo with components of CSS of their respective phylogenetic group. Protein-protein interaction analyses also suggest that colocalizing CSS belonging to same phylogenetic group constitute a unique large sensory module. Such organization is likely required to regulate complex cell behaviors such as biofilm and fruiting body formation. This analysis provides a broad perspective as to the function and organization of complex multicomponent chemosensory systems within bacterial cells and could be applicable to bacterial systems with similarly complex regulatory networks.
Results/Discussion
Identification of M. xanthus chemosensory modules
Four Che pathways have been characterized in M. xanthus: Frz, Dif, Che3 and Che4 [6], [29], [30], [33]. We used the conserved protein domain sequences from these pathways (Tables 1, 2 and 3) as queries to search for all M. xanthus Che homologues. Most che genes are organized in eight che operons, as previously described (Figure 1) [31]. Their predicted organization is depicted in Figure S1. The M. xanthus genome does not contain homologs of CheD and CheX or of CheZ, which are usually found in genomes of β - and γ-proteobacteria [1], [34]. None of the eight che clusters is located near known motility genes or other genes encoding cellular functions known to be controlled by CSS [6], [35], [13], [36].
Fig. 1. Genetic clusters carrying che genes in M. xanthus. 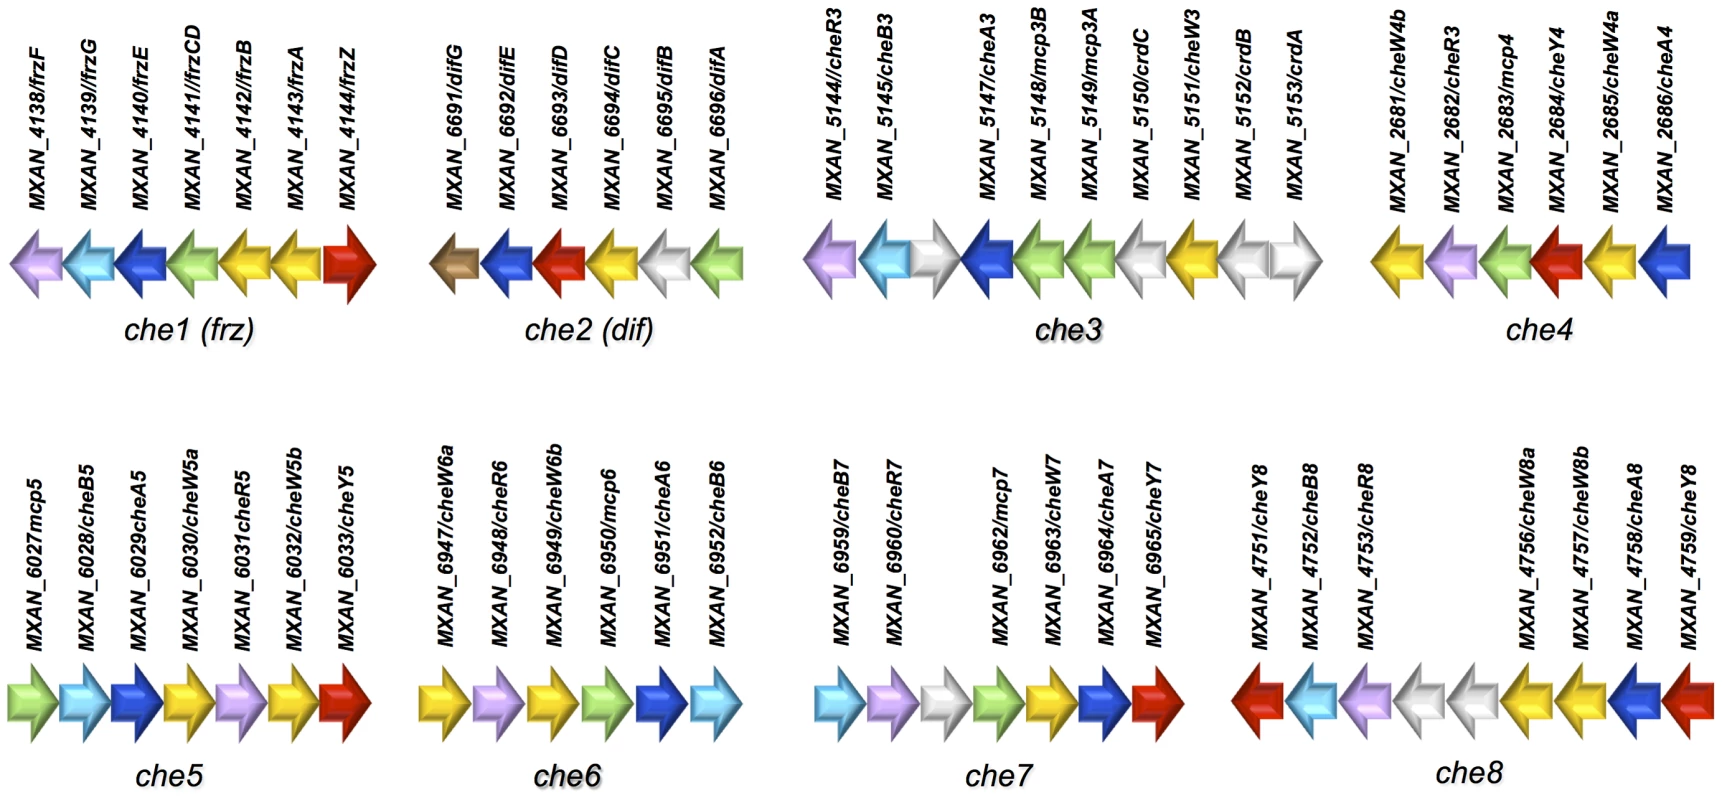
Genetic organization of the genes composing the eight che clusters encoding the putative components of the chemosensory apparatus in Myxococcus xanthus. Predicted genes are indicated with their locus_tag, and their annotations and assigned names. The color code indicates homologous genes. Tab. 1. List of M. xanthus MCPs.b 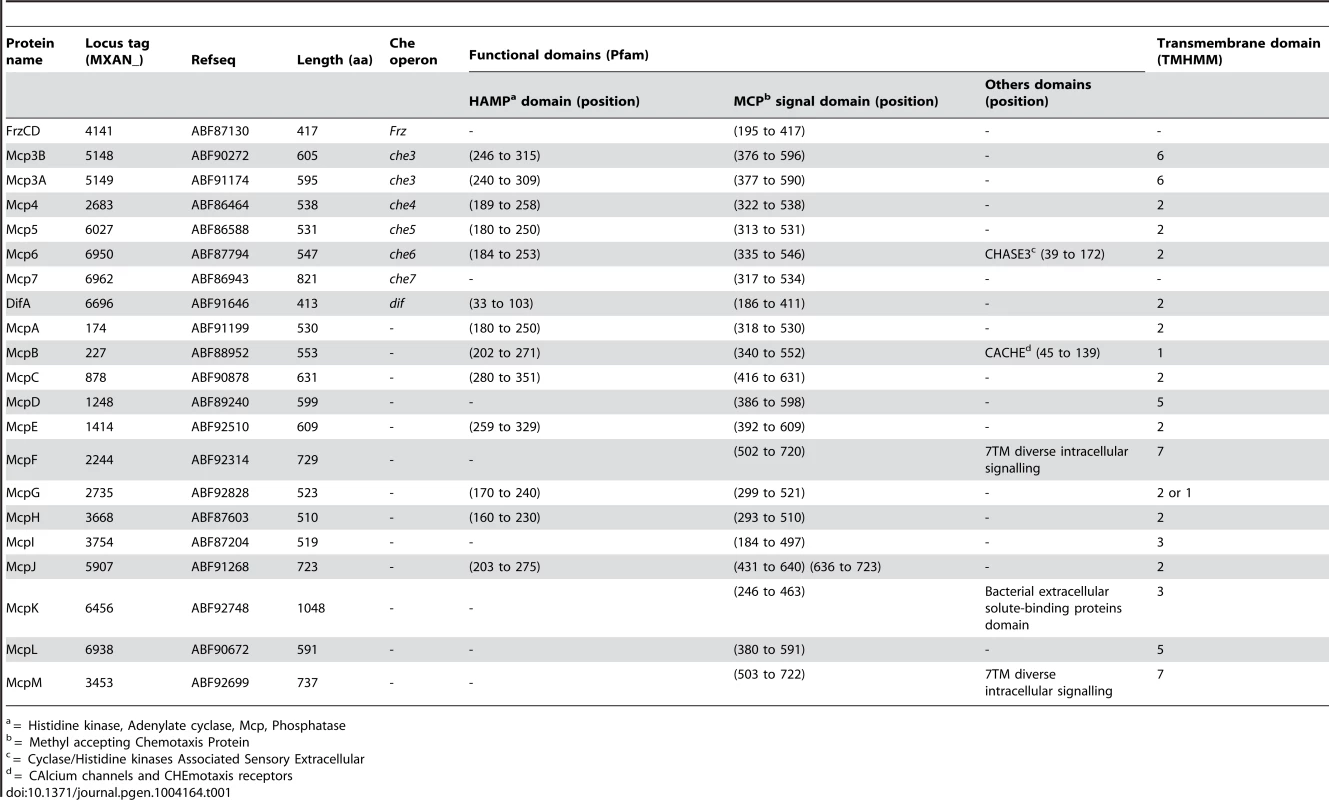
= Histidine kinase, Adenylate cyclase, Mcp, Phosphatase Tab. 2. List of <i>M. xanthus</i> CheA, CheW and CheY. 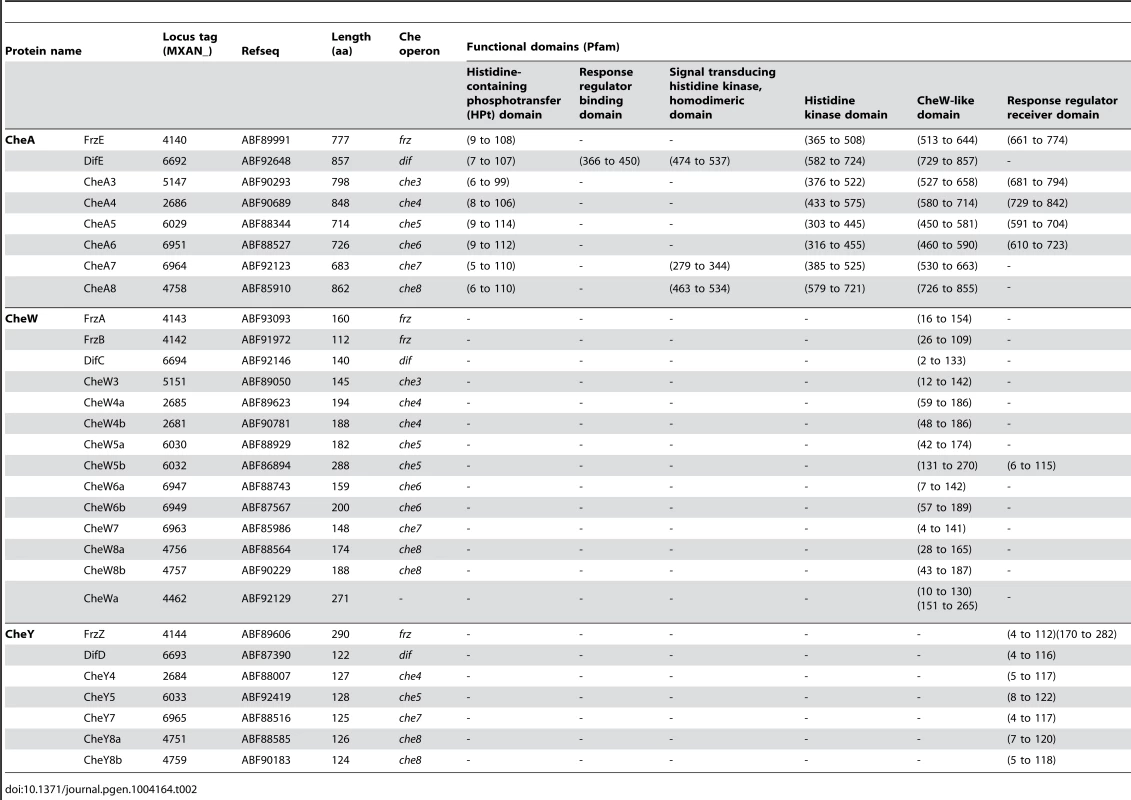
Tab. 3. List of M. xanthus CheB and CheR. 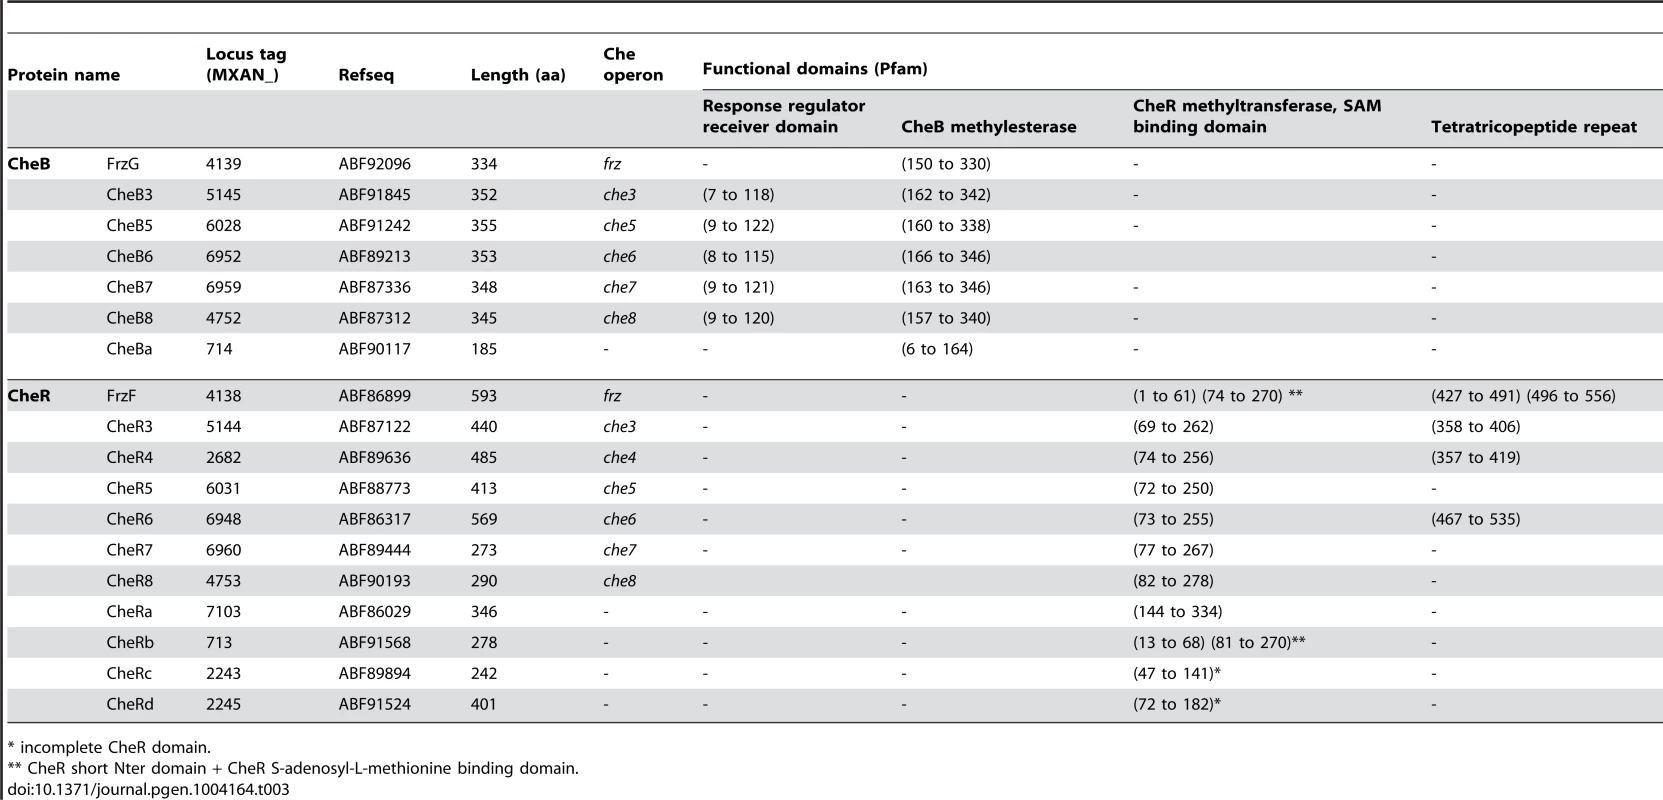
* incomplete CheR domain. In addition to che operon encoded proteins, we identified several orphan che genes and 13 mcp genes dispersed throughout the chromosome (Tables 1–3). The other M. xanthus Che proteins with their respective locus tags, protein lengths and specific domains are listed in Tables 2 and 3. We did not conduct a thorough analysis of CheY homologs as the M. xanthus genome encodes 260 predicted response regulator domains (data not shown). In addition, it is impossible to distinguish if these proteins retain CheY function based on the sequence alone [1]. We reasonably assume that the response regulator domains encoded within the eight che operons constitute the minimum set of M. xanthus CheYs (Table 2).
Deletions of cheA and mcp genes affect motility and fruiting body formation
In order to determine the function of the different MCPs and CSS during vegetative and developmental behaviors, we constructed a set of in-frame deletion strains in which all of the mcp and cheA genes were systematically deleted, with the exception of those for which an in-frame deletion in the wild-type strain DZ2 already existed (frzCD, frzE, mcp3A, mcp3B and mcp4) [6], [29], [37]. Deletions in cheA3, cheA7, cheA4, mcp6, mcpA, mcpH, mcpL and mcpM caused S-motility defects, which significantly reduced or enhanced colony spreading compared to wild-type (p<0.05) (Figure 2A). This was also true for ΔdifE, ΔfrzE, ΔdifA and ΔfrzCD, for which a S-motility defect has already been described [33], [38].
Fig. 2. Motility and fruiting body formation defects of Δmcp and ΔcheA mutants. 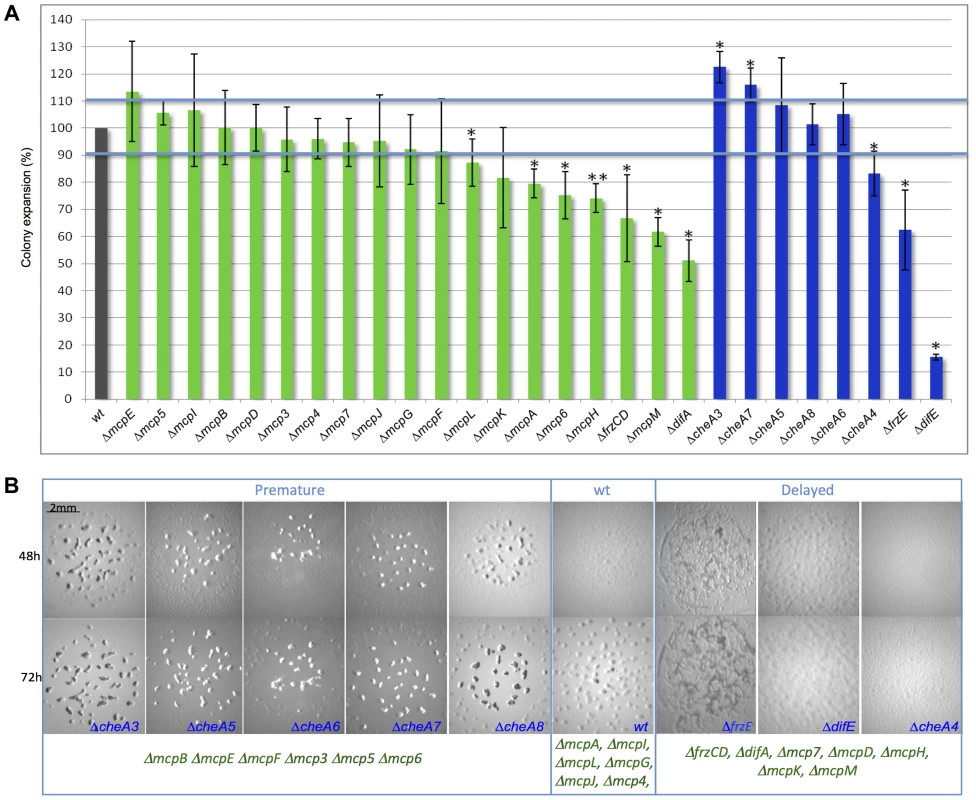
(A) Motility was measured after 48 h. Colony spreading of each mutant was normalized with that of a ΔpilA strain [72] completely incapable of S motility, to exclude cell growth effects. Error bars indicate standard deviations. One star corresponds to p<0.05; two stars correspond to p<0.005. (B) ΔcheA fruiting body formation images at 48 h and 72 h are shown. We identified classes of mutants developing earlier or later than wild type. Pictures of Δmcp fruiting bodies are shown in Figure S2. The blue color indicates ΔcheA mutants, green Δmcp. At least 13 Δmcp and all ΔcheA strains were defective in fruiting body formation, showing altered developmental timing or displayed a complete absence of development (Figures 2B and S2). M. xanthus fruiting body formation requires a functional motility apparatus. Therefore, in ΔcheA4, ΔcheA7, ΔmcpH, ΔmcpM and Δmcp6 strains, the developmental defects might result from the motility defects also shown by these mutants (Figure 2A and B). However, in most cases the two phenotypes are unrelated, suggesting that most Che proteins either regulate motility exclusively during development or are involved in functions other than motility in M. xanthus. In order to check whether the Δmcp and ΔcheA strains were capable of A motility, we systematically deleted the pilA gene in each Δmcp and ΔcheA strain to exclude an effect of S motility, as this motility system is active on the substrate commonly used to test A motility (1.5% agar plates) [37]. All double mutants displayed individual cells at the colony edges suggesting the presence of a functional A-motility system (Figure S3). Notably, we were unsuccessful at deleting mcpC, suggesting that this gene might be essential in M. xanthus. In our assays, mutants lacking McpG, McpI, McpJ, McpL and Mcp4 did not display any defects (Figures 2 and S2). Among these MCPs, McpI and McpL are not expressed in cells (see below), similar to that observed in the R. sphaeroides cheOp1 operon [39]. In the case of Mcp4, McpG and McpJ, which were clearly expressed in cells (see below), the corresponding mutants might display insignificant defects or have functions masked by the presence of another MCP.
Interestingly, most cheA deletions caused more severe defects than deletions of mcp genes from the same operons. These results support the hypothesis that each CSS is activated by multiple receptors, as CheAs are core components of CSS. Thus, phenotypic analyses can be ambiguous for the purpose of clustering M. xanthus MCPs into functional modules. Indeed, MCPs showing opposing functions may still signal to the same Che pathway and contribute differently to the final response. For example, it has been recently shown that the Tar and Tsr E. coli chemoreceptors, both signaling to the same CheA, show opposite pH-taxis responses [40].
M. xanthus MCP and Che proteins show similar phylogenetic distributions
To obtain additional insights on MCP-CSS associations in M. xanthus, we compared the phylogeny of the MCPs to the phylogeny of the CSS, reasoning that MCPs and CSS that share the same phylogenetic distribution might be functionally associated. We started by determining the phylogenetic associations among the eight M. xanthus Che clusters. First, we obtained the individual phylogenies of the MCP, CheA, CheW, CheR and CheB proteins from those clusters. The five individual phylogenies showed similar topologies (Figure S4). However, as these phylogenies were based on a limited number of unambiguously aligned positions and the nodes of the inferred trees were often weekly supported (PP<0.5), we concatenated the MCP, CheA, CheR and CheB sequences from each locus into a super-sequence and used the resulting supermatrix to obtain phylogenetic trees with a higher resolution (Figure 3A). Whenever a Che cluster contained two homologues of uncertain orthologous relationship, we excluded them from the concatenation. This was the case for CheY-like and CheW-like proteins (Table 2). In the case of the Che3 system, Mcp3A and Mcp3B derive from a recent duplication in the Cystobacterineae (unpublished) and thus Mcp3B was included in the supermatrix. The tree obtained from the concatenated data sets was significantly more resolved than the individual trees (Figure 3A and Figure S4). Figure 3A shows that the Che clusters may be categorized in three main groups: Group 1 containing Dif, Che7 and Che8; Group 2, FrzCD and Che3; Group 3, Che4, Che5 and Che6.
Fig. 3. M. xanthus MCPs and CSS are organized in three taxonomic groups. 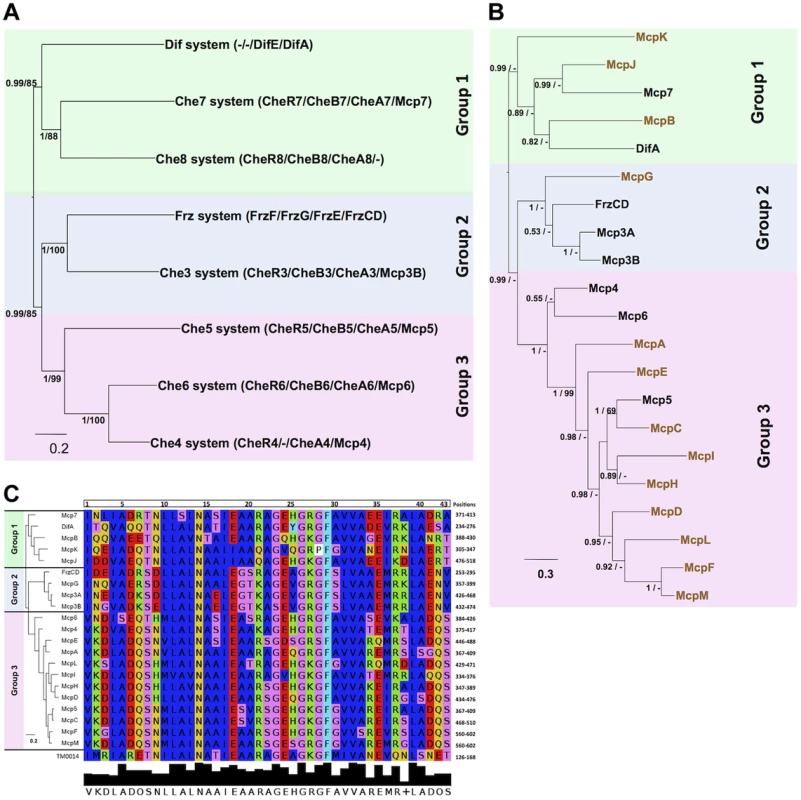
(A) Concatamers of M. xanthus Che protein sequences were generated as described in Methods. Based on PP values, the eight concatamers can be divided into Group 1 (green background), Group 2 (blue background) and Group 3 (pink background). (B) The tree generated for the 21 M. xanthus MCP homologs shows a similar partition in three groups. The MCPs in black belong to che operons, while the MCPs in color are the orphans. (C) A tree generated with the MCP conserved protein sequences involved in the MCP-CheW interaction (Vu et al., 2012) gives rise to the same distribution as in (B). The alignment of the protein sequences involved in the MCP-CheW interaction from T. maritime [41] and M. xanthus MCPs is shown. Colors indicate residues with the same properties. Numbers at nodes in (A) and (B) indicate posterior probabilities (PP) computed by MrBayes and bootstrap values (BV) computed by PhyML. Only PP and BV above 0.5 and 50% are shown. The scale bars represent the average number of substitutions per site. Next, in order to assign the 13 orphan MCPs of M. xanthus to a Che system, we performed a phylogenetic analysis of the 21 MCPs. The resulting MCP tree was strongly correlated. Specifically, the 21 MCPs formed three major monophyletic groups (PP = 0.99, Figure 3B) with the first group containing five MCPs (McpB, McpJ, McpK, DifA and Mcp7). Phylogenetic analyses suggest that Mcp7 and McpJ emerged upon a recent gene duplication event and that McpB is closely related to DifA (data not shown). Group 2 contains FrzCD, McpG, Mcp3A and Mcp3B and Group 3, the largest group, contains all of the remaining MCPs. In Groups 2 and 3, the MCPs are strongly associated and therefore may have emerged by recent gene duplication events in the δ-proteobacteria.
The congruence between the MCP and CSS distributions suggests that phylogenetic relationships may be useful in predicting MCP-Che associations. These associations should be reflected in binding specificities such that MCPs that interact with the same downstream Che module should have similar CheW-binding motifs. It has been recently shown that a short peptide sequence is involved in MCP-CheW binding in T. maritima [41], [42]. All M. xanthus MCPs contained a conserved predicted CheW-binding motif (Figure 3C). Such motifs were aligned and the alignment was used to construct a phylogenetic tree. Although the nodes were poorly supported due to the short sequences, the resulting tree presented the same topology observed in Figure 3B. This analysis further suggests that MCPs belonging to the same group have similar binding specificities and are associated with the same CheW and, therefore, Che system.
The MCP C-terminal methylated domain is constituted by a repetition of several heptamers. MCPs can be classified depending on the number of these heptamers and, therefore, on the length of the C-terminal region [12]. It appears that MCPs of different lengths cannot form trimers of dimers as has been described for the P. aeruginosa McpB and WspA belonging to class 36H and 40H [43], [44], or R. sphaeroides McpG and TlpT belonging to classes 34H and 36H [45], [46]. Sequence analyses based on the Alexander and Zhulin classification show that all M. xanthus MCPs belong to class 40H, with the exception of DifA and McpK which belong to class 44H [15]. This result suggests that DifA and McpK interact with each other and signal to the Dif system forming a separate module.
Taken together, the phylogenetic and sequence analyses suggest the following associations: DifA and McpK linked to Dif; Mcp7, McpB and McpJ linked to Che7 and Che8; FrzCD, McpG, Mcp3a/Mcp3B linked to Frz and Che3; all remaining Mcps linked to Che4, Che5 and Che6.
Subcellular localization of M. xanthus MCPs
The R. sphaeroides chemosensory network is composed of two sensory modules each including multiple receptors [13], [31], [47], [48]. The two modules are physically separated in cells, as one constitutes a transmembrane polar cluster and the other one a cytoplasmic cluster [11], [46], [49]. We hypothesized that in M. xanthus, much like in R. sphaeroides, MCPs belonging to the same sensory module should have similar localization patterns [45], [46]. To test this hypothesis, we constructed strains that expressed the C terminus of each MCP fused to the green fluorescent protein (eGFP). Each gene fusion was placed at the respective endogenous locus and were shown not to interfere with cellular functions, with the exception of FrzCD-GFP and DifA-GFP which only partially complemented the motility defects observed in the respective deletion mutants (Figure S5) [50]. The strains were then examined in vivo by live-fluorescence microscopy. Ten of the 21 MCP-GFP fusions were highly expressed in cells, showing bright fluorescent foci and clear localization. Conversely, the remaining fusions showed only weak and diffused fluorescent signal in vegetative conditions (Figures 4A, S6 and S7). Mcp3B, McpE and McpG that we could not detect by fluorescence microscopy during vegetative growth, were instead expressed during development (Figure S7). MCPs that we could not detect in any condition, but that clearly play a role during development, were probably expressed at low levels, which is also the case with the very low-abundance receptors Trg and Tap of E. coli [51], [52].
Fig. 4. MCP-GFP fusions localize in multiple dynamic clusters in cells. 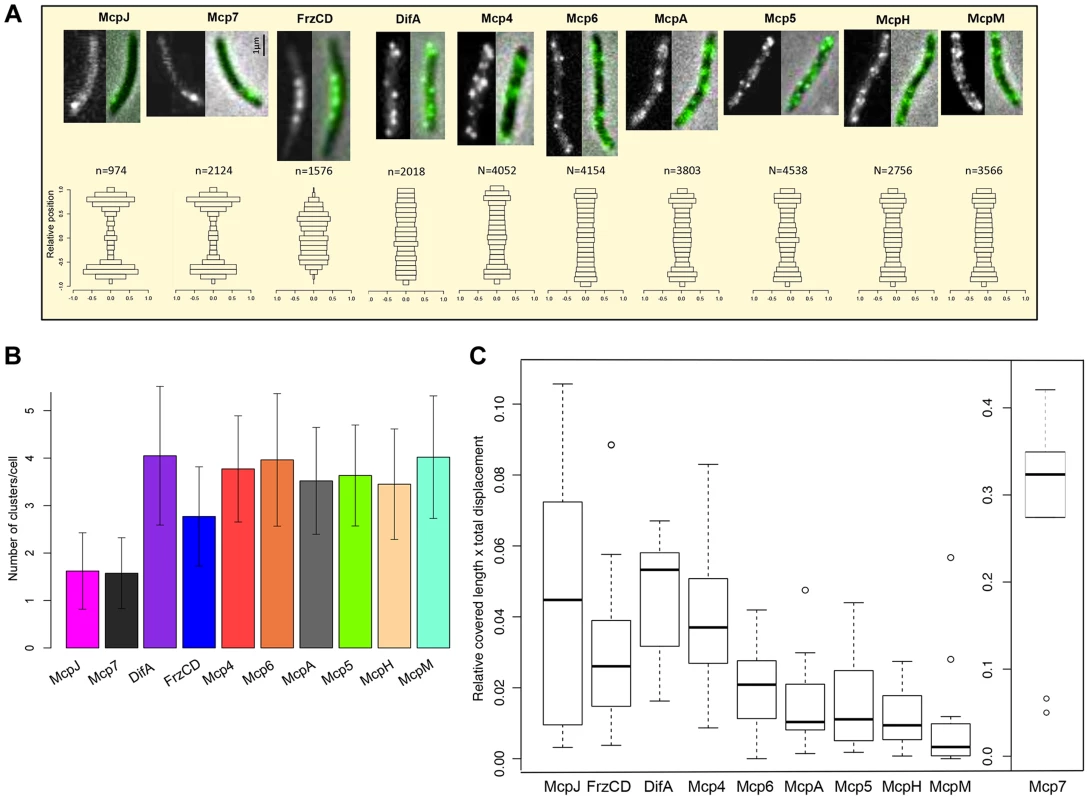
(A) In the first row, fluorescence (left) and overlay between fluorescence and phase contrast images (right) are shown for each MCP-GFP. In the bottom row, n clusters (numbers indicated above the histograms) were analyzed for each mcp-gfp strain and their relative position in cells in the y-axis is shown (0.0 indicate the center of the cell along the y-axis). Bars indicate the fraction of clusters localizing in the corresponding position in the y-axis. (B) Average number of clusters for each MCP-GFP. (C) Box plots indicate the medians of the product of the relative cell length and the total distance covered by the MCP-GFP clusters * = p<0.05; ** = p<0. 5E-04 (refer also to Methods, Table S2 and Figure S4). We proceeded with the analysis of the ten fusions that were localized in all conditions: DifA, FrzCD, Mcp7, McpJ, Mcp4, Mcp5, Mcp6, McpA, McpH and McpM. These MCP-GFP strains all showed multiple fluorescent clusters at the cell poles, the cell periphery or the cytosol (Figure 4A and B). To analyze these patterns we designed a procedure allowing large-scale automated image acquisition and analysis of the clusters formed by each MCP-GFP fusion (refer to Methods). With this approach, we obtained a localization map of each MCP by assigning the detected clusters to their relative cellular position and identified three main localization patterns. Mcp7 and McpJ formed only one or two clusters at the subpolar cell regions (Figure 4A and 4B). FrzCD showed a unique localization pattern with cytoplasmic foci excluded from the poles and occupying the central region of the cell body, as previously described [50], [53]. The remaining MCPs (DifA, Mcp4, Mcp5, Mcp6, McpA, McpH, McpM) formed foci distributed all along the periphery of cells, as predicted by the presence of transmembrane domains in their sequence (Table 1, Figure 4A and 4B). As all of the MCP foci appeared to be dynamic, we systematically analyzed the dynamics of these foci in single cells (Movie S1–S3, Figure S8). In order to exclude any interference from cellular movements, MCP foci were tracked in non-motile cells. Our analyses revealed that Mcp7 was significantly more mobile than all the other MCPs (p<0.005) (Figure 4C, Figure S8C and Table S2). Also, DifA and Mcp4 clusters were significantly more mobile than Mcp5, Mcp6, McpA and McpH fusions which were more static while McpM which showed little mobility if any (Figure 4C, S8B, S8C and Table S2). Interestingly, while the more static McpM carries the highest number of transmembrane domains, the faster Mcp7 is a cytoplasmic protein (Table 1). However, while FrzCD also lacks transmembrane domains, it shows slower movement rates compared to Mcp7. This might be explained by the anchoring of the FrzCD clusters to some intracellular structures [53], [54].
Based on localization and phylogeny, we can postulate that (i) McpJ is linked to Mcp7, (ii) FrzCD constitutes a sensory module by itself and (iii) MCPs of Group 3 are linked to the Che4, Che5 or Che6 pathways (Figures 3 and 4). Although the localization and dynamics of DifA suggest that it interacts with the receptors of Group 3, this appears unlikely from the divergence of their respective C-terminal domains based on phylogenetic and sequence analyses (see above) [12]. This cellular localization and dynamics of the chemoreceptors is largely consistent with the functional groups suggested by the phylogenomic analysis described above.
To verify that Mcp4, Mcp5, Mcp6, McpH, McpA and McpM, predicted to be associated in the same functional module, are colocalized in cells, we constructed M. xanthus strains expressing two fluorescently labeled MCPs, with either the GFP or the mCherry. Fluorescence micrographs of each strain were taken and colocalizations were quantified for 20 cells per double-labelled strain. Quantifications were determined by calculating the Pearson's coefficient that measures the degree of linear dependence between the localization of a red signal and the localization of a green signal in the same cell [55]. Our analyses showed that Mcp5-Mcp6, Mcp5-McpH, Mcp5-McpM, Mcp6-Mcp4 and Mcp6-McpA significantly colocalized in cells (Pearson's coefficient >0.7) (Figure 5). We used frzCD-gfp/aglZ-mCherry cells as negative control because FrzCD and AglZ have previously been shown to be exclusively localized in cells (Figure 5) [53].
Fig. 5. MCPs colocalization analysis. 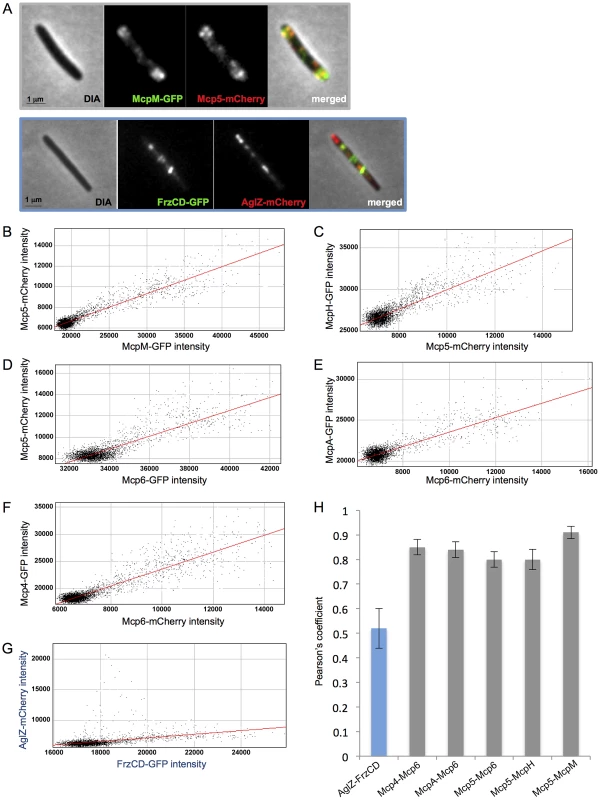
(A) Fluorescence micrographs of mcp5-mCherry mcpM-gfp and frzCD-gfp aglZ-mCherry cells are shown as examples. From (B) to (G) scatterplots of individual red and green pixel intensities of double-labeled cells are shown. (H) Average Pearson's correlation coefficients (PCCs) each calculated from ten scatterplots per strain. Che4, Che5, Che6 and multiple MCPs might constitute a large chemosensory module
The phylogenetic and localization studies suggest that a large number of MCPs are recruited by the Che4, Che5 and Che6 pathways. To directly assess this hypothesis, we tested the interactions between Mcp4, Mcp5, Mcp6, McpH, McpA and McpM with all CheW-like proteins from the Che4, Che5 and Che6 pathways in a bacterial two-hybrid assay. Since these chemoreceptors were not predicted to interact with the Che7 and Che8 pathways, we included CheW homologs from these pathways as specificity controls. The interaction between Mcp7 and CheW7 was also used as a positive control. Except for McpA for which no interaction was detected with any of the tested CheW homologs, all tested MCPs interacted with at least one CheW from Che4, Che5 or Che6 (Figure 6). Remarkably a high level of specificity was observed in some cases: for example, McpM only interacted with CheW5b and McpH only interacted with CheW4b. In other cases, one MCP could interact with several CheW proteins: specifically, Mcp4 interacted with all of the CheWs except for CheW4a and the negative controls; Mcp5 interacted with CheW4b and CheW5b; and Mcp6 interacted with CheW5b and CheW6a. As expected, none of these receptors interacted with CheW7, which specifically interacted with Mcp7, nor with CheW8a and CheW8b, which are phylogenetically distant (Figure 6). Together, these results raise the possibility that M. xanthus Che utilizes higher order chemosensory modules comprised by several MCPs and Che pathways. The two-hybrid analysis suggests that each CheW has binding specificities that can be used to recruit multiple specific MCPs to a given signaling complex.
Fig. 6. In vivo MCP-CheW interactions. 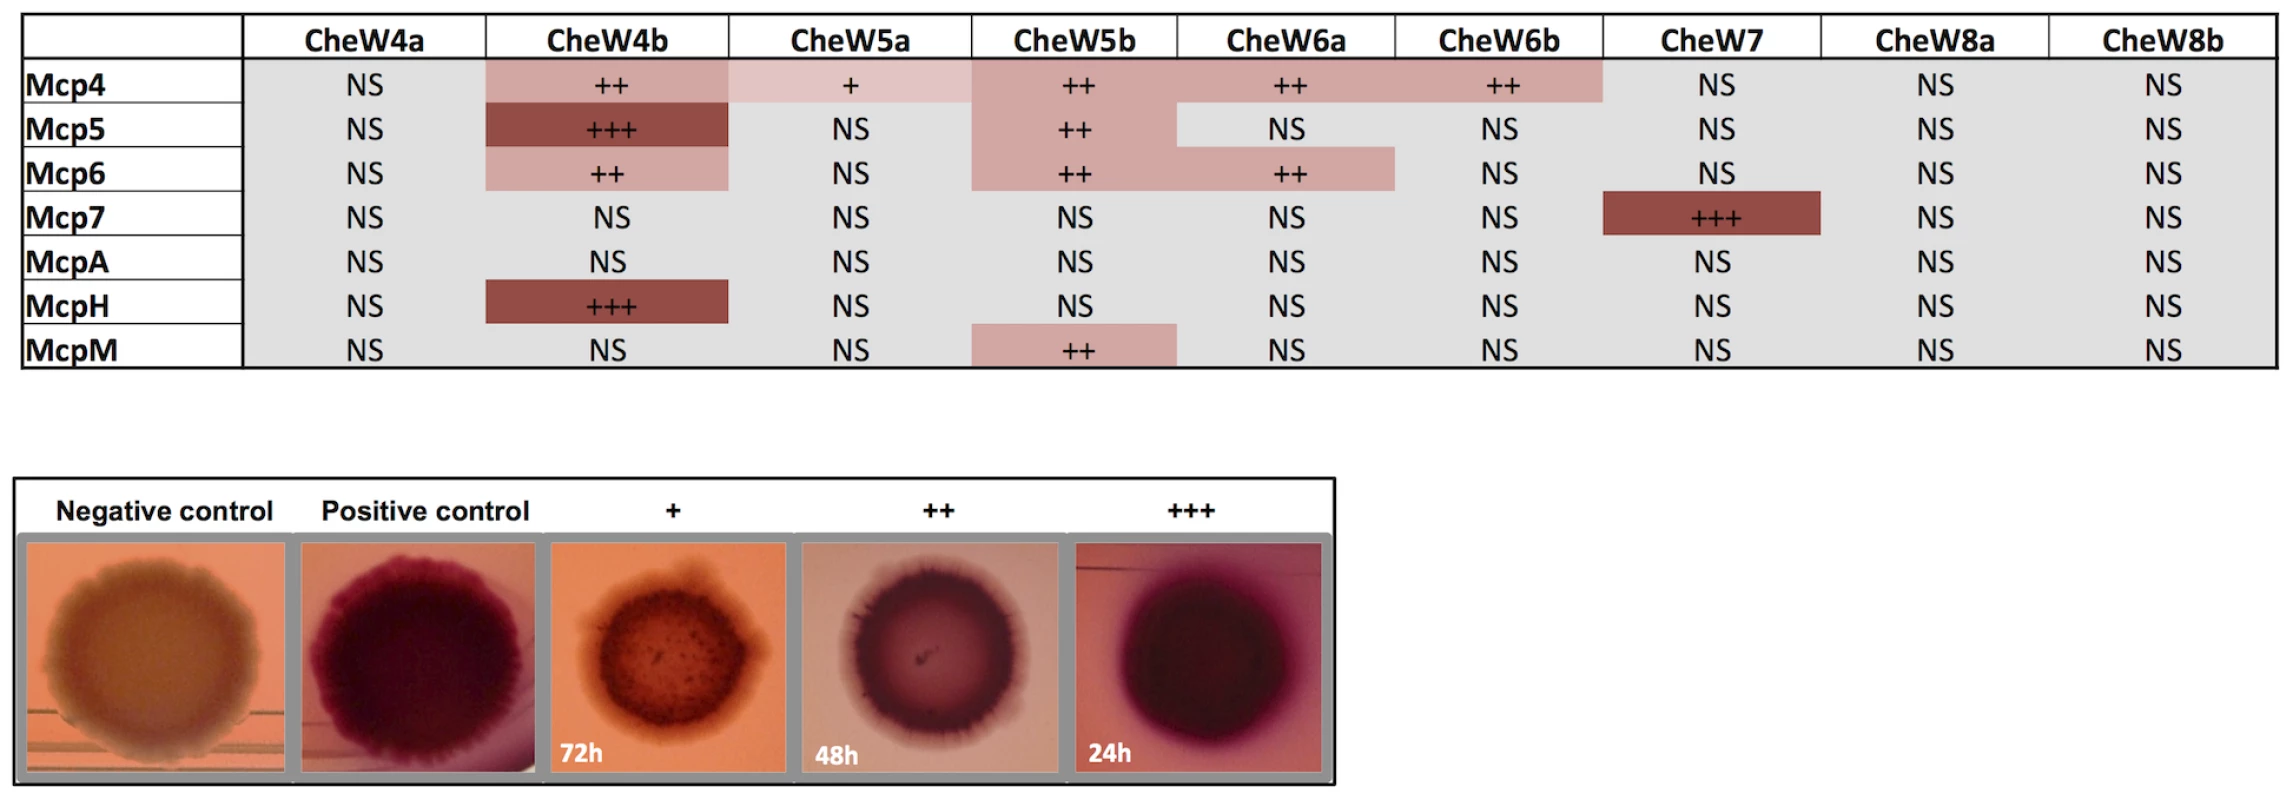
Bacterial two-hydrid assays on plates. Interactions between MCPs and CheWs are shown. +++, ++ and + indicate bacterial colonies turning red within 24 h, 48 h and 72 h respectively. “NS” (not significant) means that the colony color was as the negative control. We only show interactions resulting positive for both the pUT18Cmcp/pKT25cheW and pKT25mcp/pUT18CcheW combinations and reproducible in two experiments performed in triplicate. Examples of colonies from negative control (empty plasmids); positive control (pUT18Cmcp7/pKT25cheW7); + (pUT18CmcpM/pKT25cheW4b); ++ (pUT18Cmcp4/pKT25cheW4b); +++ (pKT25CmcpM/pUT18CcheW4b) are shown. To further test the existence of a module comprised by the Che4, Che5 and Che6 systems and receptors, we combined deletions of cheA4, cheA5 and cheA6 and analyzed motility and developmental phenotypes. Interestingly, ΔcheA4, ΔcheA5 and ΔcheA6 double mutants are significantly more affected in S motility and fruiting body formation than single mutants (Figure 7). However, these phenotypes are restored to wild type in a ΔcheA4ΔcheA5ΔcheA6 triple mutant. While this analysis does not reveal the precise biological function of the Che4, 5 and 6 pathways, it shows that the lack of two CheAs from this module deregulates the remaining CheA. This result strongly suggests that CheA4, CheA5 and CheA6 are part of the same regulatory module.
Fig. 7. ΔcheA triple mutants have restored phenotypes as compared to single and double mutants. 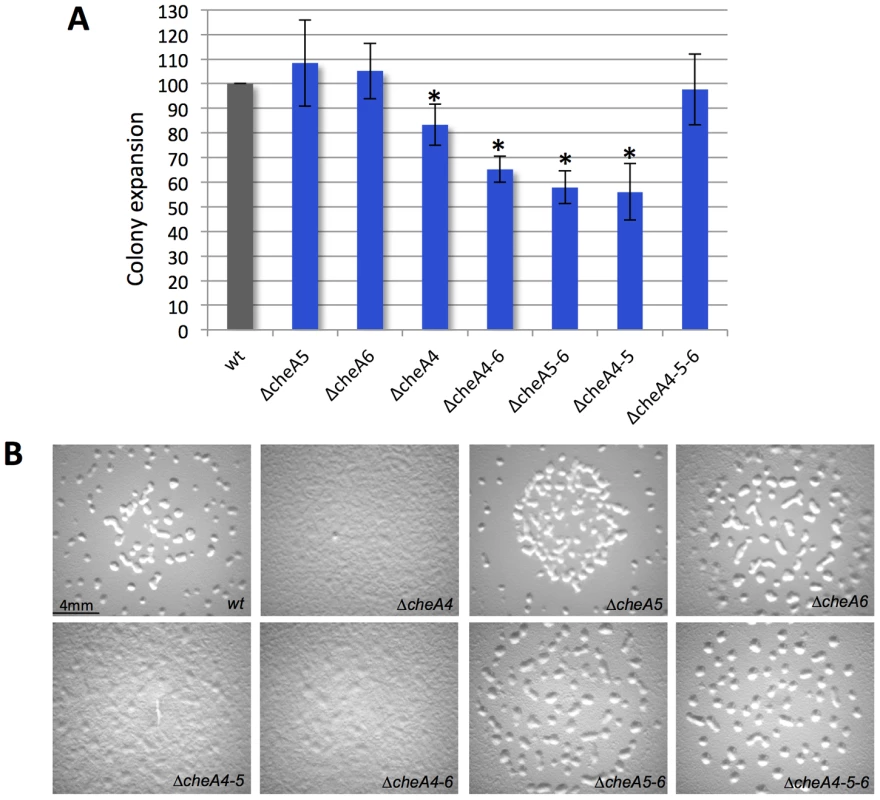
(A) Motility was measured after 48 h. The colony spreading of each mutant was normalized with the one of a ΔpilA strain [68] completely incapable of S motility, to exclude cell growth effects. Error bars indicate standard deviations. The star corresponds to p<0.005. (B) ΔcheA fruiting body formation images at 72 h are shown. Conclusions
In this study we sought to understand the partitioning of M. xanthus chemoreceptors among eight CSS to constitute sensory modules. We hypothesized that Che modules might attract multiple receptors and Che proteins as observed in other bacterial species and that the analysis of their cellular organization would help us to understand the role of these proteins in the M. xanthus life cycle. For this purpose, we first compiled a full list of the putative M. xanthus Che proteins and chemoreceptors. We were not surprised to find a total of 67 proteins as, in most cases, the number of one - and two-component systems present in a bacterial genome directly relates to the complexity of the life cycle [56]. The same might be true for CSS. Our systematic deletion of the 21 M. xanthus chemoreceptors and CheA encoding genes revealed that two thirds of them are involved in the temporal regulation of fruiting body formation, a multi-step differentiation process requiring the perception of numerous signals for the activation of key regulation check-points [20], [57].
Based on an integrated approach, we found that MCPs and CSS show comparable phylogenetic distributions in three main groups and that MCPs belonging to the same phylogenetic group colocalize. In particular, MCPs of Group 3 seemed to constitute a large chemosensory module together with three CSS, namely Che4, Che5 and Che6 (Figure 8). The presence of such a complex array of chemosensory proteins suggests that social behaviors such as cell group motility and biofilm formation might require interwoven regulatory systems composed by multiple Che-like systems and that the final cellular responses are generated following both the integration of signals transduced by different MCPs at the CheA level and the interaction among different Che systems. Also, cross-regulation between different Che systems can add an additional layer of complexity, as suggested by previous work showing inter-dependence between the Frz and the Dif pathway [58]. Once the composition of each module has been dissected, it will be possible to identify their signals and outputs to clarify their precise function in the M. xanthus life cycle.
Fig. 8. Schematic organization of M. xanthus Che modules as depicted from phylogenetic, cell biology and protein interaction analyses. 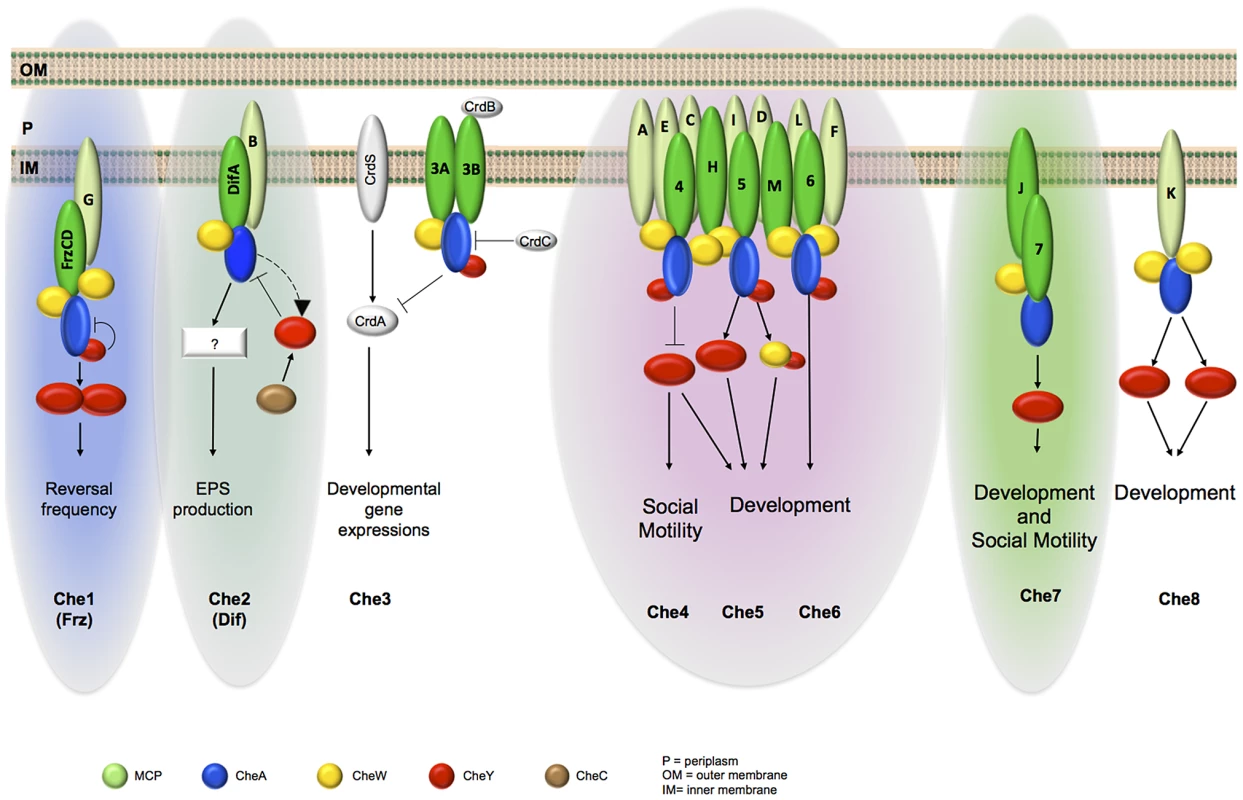
For clarity, we omitted CheR and CheB proteins and do not specify the MCP-CheW interactions. MCPs in light green are the ones for which interactions with a CSS have not been demonstrated. The different color backgrounds indicate taxonomic Group 1 (green), Group 2 (blue) and Group 3 (pink). Group 1 was further divided in two subgroups labelled with light and dark green, based on the localization analysis. It has recently been reported that multiple chemosensory systems occur as frequently as single ones, highlighting the importance of investigating model microbes that encode multiple chemosensory systems [1]. By providing a broad perspective on how a complex multicomponent chemosensory apparatus is arranged within cells, this work establishes a basis for a deeper analysis on how signals are perceived, integrated and translated in cell behaviors at the level of each chemosensory module. Analogous approaches could be applied to bacterial systems with similarly complex regulatory networks.
Materials and Methods
Bioinformatics analysis of che genes
Protein sequences were analyzed by Pfam (release 24.0) (see comment on Tables 1, 2 and 3) databases [59]. Signal peptides and transmembrane helices were predicted using the signalP 3.0 [60] and TMHMM v.2.0 [61] servers, respectively. Genomic regions were investigated using the complete genome sequence available on NCBI [15].
For the dataset construction and phylogenetic analyses, M. xanthus Che and MCP homologues were retrieved from the complete M. xanthus DK 1622 proteome available on NCBI (http://www.ncbi.nlm.nih.gov/genome/proteins/1120/?project_id=58003; [15] using Blastp with default parameters [62]. The distinction between homologous and non-homologous sequences was assessed by visual inspection of each Blastp outputs (no arbitrary cut-off on the E-value or score). To ensure the exhaustive sampling of homologues, iterative Blastp queries were performed using homologues of M. xanthus MCP identified at each step as new seeds.
The retrieved homologues were gathered in a dataset and the corresponding sequences were aligned using the ClustalW2 program (Default parameters, [63]. Each alignment was visually inspected and manually refined when necessary using the ED program from the MUST package [64]. Regions where the homology between amino acid positions was doubtful were manually removed using NET from the MUST package.
Both Maximum likelihood (ML) and Bayesian phylogenetic trees were computed for the MCPs. ML analyses were run using PhyML version 3.0 with the Le and Gascuel (LG) model (amino acid frequencies estimated from the dataset) and a gamma distribution (4 discrete categories of sites and an estimated alpha parameter) to take into account evolutionary rate variations across sites [65]. The robustness of each branch was estimated by the non-parametric bootstrap procedure implemented in PhyML (100 replicates of the original dataset with the same parameters). Bayesian analyses were performed using MrBayes [66] with a mixed model of amino acid substitution including a gamma distribution (4 discrete categories) and an estimated proportion of invariant sites. MrBayes was run with four chains for 1 million generations and trees were sampled every 100 generations. To construct the consensus tree, the first 1500 trees were discarded as “burnin”.
In order to obtain a high-resolution taxonomic distribution of the Che systems, we combined the CheR, CheB, CheA and MCP conserved sequences in a so-called supermatrix. When more than one homologue of these genes was present in a given genome, the genes were combined according to their physical linkage on the chromosome.
Bacterial strains, plasmids and growth
Strains and plasmids are listed in Table S1. M. xanthus strains were grown at 32°C in CYE rich media as previously described [37]. Plasmids were introduced into M. xanthus cells by electroporation. Deletion and MCP-GFP fusions were inserted in frame to avoid polar effects on the downstream gene expression. These strains were obtained by homologous recombination based on a previously reported method using the pBJ113 or pBJ114 vectors [37]. The codon regions that we deleted to obtain Δmcp and ΔcheA in frame deletion strains are specified in Table S1. To generate strains expressing MCP-GFP fusion proteins, we constructed DNA cassettes including the last approximately 800 bp of each mcp gene, with the exception of the stop codon; the gene encoding the egfp gene from the pEGFP-N1 plasmid (Invitrogen) excluding the start codon and including the stop codon; the intergenic region between the mcp gene of interest and its immediately downstream gene, if any; the first 800 bp of the mcp downstream gene. Between the mcp gene fragment and the egfp we inserted the following linker: CGG GAT CCA CCG GTC GCC ACC.
To obtain Δmcp/pilA::tet and ΔcheA/pilA::tet strain, we systematically electroporated Δmcp and ΔcheA cells, as previously described, with genomic DNA from strain DK10407 [37].
Escherichia coli cells were grown under standard laboratory conditions in Luria-Bertani broth supplemented with antibiotics, if necessary.
For phenotypic assays, cells (5 µl) at a concentration of 5×10⁹ cfu ml−1, were spotted on CF-agar plates or CYE plates containing an agar concentration of 0.5 or 1.5%, incubated at 32°C and photographed after 24 h, 48 h, 72 h and 5 days with an Olympus SZ61 binocular stereoscope. To measure the fluorescence intensity of MCP-GFP fusions during developmental conditions, cells were grown in submerged cultures in CF medium for 48 h as previously described [67].
Bacterial two-hybrid experiments
Bacterial two-hybrid experiments, plate were performed as previously described [68] and as recommended by the manufacturer instructions (Euromedex).
Fluorescence microscopy
For fluorescence microscopy analysis, 5 µl of cells from 4×10⁸ cfu ml−1 vegetative CYE or submerged CF cultures were spotted on a thin fresh TPM agar [69] pad atop a slide. A cover slip was added immediately on the top of the pad, and the obtained slide was analyzed by microscopy using a Nikon Eclipse TE2000 E PFS inverted epifluorescence microscope (100× oil objective NA 1.3 Phase Contrast) [70]. Typical time-lapse movies were shot for 20 min or 3 min with frames captured every 30 or 5 s, respectively. Movies were obtained by processing the series of images collected with Image J (Rasband, W.S., ImageJ, U. S. National Institutes of Health, Bethesda, Maryland, USA, http://imagej.nih.gov/ij/, 1997–2012.) and FIJI [71].
Alternatively, 1 µl of cells from 4×10⁹ cfu ml−1 vegetative CYE cultures were spotted on pretreated 96-well Angiogenesis glass microplate (IBiDi). 50 µl of 37 C, 2% Low melting agarose (Sigma) were immediately placed on the top of the cell drop and the glass slides were left 30 minutes at room temperature before being imaged. The microscope screening of a complete microplate was obtained with a fully automatized system. The microscope devices were optimized in order to minimize the mechanical moves and provide rapid autofocus capability (epi/diascopic diode lightening, piezo-electric stage). The microscope and devices were driven by a recently released Nikon-NIS software called “JOBS”.
Image analysis
Image analyses were performed with ImageJ or Fiji. Kimographs were obtained from 3 min time-lapse movies with frames captured every 5 s. From these movies, areas corresponding to selected non-moving cells were cropped. A line with the same thickness, length and curvature of a selected cell was manually drawn inside this cell. Cells were straightened with the function “reslice” to obtain the kymograph. From the kymographs, we measured the total distance (the total number of pixels covered horizontally) as well as the relative cell-body length covered by each cluster, regardless of the direction (red and blue, respectively, in Figure S8B). Then we considered the product between the total displacement and the relative covered length as a measurement of the degree of dynamism of each MCP.
The position of MCP-GFP clusters along the major axis of the cell was obtained with a workflow described in Figure S9 and automated with a Python script in FIJI. As the signal to noise ratio varied among different strains, it was necessary to adapt the analysis for each MCP-GFP in order to obtain a realistic distribution of clusters. The fluorescence intensity was calculated with FIJI by subtracting from the measured fluorescence intensity of each cell the background measured in the same frame. Colocalizations were calculated with the plugin JACoP from FIJI.
Statistical analysis
Relative net swarming in Figure 2 was calculated as the average ratio between the surfaces in pixels of the swarming mutant versus wild-type colonies (100%) after 48 h. Surfaces were normalized with the surface of a ΔpilA mutant (0%). The averages were obtained from at least three independent experiments performed in duplicates. Student's T-tests were used to determine the statistical significance. The relative cell length and the total distance covered by MCP were determined on 20 clusters by calculating, with the software R, data medians and Interquartile Ranges (IQRs: defined as the difference between the third and the first quartiles of the data) respectively. Statistical significance was calculated by using Wilcoxon tests.
Supporting Information
Zdroje
1. WuichetK, ZhulinIB (2010) Origins and diversification of a complex signal transduction system in prokaryotes. Sci Signal 3: ra50 doi:10.1126/scisignal.2000724
2. PorterSL, WadhamsGH, ArmitageJP (2011) Signal processing in complex chemotaxis pathways. Nat Rev Microbiol 9 : 153–165 doi:10.1038/nrmicro2505
3. RobertsMAJ, PapachristodoulouA, ArmitageJP (2010) Adaptation and control circuits in bacterial chemotaxis. Biochem Soc Trans 38 : 1265–1269 doi:10.1042/BST0381265
4. SourjikV, BergHC (2002) Binding of the Escherichia coli response regulator CheY to its target measured in vivo by fluorescence resonance energy transfer. Proc Natl Acad Sci USA 99 : 12669–12674 doi:10.1073/pnas.192463199
5. KirbyJR (2009) Chemotaxis-Like Regulatory Systems: Unique Roles in Diverse Bacteria. Annual Review of Microbiology 63 : 45–59 doi:10.1146/annurev.micro.091208.073221
6. KirbyJR, ZusmanDR (2003) Chemosensory regulation of developmental gene expression in Myxococcus xanthus. Proc Natl Acad Sci USA 100 : 2008–2013 doi:10.1073/pnas.0330944100
7. GüvenerZT, HarwoodCS (2007) Subcellular location characteristics of the Pseudomonas aeruginosa GGDEF protein, WspR, indicate that it produces cyclic-di-GMP in response to growth on surfaces. Mol Microbiol 66 : 1459–1473 doi:10.1111/j.1365-2958.2007.06008.x
8. AmesP, StuddertCA, ReiserRH, ParkinsonJS (2002) Collaborative signaling by mixed chemoreceptor teams in Escherichia coli. Proc Natl Acad Sci USA 99 : 7060–7065 doi:10.1073/pnas.092071899
9. SourjikV, BergHC (2004) Functional interactions between receptors in bacterial chemotaxis. Nature 428 : 437–441 doi:10.1038/nature02406
10. ScottKA, PorterSL, BaggEAL, HamerR, HillJL, et al. (2010) Specificity of localization and phosphotransfer in the CheA proteins of Rhodobacter sphaeroides. Mol Microbiol 76 : 318–330 doi:10.1111/j.1365-2958.2010.07095.x
11. WadhamsGH, WarrenAV, MartinAC, ArmitageJP (2003) Targeting of two signal transduction pathways to different regions of the bacterial cell. Mol Microbiol 50 : 763–770.
12. AlexanderRP, ZhulinIB (2007) Evolutionary genomics reveals conserved structural determinants of signaling and adaptation in microbial chemoreceptors. Proc Natl Acad Sci USA 104 : 2885–2890 doi:10.1073/pnas.0609359104
13. TranHT, KrushkalJ, AntommatteiFM, LovleyDR, WeisRM (2008) Comparative genomics of Geobacter chemotaxis genes reveals diverse signaling function. BMC Genomics 9 : 471 doi:10.1186/1471-2164-9-471
14. Tindall MJ, Porter SL, Maini PK, Armitage JP (2010) Modeling chemotaxis reveals the role of reversed phosphotransfer and a bi-functional kinase-phosphatase. PLoS Comput Biol 6. Available: http://www.ncbi.nlm.nih.gov/pubmed/20808885. Accessed 31 January 2012.
15. GoldmanBS, NiermanWC, KaiserD, SlaterSC, DurkinAS, et al. (2006) Evolution of sensory complexity recorded in a myxobacterial genome. Proc Natl Acad Sci USA 103 : 15200–15205 doi:10.1073/pnas.0607335103
16. ShiX, Wegener-FeldbrüggeS, HuntleyS, HamannN, HedderichR, et al. (2008) Bioinformatics and experimental analysis of proteins of two-component systems in Myxococcus xanthus. J Bacteriol 190 : 613–624 doi:10.1128/JB.01502-07
17. BerlemanJE, ScottJ, ChumleyT, KirbyJR (2008) Predataxis behavior in Myxococcus xanthus. Proc Natl Acad Sci USA 105 : 17127–17132 doi:10.1073/pnas.0804387105
18. KaiserD (2006) A microbial genetic journey. Annu Rev Microbiol 60 : 1–25 doi:10.1146/annurev.micro.60.080805.142209
19. KaiserD (2003) Coupling cell movement to multicellular development in myxobacteria. Nat Rev Microbiol 1 : 45–54 doi:10.1038/nrmicro733
20. ShimketsLJ (1990) Social and developmental biology of the myxobacteria. Microbiol Rev 54 : 473–501.
21. LiY, SunH, MaX, LuA, LuxR, et al. (2003) Extracellular polysaccharides mediate pilus retraction during social motility of Myxococcus xanthus. Proc Natl Acad Sci U S A 100 : 5443–5448.
22. WallD, KaiserD (1999) Type IV pili and cell motility. Mol Microbiol 32 : 1–10.
23. DucretA, ThéodolyO, MignotT (2013) Single cell microfluidic studies of bacterial motility. Methods Mol Biol 966 : 97–107 doi:_10.1007/978-1-62703-245-2_6
24. LucianoJ, AgrebiR, Le GallAV, WartelM, FiegnaF, et al. (2011) Emergence and modular evolution of a novel motility machinery in bacteria. PLoS Genet 7: e1002268 doi:10.1371/journal.pgen.1002268
25. NanB, ChenJ, NeuJC, BerryRM, OsterG, et al. (2011) Myxobacteria gliding motility requires cytoskeleton rotation powered by proton motive force. Proc Natl Acad Sci USA 108 : 2498–2503 doi:10.1073/pnas.1018556108
26. NanB, BandariaJN, MoghtaderiA, SunI-H, YildizA, et al. (2013) Flagella stator homologs function as motors for myxobacterial gliding motility by moving in helical trajectories. Proc Natl Acad Sci USA 110: E1508–E1513 doi:10.1073/pnas.1219982110
27. SunM, WartelM, CascalesE, ShaevitzJW, MignotT (2011) Motor-driven intracellular transport powers bacterial gliding motility. Proc Natl Acad Sci USA 108 : 7559–7564 doi:10.1073/pnas.1101101108
28. BlackWP, XuQ, YangZ (2006) Type IV pili function upstream of the Dif chemotaxis pathway in Myxococcus xanthus EPS regulation. Mol Microbiol 61 : 447–456 doi:10.1111/j.1365-2958.2006.05230.x
29. VlamakisHC, KirbyJR, ZusmanDR (2004) The Che4 pathway of Myxococcus xanthus regulates type IV pilus-mediated motility. Mol Microbiol 52 : 1799–1811 doi:10.1111/j.1365-2958.2004.04098.x
30. McBrideMJ, WeinbergRA, ZusmanDR (1989) “Frizzy” aggregation genes of the gliding bacterium Myxococcus xanthus show sequence similarities to the chemotaxis genes of enteric bacteria. Proc Natl Acad Sci USA 86 : 424–428.
31. ZusmanDR, ScottAE, YangZ, KirbyJR (2007) Chemosensory pathways, motility and development in Myxococcus xanthus. Nat Rev Microbiol 5 : 862–872 doi:10.1038/nrmicro1770
32. Willett JW, Kirby JR (2011) CrdS and CrdA comprise a two-component system that is cooperatively regulated by the Che3 chemosensory system in Myxococcus xanthus. MBio 2: e00110-11. Available: http://www.ncbi.nlm.nih.gov/pubmed/21810965. Accessed 30 January 2012.
33. YangZ, GengY, XuD, KaplanHB, ShiW (1998) A new set of chemotaxis homologues is essential for Myxococcus xanthus social motility. Mol Microbiol 30 : 1123–1130.
34. MuffTJ, FosterRM, LiuPJY, OrdalGW (2007) CheX in the three-phosphatase system of bacterial chemotaxis. J Bacteriol 189 : 7007–7013 doi:10.1128/JB.00896-07
35. BerlemanJE, BauerCE (2005) Involvement of a Che-like signal transduction cascade in regulating cyst cell development in Rhodospirillum centenum. Mol Microbiol 56 : 1457–1466 doi:10.1111/j.1365-2958.2005.04646.x
36. WhitchurchCB, LeechAJ, YoungMD, KennedyD, SargentJL, et al. (2004) Characterization of a complex chemosensory signal transduction system which controls twitching motility in Pseudomonas aeruginosa. Mol Microbiol 52 : 873–893 doi:10.1111/j.1365-2958.2004.04026.x
37. BustamanteVH, Martinez-FloresI, VlamakisHC, ZusmanDR (2004) Analysis of the Frz signal transduction system of Myxococcus xanthus shows the importance of the conserved C-terminal region of the cytoplasmic chemoreceptor FrzCD in sensing signals. Mol Microbiol 53 : 1501–1513.
38. YangZ, MaX, TongL, KaplanHB, ShimketsLJ, et al. (2000) Myxococcus xanthus dif genes are required for biogenesis of cell surface fibrils essential for social gliding motility. J Bacteriol 182 : 5793–5798.
39. Del CampoAM, BalladoT, de la MoraJ, PoggioS, CamarenaL, et al. (2007) Chemotactic control of the two flagellar systems of Rhodobacter sphaeroides is mediated by different sets of CheY and FliM proteins. J Bacteriol 189 : 8397–8401 doi:10.1128/JB.00730-07
40. YangY, SourjikV (2012) Opposite responses by different chemoreceptors set a tunable preference point in Escherichia coli pH taxis. Mol Microbiol 86 : 1482–9 doi:10.1111/mmi.12070
41. VuA, WangX, ZhouH, DahlquistFW (2012) The receptor-CheW binding interface in bacterial chemotaxis. J Mol Biol 415 : 759–767 doi:10.1016/j.jmb.2011.11.043
42. WangX, VuA, LeeK, DahlquistFW (2012) CheA-receptor interaction sites in bacterial chemotaxis. J Mol Biol 422 : 282–290 doi:10.1016/j.jmb.2012.05.023
43. GüvenerZT, TifreaDF, HarwoodCS (2006) Two different Pseudomonas aeruginosa chemosensory signal transduction complexes localize to cell poles and form and remould in stationary phase. Mol Microbiol 61 : 106–118 doi:10.1111/j.1365-2958.2006.05218.x
44. O'ConnorJR, KuwadaNJ, HuangyutithamV, WigginsPA, HarwoodCS (2012) Surface sensing and lateral subcellular localization of WspA, the receptor in a chemosensory-like system leading to c-di-GMP production. Mol Microbiol 86 : 720–729 doi:10.1111/mmi.12013
45. MartinAC, WadhamsGH, ArmitageJP (2001) The roles of the multiple CheW and CheA homologues in chemotaxis and in chemoreceptor localization in Rhodobacter sphaeroides. Mol Microbiol 40 : 1261–1272.
46. WadhamsGH, MartinAC, PorterSL, MaddockJR, MantottaJC, et al. (2002) TlpC, a novel chemotaxis protein in Rhodobacter sphaeroides, localizes to a discrete region in the cytoplasm. Mol Microbiol 46 : 1211–1221.
47. HamblinPA, MaguireBA, GrishaninRN, ArmitageJP (1997) Evidence for two chemosensory pathways in Rhodobacter sphaeroides. Mol Microbiol 26 : 1083–1096.
48. PorterSL, WarrenAV, MartinAC, ArmitageJP (2002) The third chemotaxis locus of Rhodobacter sphaeroides is essential for chemotaxis. Mol Microbiol 46 : 1081–1094.
49. WadhamsGH, MartinAC, ArmitageJP (2000) Identification and localization of a methyl-accepting chemotaxis protein in Rhodobacter sphaeroides. Mol Microbiol 36 : 1222–1233.
50. MaurielloEMF, AstlingDP, SliusarenkoO, ZusmanDR (2009) Localization of a bacterial cytoplasmic receptor is dynamic and changes with cell-cell contacts. Proc Natl Acad Sci USA 106 : 4852–4857 doi:10.1073/pnas.0810583106
51. HazelbauerGL, EngströmP (1981) Multiple forms of methyl-accepting chemotaxis proteins distinguished by a factor in addition to multiple methylation. J Bacteriol 145 : 35–42.
52. WangEA, MowryKL, CleggDO, KoshlandDEJr (1982) Tandem duplication and multiple functions of a receptor gene in bacterial chemotaxis. J Biol Chem 257 : 4673–4676.
53. MaurielloEMF, NanB, ZusmanDR (2009) AglZ regulates adventurous (A-) motility in Myxococcus xanthus through its interaction with the cytoplasmic receptor, FrzCD. Mol Microbiol 72 : 964–977 doi:10.1111/j.1365-2958.2009.06697.x
54. ThiemS, KentnerD, SourjikV (2007) Positioning of chemosensory clusters in E. coli and its relation to cell division. EMBO J 26 : 1615–1623 doi:10.1038/sj.emboj.7601610
55. AdlerJ, ParmrydI (2010) Quantifying colocalization by correlation: The Pearson correlation coefficient is superior to the Mander's overlap coefficient. Cytometry Part A 77A: 733–742 doi:10.1002/cyto.a.20896
56. GalperinMY, HigdonR, KolkerE (2010) Interplay of heritage and habitat in the distribution of bacterial signal transduction systems. Mol Biosyst 6 : 721–728 doi:10.1039/b908047c
57. ShimketsLJ (1999) Intercellular signaling during fruiting-body development of Myxococcus xanthus. Annu Rev Microbiol 53 : 525–549.
58. XuQ, BlackWP, CadieuxCL, YangZ (2008) Independence and interdependence of Dif and Frz chemosensory pathways in Myxococcus xanthus chemotaxis. Mol Microbiol 69 : 714–723 doi:10.1111/j.1365-2958.2008.06322.x
59. PuntaM, CoggillPC, EberhardtRY, MistryJ, TateJ, et al. (2012) The Pfam protein families database. Nucleic Acids Res 40: D290–301 doi:10.1093/nar/gkr1065
60. BendtsenJD, NielsenH, von HeijneG, BrunakS (2004) Improved prediction of signal peptides: SignalP 3.0. J Mol Biol 340 : 783–795 doi:10.1016/j.jmb.2004.05.028
61. KroghA, LarssonB, von HeijneG, SonnhammerEL (2001) Predicting transmembrane protein topology with a hidden Markov model: application to complete genomes. J Mol Biol 305 : 567–580 doi:10.1006/jmbi.2000.4315
62. AltschulSF, MaddenTL, SchäfferAA, ZhangJ, ZhangZ, et al. (1997) Gapped BLAST and PSI-BLAST: a new generation of protein database search programs. Nucleic Acids Res 25 : 3389–3402.
63. LarkinMA, BlackshieldsG, BrownNP, ChennaR, McGettiganPA, et al. (2007) Clustal W and Clustal X version 2.0. Bioinformatics 23 : 2947–2948 doi:10.1093/bioinformatics/btm404
64. PhilippeH (1993) MUST, a computer package of Management Utilities for Sequences and Trees. Nucleic Acids Res 21 : 5264–5272.
65. GuindonS, GascuelO (2003) A simple, fast, and accurate algorithm to estimate large phylogenies by maximum likelihood. Syst Biol 52 : 696–704.
66. HuelsenbeckJP, RonquistF (2001) MRBAYES: Bayesian inference of phylogenetic trees. Bioinformatics 17 : 754–755.
67. KunerJM, KaiserD (1982) Fruiting body morphogenesis in submerged cultures of Myxococcus xanthus. J Bacteriol 151 : 458–461.
68. BattestiA, BouveretE (2012) The bacterial two-hybrid system based on adenylate cyclase reconstitution in Escherichia coli. Methods 58 : 325–334 doi:10.1016/j.ymeth.2012.07.018
69. MignotT, MerlieJP, ZusmanDR (2005) Regulated pole-to-pole oscillations of a bacterial gliding motility protein. Science 310 : 855–857.
70. DucretA, MaisonneuveE, NotareschiP, GrossiA, MignotT, et al. (2009) A microscope automated fluidic system to study bacterial processes in real time. PLoS ONE 4: e7282 doi:10.1371/journal.pone.0007282
71. SchindelinJ, Arganda-CarrerasI, FriseE, KaynigV, LongairM, et al. (2012) Fiji: an open-source platform for biological-image analysis. Nat Methods 9 : 676–682 doi:10.1038/nmeth.2019
72. LiY, LuxR, PellingAE, GimzewskiJK, ShiW (2005) Analysis of type IV pilus and its associated motility in Myxococcus xanthus using an antibody reactive with native pilin and pili. Microbiology 151 : 353–360.
Štítky
Genetika Reprodukční medicína
Článek Sex Chromosome Turnover Contributes to Genomic Divergence between Incipient Stickleback SpeciesČlánek Final Pre-40S Maturation Depends on the Functional Integrity of the 60S Subunit Ribosomal Protein L3
Článek vyšel v časopisePLOS Genetics
Nejčtenější tento týden
2014 Číslo 3
-
Všechny články tohoto čísla
- , a Gene That Influences the Anterior Chamber Depth, Is Associated with Primary Angle Closure Glaucoma
- Genomic View of Bipolar Disorder Revealed by Whole Genome Sequencing in a Genetic Isolate
- The Rate of Nonallelic Homologous Recombination in Males Is Highly Variable, Correlated between Monozygotic Twins and Independent of Age
- Genetic Determinants Influencing Human Serum Metabolome among African Americans
- Heterozygous and Inherited Mutations in the Smooth Muscle Actin () Gene Underlie Megacystis-Microcolon-Intestinal Hypoperistalsis Syndrome
- Genome-Wide Meta-Analysis of Homocysteine and Methionine Metabolism Identifies Five One Carbon Metabolism Loci and a Novel Association of with Ischemic Stroke
- Cancer Evolution Is Associated with Pervasive Positive Selection on Globally Expressed Genes
- Genetic Diversity in the Interference Selection Limit
- Integrating Multiple Genomic Data to Predict Disease-Causing Nonsynonymous Single Nucleotide Variants in Exome Sequencing Studies
- An Evolutionary Analysis of Antigen Processing and Presentation across Different Timescales Reveals Pervasive Selection
- Cleavage Factor I Links Transcription Termination to DNA Damage Response and Genome Integrity Maintenance in
- DNA Dynamics during Early Double-Strand Break Processing Revealed by Non-Intrusive Imaging of Living Cells
- Genetic Basis of Metabolome Variation in Yeast
- Modeling 3D Facial Shape from DNA
- Dysregulated Estrogen Receptor Signaling in the Hypothalamic-Pituitary-Ovarian Axis Leads to Ovarian Epithelial Tumorigenesis in Mice
- Photoactivated UVR8-COP1 Module Determines Photomorphogenic UV-B Signaling Output in
- Local Evolution of Seed Flotation in Arabidopsis
- Chromatin Targeting Signals, Nucleosome Positioning Mechanism and Non-Coding RNA-Mediated Regulation of the Chromatin Remodeling Complex NoRC
- Nucleosome Acidic Patch Promotes RNF168- and RING1B/BMI1-Dependent H2AX and H2A Ubiquitination and DNA Damage Signaling
- The -Induced Arabidopsis Transcription Factor Attenuates ABA Signaling and Renders Seedlings Sugar Insensitive when Present in the Nucleus
- Changes in Colorectal Carcinoma Genomes under Anti-EGFR Therapy Identified by Whole-Genome Plasma DNA Sequencing
- Selection of Orphan Rhs Toxin Expression in Evolved Serovar Typhimurium
- FAK Acts as a Suppressor of RTK-MAP Kinase Signalling in Epithelia and Human Cancer Cells
- Asymmetry in Family History Implicates Nonstandard Genetic Mechanisms: Application to the Genetics of Breast Cancer
- Co-translational Localization of an LTR-Retrotransposon RNA to the Endoplasmic Reticulum Nucleates Virus-Like Particle Assembly Sites
- Sex Chromosome Turnover Contributes to Genomic Divergence between Incipient Stickleback Species
- DWARF TILLER1, a WUSCHEL-Related Homeobox Transcription Factor, Is Required for Tiller Growth in Rice
- Functional Organization of a Multimodular Bacterial Chemosensory Apparatus
- Genome-Wide Analysis of SREBP1 Activity around the Clock Reveals Its Combined Dependency on Nutrient and Circadian Signals
- The Yeast Sks1p Kinase Signaling Network Regulates Pseudohyphal Growth and Glucose Response
- An Interspecific Fungal Hybrid Reveals Cross-Kingdom Rules for Allopolyploid Gene Expression Patterns
- Temperate Phages Acquire DNA from Defective Prophages by Relaxed Homologous Recombination: The Role of Rad52-Like Recombinases
- Dying Cells Protect Survivors from Radiation-Induced Cell Death in
- Determinants beyond Both Complementarity and Cleavage Govern MicroR159 Efficacy in
- The bHLH Factors Extramacrochaetae and Daughterless Control Cell Cycle in Imaginal Discs through the Transcriptional Regulation of the Phosphatase
- The First Steps of Adaptation of to the Gut Are Dominated by Soft Sweeps
- Bacterial Regulon Evolution: Distinct Responses and Roles for the Identical OmpR Proteins of Typhimurium and in the Acid Stress Response
- Final Pre-40S Maturation Depends on the Functional Integrity of the 60S Subunit Ribosomal Protein L3
- Mitogen-Activated Protein Kinase (MAPK) Pathway Regulates Branching by Remodeling Epithelial Cell Adhesion
- CDP-Diacylglycerol Synthetase Coordinates Cell Growth and Fat Storage through Phosphatidylinositol Metabolism and the Insulin Pathway
- Coronary Heart Disease-Associated Variation in Disrupts a miR-224 Binding Site and miRNA-Mediated Regulation
- TBX3 Regulates Splicing : A Novel Molecular Mechanism for Ulnar-Mammary Syndrome
- Identification of Interphase Functions for the NIMA Kinase Involving Microtubules and the ESCRT Pathway
- Is a Cancer-Specific Fusion Gene Recurrent in High-Grade Serous Ovarian Carcinoma
- LILRB2 Interaction with HLA Class I Correlates with Control of HIV-1 Infection
- Worldwide Patterns of Ancestry, Divergence, and Admixture in Domesticated Cattle
- Parent-of-Origin Effects Implicate Epigenetic Regulation of Experimental Autoimmune Encephalomyelitis and Identify Imprinted as a Novel Risk Gene
- The Phospholipid Flippase dATP8B Is Required for Odorant Receptor Function
- Noise Genetics: Inferring Protein Function by Correlating Phenotype with Protein Levels and Localization in Individual Human Cells
- DUF1220 Dosage Is Linearly Associated with Increasing Severity of the Three Primary Symptoms of Autism
- Sugar and Chromosome Stability: Clastogenic Effects of Sugars in Vitamin B6-Deficient Cells
- Pheromone-Sensing Neurons Expressing the Ion Channel Subunit Stimulate Male Courtship and Female Receptivity
- Gene-Based Sequencing Identifies Lipid-Influencing Variants with Ethnicity-Specific Effects in African Americans
- Telomere Shortening Unrelated to Smoking, Body Weight, Physical Activity, and Alcohol Intake: 4,576 General Population Individuals with Repeat Measurements 10 Years Apart
- A Combination of Activation and Repression by a Colinear Hox Code Controls Forelimb-Restricted Expression of and Reveals Hox Protein Specificity
- An ER Complex of ODR-4 and ODR-8/Ufm1 Specific Protease 2 Promotes GPCR Maturation by a Ufm1-Independent Mechanism
- Epigenetic Control of Effector Gene Expression in the Plant Pathogenic Fungus
- Genetic Dissection of Photoreceptor Subtype Specification by the Zinc Finger Proteins Elbow and No ocelli
- Validation and Genotyping of Multiple Human Polymorphic Inversions Mediated by Inverted Repeats Reveals a High Degree of Recurrence
- CYP6 P450 Enzymes and Duplication Produce Extreme and Multiple Insecticide Resistance in the Malaria Mosquito
- GC-Rich DNA Elements Enable Replication Origin Activity in the Methylotrophic Yeast
- An Epigenetic Signature in Peripheral Blood Associated with the Haplotype on 17q21.31, a Risk Factor for Neurodegenerative Tauopathy
- Lsd1 Restricts the Number of Germline Stem Cells by Regulating Multiple Targets in Escort Cells
- RBPJ, the Major Transcriptional Effector of Notch Signaling, Remains Associated with Chromatin throughout Mitosis, Suggesting a Role in Mitotic Bookmarking
- The Membrane-Associated Transcription Factor NAC089 Controls ER-Stress-Induced Programmed Cell Death in Plants
- The Functional Consequences of Variation in Transcription Factor Binding
- Comparative Genomic Analysis of N-Fixing and Non-N-Fixing spp.: Organization, Evolution and Expression of the Nitrogen Fixation Genes
- An Insulin-to-Insulin Regulatory Network Orchestrates Phenotypic Specificity in Development and Physiology
- Suicidal Autointegration of and Transposons in Eukaryotic Cells
- A Multi-Trait, Meta-analysis for Detecting Pleiotropic Polymorphisms for Stature, Fatness and Reproduction in Beef Cattle
- Genome-Wide DNA Methylation Analysis Predicts an Epigenetic Switch for GATA Factor Expression in Endometriosis
- Genome-Wide DNA Methylation Analysis of Human Pancreatic Islets from Type 2 Diabetic and Non-Diabetic Donors Identifies Candidate Genes That Influence Insulin Secretion
- The and Hybrid Incompatibility Genes Suppress a Broad Range of Heterochromatic Repeats
- The Kil Peptide of Bacteriophage λ Blocks Cytokinesis via ZipA-Dependent Inhibition of FtsZ Assembly
- PLOS Genetics
- Archiv čísel
- Aktuální číslo
- Informace o časopisu
Nejčtenější v tomto čísle- Worldwide Patterns of Ancestry, Divergence, and Admixture in Domesticated Cattle
- Genome-Wide DNA Methylation Analysis of Human Pancreatic Islets from Type 2 Diabetic and Non-Diabetic Donors Identifies Candidate Genes That Influence Insulin Secretion
- Genetic Dissection of Photoreceptor Subtype Specification by the Zinc Finger Proteins Elbow and No ocelli
- GC-Rich DNA Elements Enable Replication Origin Activity in the Methylotrophic Yeast
Kurzy
Zvyšte si kvalifikaci online z pohodlí domova
Současné možnosti léčby obezity
nový kurzAutoři: MUDr. Martin Hrubý
Všechny kurzyPřihlášení#ADS_BOTTOM_SCRIPTS#Zapomenuté hesloZadejte e-mailovou adresu, se kterou jste vytvářel(a) účet, budou Vám na ni zaslány informace k nastavení nového hesla.
- Vzdělávání


