-
Články
Top novinky
Reklama- Vzdělávání
- Časopisy
Top články
Nové číslo
- Témata
Top novinky
Reklama- Videa
- Podcasty
Nové podcasty
Reklama- Kariéra
Doporučené pozice
Reklama- Praxe
Top novinky
ReklamaIdentification of New Genetic Risk Variants for Type 2 Diabetes
Although more than 20 genetic susceptibility loci have been reported for type 2 diabetes (T2D), most reported variants have small to moderate effects and account for only a small proportion of the heritability of T2D, suggesting that the majority of inter-person genetic variation in this disease remains to be determined. We conducted a multistage, genome-wide association study (GWAS) within the Asian Consortium of Diabetes to search for T2D susceptibility markers. From 590,887 SNPs genotyped in 1,019 T2D cases and 1,710 controls selected from Chinese women in Shanghai, we selected the top 2,100 SNPs that were not in linkage disequilibrium (r2<0.2) with known T2D loci for in silico replication in three T2D GWAS conducted among European Americans, Koreans, and Singapore Chinese. The 5 most promising SNPs were genotyped in an independent set of 1,645 cases and 1,649 controls from Shanghai, and 4 of them were further genotyped in 1,487 cases and 3,316 controls from 2 additional Chinese studies. Consistent associations across all studies were found for rs1359790 (13q31.1), rs10906115 (10p13), and rs1436955 (15q22.2) with P-values (per allele OR, 95%CI) of 6.49×10⁻⁹ (1.15, 1.10–1.20), 1.45×10⁻⁸ (1.13, 1.08–1.18), and 7.14×10⁻⁷ (1.13, 1.08–1.19), respectively, in combined analyses of 9,794 cases and 14,615 controls. Our study provides strong evidence for a novel T2D susceptibility locus at 13q31.1 and the presence of new independent risk variants near regions (10p13 and 15q22.2) reported by previous GWAS.
Published in the journal: . PLoS Genet 6(9): e32767. doi:10.1371/journal.pgen.1001127
Category: Research Article
doi: https://doi.org/10.1371/journal.pgen.1001127Summary
Although more than 20 genetic susceptibility loci have been reported for type 2 diabetes (T2D), most reported variants have small to moderate effects and account for only a small proportion of the heritability of T2D, suggesting that the majority of inter-person genetic variation in this disease remains to be determined. We conducted a multistage, genome-wide association study (GWAS) within the Asian Consortium of Diabetes to search for T2D susceptibility markers. From 590,887 SNPs genotyped in 1,019 T2D cases and 1,710 controls selected from Chinese women in Shanghai, we selected the top 2,100 SNPs that were not in linkage disequilibrium (r2<0.2) with known T2D loci for in silico replication in three T2D GWAS conducted among European Americans, Koreans, and Singapore Chinese. The 5 most promising SNPs were genotyped in an independent set of 1,645 cases and 1,649 controls from Shanghai, and 4 of them were further genotyped in 1,487 cases and 3,316 controls from 2 additional Chinese studies. Consistent associations across all studies were found for rs1359790 (13q31.1), rs10906115 (10p13), and rs1436955 (15q22.2) with P-values (per allele OR, 95%CI) of 6.49×10⁻⁹ (1.15, 1.10–1.20), 1.45×10⁻⁸ (1.13, 1.08–1.18), and 7.14×10⁻⁷ (1.13, 1.08–1.19), respectively, in combined analyses of 9,794 cases and 14,615 controls. Our study provides strong evidence for a novel T2D susceptibility locus at 13q31.1 and the presence of new independent risk variants near regions (10p13 and 15q22.2) reported by previous GWAS.
Introduction
Type 2 diabetes (T2D) is a common complex disease that affects over a billion people worldwide [1]. Through genome-wide association studies (GWAS), at least 24 genetic susceptibility loci have been reported for T2D [1]–[9], including a SNP, rs7593730, at 2q24 near the RBMS1 and ITGB6 genes that was associated with diabetes risk in a recent report from the Nurses' Health Study/Health Professionals Follow-up Study (NHS/HPFS) [2]. However, most of the reported genetic variants have small to moderate effects and account for only a small proportion of the heritability of T2D, suggesting that the majority of inter-person genetic variation in this disease remains to be determined. Over the last two decades, China, like many other Asian countries, has experienced a dramatic increase in T2D incidence. Cumulative evidence suggests that Asians may be more susceptible to insulin resistance compared with populations of European ancestry [10]. However, among the previously reported T2D genetic markers, only three SNPs – including two reported very recently – have been identified in populations of Asian ancestry [8], [9]. SNP rs2283228 in the KCNQ1 gene was identified in a 3-stage study that included 194 diabetes patients and 1,558 controls and 268,068 SNPs in the first (discovery) stage [8]. A study conducted among Han Chinese in Taiwan recently identified two additional novel loci in the protein tyrosine phosphatase receptor type D (PTPRD; P = 8.54×10⁻¹⁰) and serine racemase (SRR; P = 3.06×10⁻⁹) genes [9].
Large genetic studies conducted in Asian populations will facilitate the identification of additional genetic markers for T2D, particularly for markers with a higher frequency in Asians than in other populations. We recently completed a GWAS of T2D in Shanghai. We report here our first effort, using a fast-track, multiple-stage study approach, to identify novel genetic markers for diabetes.
Methods
Ethics statement
The study protocol was approved by the institutional review boards at Vanderbilt University Medical Center and at each of the collaborating institutes. Informed consent was obtained from all participants.
Study design and population
This study consisted of a discovery stage and two validation stages, i.e. an in silico and a de novo validation study. The overall study design is presented in Figure S1.
The discovery stage included 1,019 T2D cases, 886 incident T2D cases from the Shanghai Women's Health Study (SWHS), an ongoing, population-based, prospective cohort study of women living in Shanghai, and 133 prevalent T2D cases identified among controls of the Shanghai Breast Cancer Study (SBCS), who were recruited in Shanghai during approximately the same period as the SWHS [11]. Controls for the discovery phase were 1,710 non-diabetic female controls from the SBCS (for further details, see Text S1, online). The biologic samples used for genotyping in this study were collected by the SWHS and SBCS.
Genotyping and quality control procedures
DNA samples were genotyped using the Affymetrix Genome-Wide Human SNP Array 6.0. Extensive quality control (QC) procedures were implemented in the study. In the SWHS/SBCS GWAS scan, three positive QC samples purchased from Coriell Cell Repositories and a negative QC sample were included in each of the 96-well plates of the Affymetrix SNP Array 6.0. SNP data obtained from positive quality control samples showed a very high concordance rate of called genotypes based on 79,764,872 comparisons (mean, 99.87%; median, 100%). Samples with genotyping call rates less than 95% were excluded. The sex of all study samples was confirmed to be female. The identity-by-descent analysis based on identity by state was performed to detect first-degree cryptic relationships using PLINK version 1.06 [12]. We excluded from the study 21 samples that had: 1) call rate <95% (n = 5); 2) samples that were contaminated or had mixed-up labels or that had been duplicated (n = 12); 3) first-degree relatives, such as parent-offspring or full siblings (n = 4).
We also excluded from the analysis SNPs that met any of following criteria: 1) MAF <0.05; 2) call rate <95%; 3) P for Hardy-Weinburg equilibrium HWE <0.00001 in either the case or control groups or in the combined data set; 4) concordance rate <95% among the duplicated QC samples; 5) significant difference in allele frequency distribution (P<0.00001) between the 886 T2D cases from the SWHS and the 133 T2D cases from the SBCS; 6) significant difference in missing rates between cases and controls (P<0.00001). After applying the QC filter, 590,887 SNPs remained for the analyses.
Because of financial constraints, we conducted a fast-track validation study using an approach that combined in silico and de novo replication. We selected a total of 2,100 SNPs from the discovery phase that had P-values of 1.3×10⁻⁹ to 5.0×10⁻³ derived from the additive model and that were not in linkage disequilibrium (LD; r2<0.2 based on the HapMap CHB dataset) with any previously reported T2D GWAS SNPs for an in silico replication using the GWAS scan data from the NHS/HPFS [2]. We used the NHS/HPFS T2D GWAS scans for our first step of validation, because the Shanghai T2D GWAS was conducted concurrently and used the same genotyping platform as the NHS/HPFS T2D GWAS and a priori arrangement was made for the two studies to exchange the top 2,000 SNPs for in silico replication. The NHS/HPFS T2D GWAS included 2,591 cases and 3,052 controls of European ancestry. We recognize that this approach may have reduced our chances of finding ethnicity-specific T2D markers, however, this approach had the advantage of enhancing our ability of finding true genetic markers. From the first in silico replication, 65 SNPs with the same direction of association in both studies and with a MAF >20% were chosen for a second in silico replication using GWAS scan data from a Korean T2D study, which included 1,042 cases and 2,943 controls genotyped with the Affymetrix Genome-Wide Human SNP Array 5.0 platform. In order to improve yield, only the top SNPs that are included in Affymetrix 5.0 (N = 56) or that are in high LD (r2>0.8) with at least one SNP on Affymetrix 5.0 (N = 9) were selected for replication (Table S1). Of the 65 SNPs, the top 8 SNPs replicated in the Korean T2D study were further investigated using GWAS data from a T2D study conducted among Singapore Chinese (2,010 cases and 1,945 controls) who were genotyped by using Illumina HumanHap 610 or Illumina Human1M (Table S2). Four of the 8 SNPs were not directly genotyped in the Singapore study, so instead, we selected SNPs that are in strong LD with these 4 SNPs (imputed SNP information became available recently and is presented in this report). Finally, the 5 top SNPs (rs2815429, rs10906115, rs1359790, rs10751301, and rs1436955) were selected for de novo genotyping in an independent sample set of 1,645 T2D cases and 1,649 controls identified from the SWHS and Shanghai Men's Health Study (SMHS). Four of these SNPs (rs10906115, rs1359790, rs10751301, and rs1436955) were selected for the final stage of de novo genotyping replication in two independent Chinese studies, the Wuhan Diabetes Study (WDS; 1,063 cases and 1,408 controls) and the Nutrition and Health of Aging Population in China (NHAPC) study (424 cases and 1,908 controls). Detailed descriptions of the study designs and populations for each of the participating studies are presented in Text S1 online.
Genotyping for the 5 SNPs included in the SWHS and SMHS sample set was completed using the iPLEX Sequenom MassArray platform. Included in each 96-well plate as quality control samples were two negative controls, two blinded duplicates, and two samples included in the HapMap project. We also included 65 subjects who had been genotyped by the Affymetrix SNP Array 6.0 in the Sequenom genotyping. The consistency rate was 100% for all SNPs for the blinded duplicates, compared with the HapMap data and compared with data from the Affymetrix SNP Array 6.0. Genotyping for the final 4 SNPs in the WDS and NHAPC was completed using TaqMan assays at the two local institute laboratories using reagents provided by the Vanderbilt Molecular Epidemiology Laboratory. Both laboratories were asked to genotype a trial plate provided by the Vanderbilt Molecular Epidemiology Laboratory that contained DNA from 70 Chinese samples before the main study genotyping was conducted. The consistency rates for these trial samples were 100% compared with genotypes previously determined at Vanderbilt for all four SNPs in both local laboratories. In addition, replicate samples comparing 3–7% of all study samples were dispersed among genotyping plates for both studies.
Imputation
The imputation of un-genotyped SNPs in all participating GWASs was carried out after the completion of the current study using the programs MACH (http://www.sph.umich.edu/csg/abecasis/MACH/) or IMPUTE (https://mathgen.stats.ox.ac.uk/impute) with HapMap Asian data as the reference for Asians and CEU data as the reference for European-ancestry samples. Only data with high imputation quality (RSQR >0.3 for MACH) were included in the current analysis.
Statistical analyses
PLINK version 1.06 was used to analyze genome-wide data obtained in the SBCS/SWHS GWAS scan. Population structure was evaluated by principal component analysis using EIGENSTRAT (http://genepath.med.harvard.edu/~reich/Software.htm).A set of 12,533 SNPs with a MAF ≥10% in Chinese samples and a distance of ≥25 kb between two adjacent SNPs was selected to evaluate the population structure. The first two principal components were included in the logistic regression models for adjustment of population structures. The inflation factor λ was estimated to be 1.03, suggesting that population substructure, if present, should not have any appreciable effect on the results.
Pooled and meta-analyses were carried out in SAS to derive combined odds ratios (OR) by using data from studies of all stages. We applied the weighted z-statistics method, where weights are proportional to the square root of the number of subjects in each study. Results from both random and fixed effect models are presented.
ORs and 95% confidence intervals (CI) were estimated using logistic regression models with adjustment for age, BMI, population structure (for GWAS data), and gender, when appropriate. Analyses with additional adjustment for smoking were conducted by pooled analysis whenever possible and by meta-analysis when KARE data were included in order to examine the confounding and modification effects of these factors (Table S2). Genotype distributions for the top 4 SNPs included in the final de novo genotyping were consistent with HWE (P> 0.05) in each study. All P values presented are based on two-tailed tests, except where indicated otherwise.
Results
The general characteristics of the participating study populations are presented in Table 1. T2D cases had a higher BMI than controls across all studies. Except for the SWHS, SMHS, and Shanghai Nutrition Institute (SNI) validation studies, where cases and controls were matched on age, cases were older than controls in all other studies. A difference in gender distribution was also seen in several studies. These variables were adjusted for in subsequent analyses.
Tab. 1. Characteristics of the study participants. 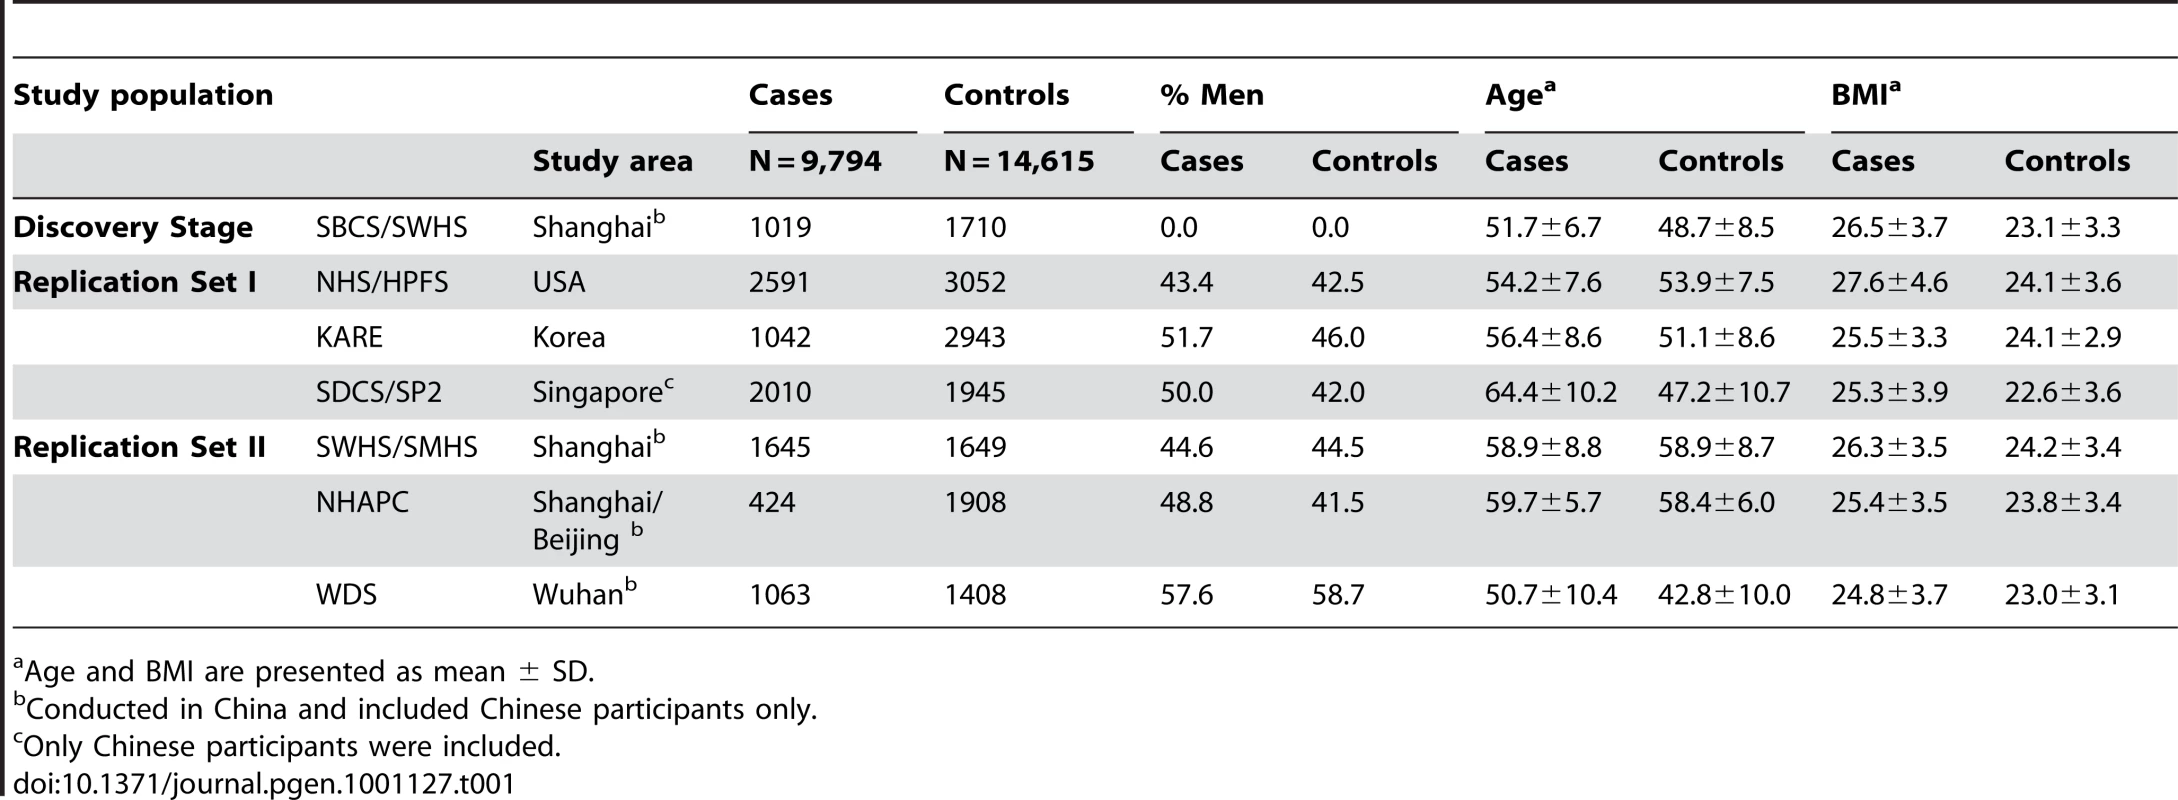
Age and BMI are presented as mean ± SD. Table 2 presents the results of analyses of associations of T2D with previously reported, GWAS-identified genetic markers in our discovery samples [1]–[9]. Of the 24 SNPs reported by previous GWAS, 15 were directly genotyped by the Affymetrix SNP Array 6.0. One SNP (rs7578597) showed a MAF = 0 in HapMap CHB data and was not included on the Affymetrix 6.0 chip. The remaining 8 SNPs, including rs2943641, rs10010131, rs13266634, rs12779790, and rs4430796, as well as the newly identified markers rs391300 and rs17584499, were imputed. SNP rs4430796 showed low imputation quality (RSQR = 0.06) in the SBCS/SWHS GWAS and was excluded from the analysis.
Tab. 2. Associations of previously-reported T2D related SNPs with disease risk in Chinese women. 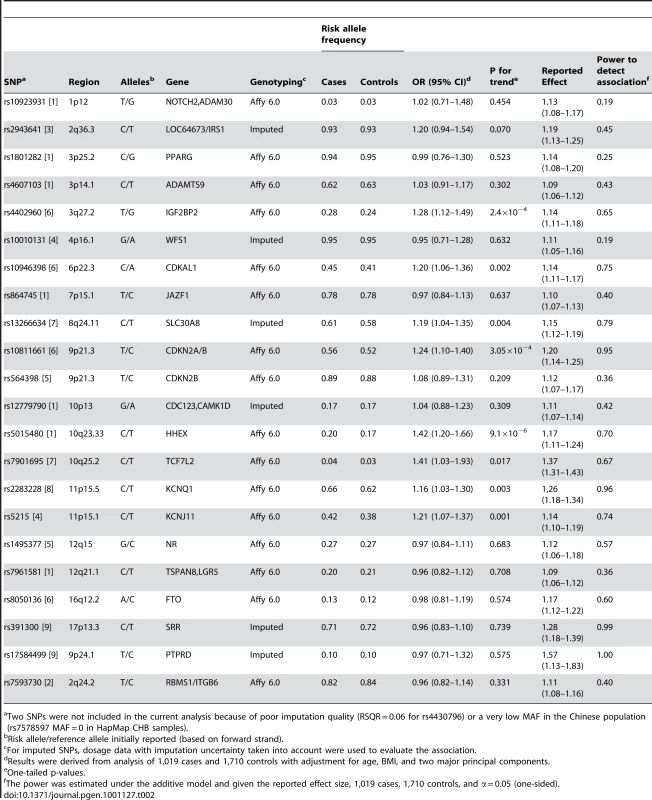
Two SNPs were not included in the current analysis because of poor imputation quality (RSQR = 0.06 for rs4430796) or a very low MAF in the Chinese population (rs7578597 MAF = 0 in HapMap CHB samples). We found that 8 of these SNPs showed an association consistent with initial reports at P<0.05, including rs4402960 (3q27.2, IGF2BP2), rs10946398 (6p22.3, CDKAL1), rs13266634 (8q24.11, SLC30A8), rs10811661 (9p21.3, CDKN2A/B), rs5015480 (10q23.33, HHEX), rs7901695 (10q25.2, TCF7L2), rs2283228 (11p15.5, KCNQ1), and rs5215 (11p15.1, KCNJ11). Among the remaining 11 SNPs, 4 SNPs had a MAF of 3–7% in our study population. Thus, our study did not have sufficient statistical power (statistical power range: 19–45%) to replicate these markers (Table 2). Associations of T2D with SNPs that are in LD with the reported T2D SNPs discovered in European-ancestry populations or in Asians are presented in Table S3.
Multidimensional scaling analyses of the GWAS scan data showed no evidence of apparent genetic admixture in our study population (Figure S2). The observed number of SNPs with a small P value was larger than expected by chance (Figure S3). We found that rs10906115 (10p13), rs1359790 (13q31.1), and rs1436955 (15q22.2) were consistently associated with T2D across all studies, although the 95% CI for the per allele ORs in several studies included 1.0 (Table 3; Figure 1). P-values for trend tests (per allele OR, 95% CI) from meta-analyses of data from all studies were highly statistically significant for these associations: 1.45×10⁻⁸ for rs10906115 (1.13, 1.08–1.18), 6.49×10⁻⁹ for rs1359790 (1.15, 1.10–1.20), and 7.14×10⁻⁷ for rs1436955 (1.13, 1.08–1.19). These P-values were below (for rs1359790 and rs10906115) or near (for rs1436955) the genome-wide significance level of 5.0×10⁻⁸. SNP rs10751301 (11q14.1) was not replicated in the Singapore or de novo genotyping studies; the P-value for the meta-analysis was 1.31×10⁻⁴ in the fixed effect model and 0.004 in the random effect model. Additional adjustment for smoking history did not appreciably change the point estimates described above, although the P-values were slightly elevated (Table S2).
Fig. 1. Forest plot for per-allele ORs for the association of T2D risk with 4 SNPs in all participating studies. 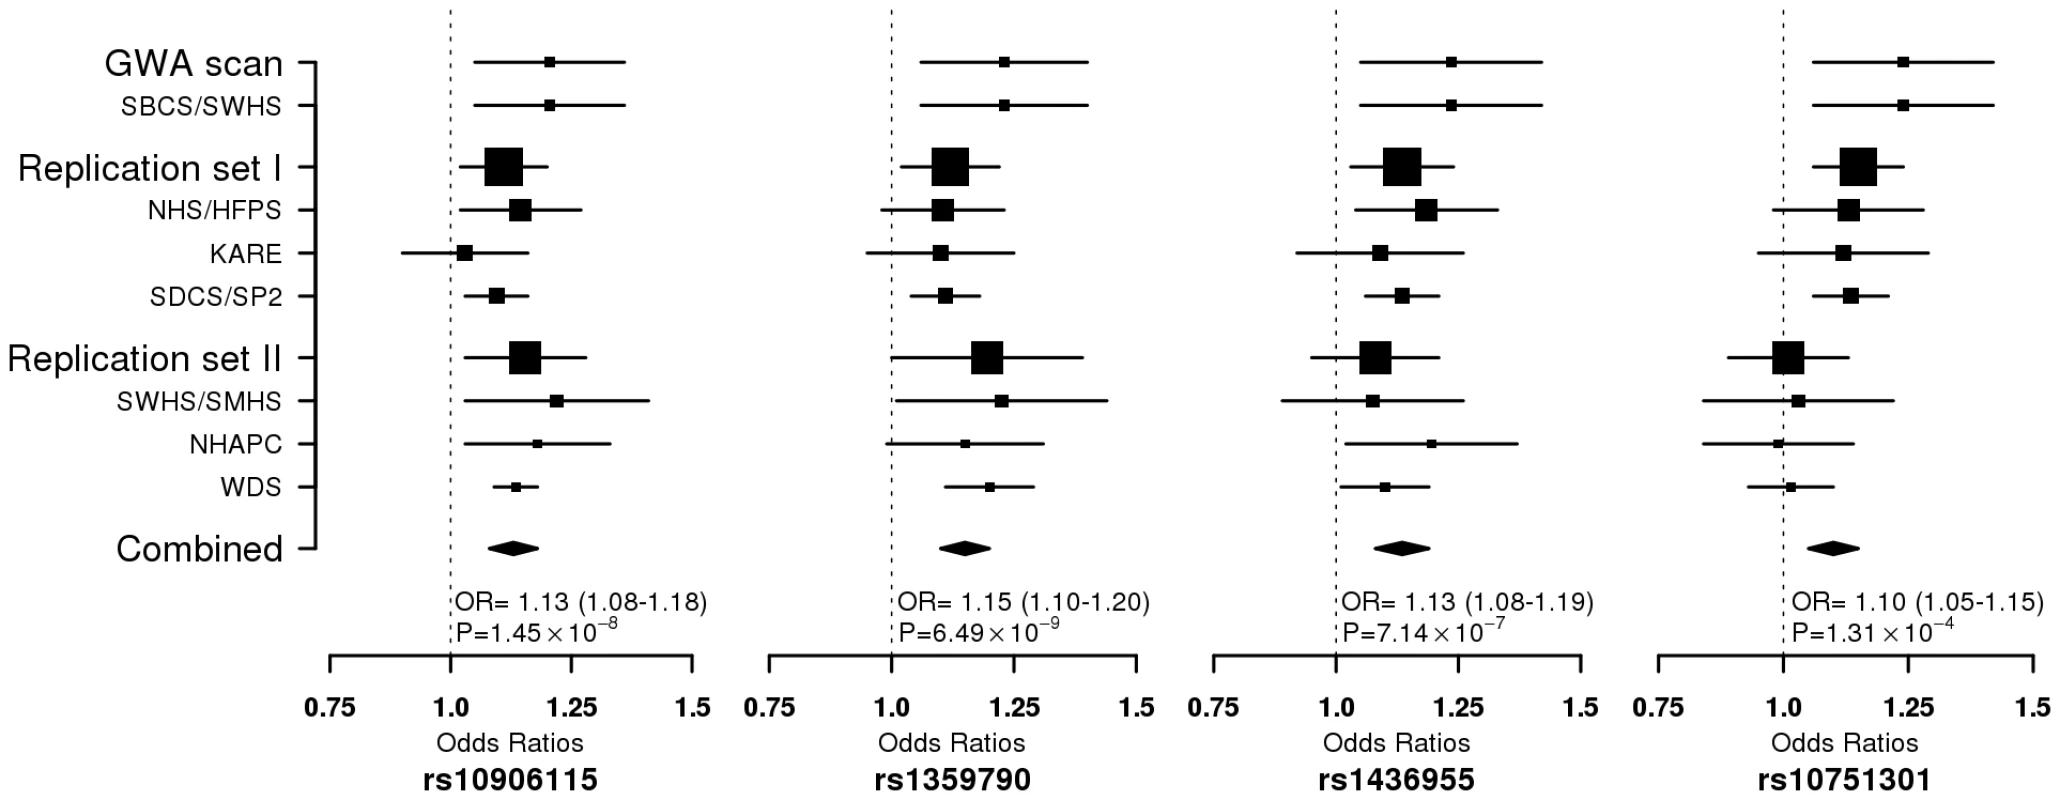
Tab. 3. Associations of T2D risk with the top four SNPs by study phase. 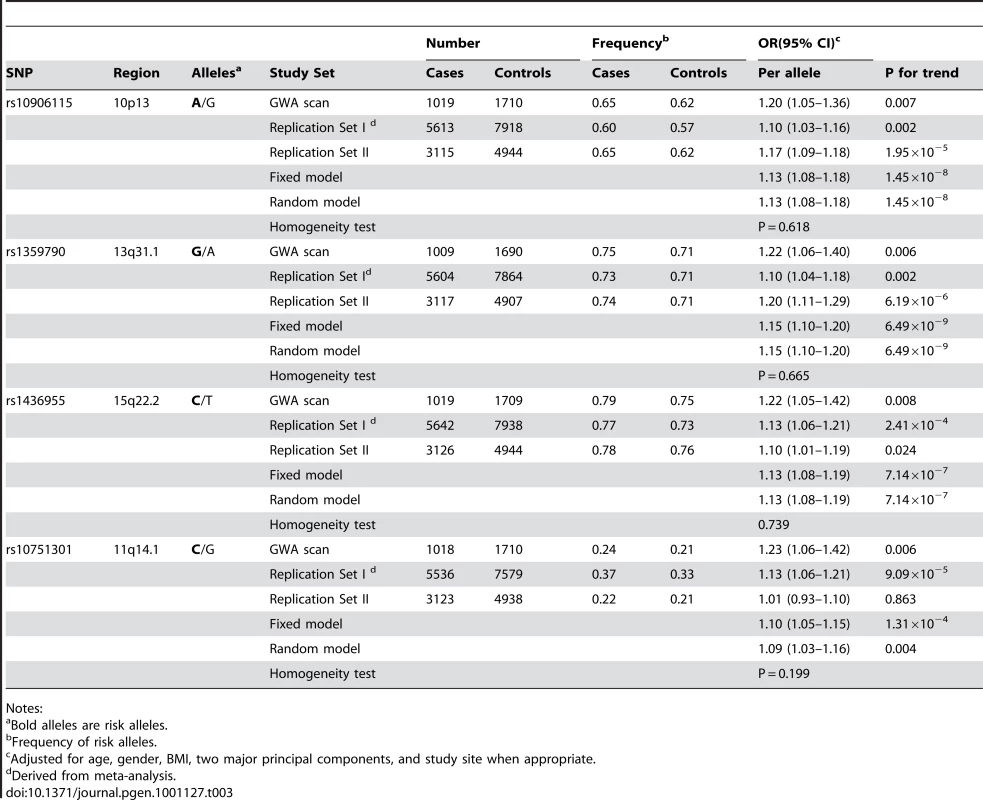
Notes: In an exploratory analysis stratified by smoking, BMI, family history of T2D, and age at diagnosis, SNP rs1359790 showed a slightly stronger association with T2D risk among non-smokers (per allele OR = 1.19, 95% CI = 1.12–1.26, P = 6.4×10⁻⁸) than among smokers (OR = 1.09, 95% CI = 1.00–1.19, P = 0.044) with a P value of 0.11 for interaction (Table S4). None of the SNPs were related to age at onset of T2D. Neither family history of T2D nor BMI altered the SNP-T2D associations under study.
Discussion
Using the GWAS data from our discovery stage samples, we were able to validate 8 of 22 previously reported, GWAS-identified T2D SNPs, lending strong support to the validity of the initial discovery samples and methodologies. Applying a fast-track validation study approach, we also identified three promising new T2D markers.
The most significant association identified by our study was for rs1359790 (13q13.1), a novel genetic susceptibility locus identified for T2D (Figure 2). Several transcription factors, such as NIT-2, CdxA, GATA-2, and CDP, bind to this polymorphic site. The C to T transition eliminates a GATA-2 binding site and creates a TATA binding site. The closest known gene, sprouty homolog 2 (Drosophila) (SPRY2), is located 193 kb upstream of rs1359790. The SPRY2 gene encodes a protein belonging to the sprouty family and inhibits growth factor-mediated, receptor tyrosine kinase-induced, mitogen-activated protein kinase signaling [13]. The encoded protein contains a carboxyl-terminal cysteine-rich domain essential for the inhibitory activity of receptor tyrosine kinase signaling proteins and is required for growth factor-stimulated translocation of the protein to membrane ruffles [13], [14]. SPRY2 also modulates the apoptotic actions induced by the pro-inflammatory cytokine, tumor necrosis factor-alpha [15]. SPRY4, a homolog of SPRY2, inhibits the insulin receptor-transduced MAPK signaling pathway [16] and regulates development of the pancreas [17].
Fig. 2. Association signals at four chromosome regions. 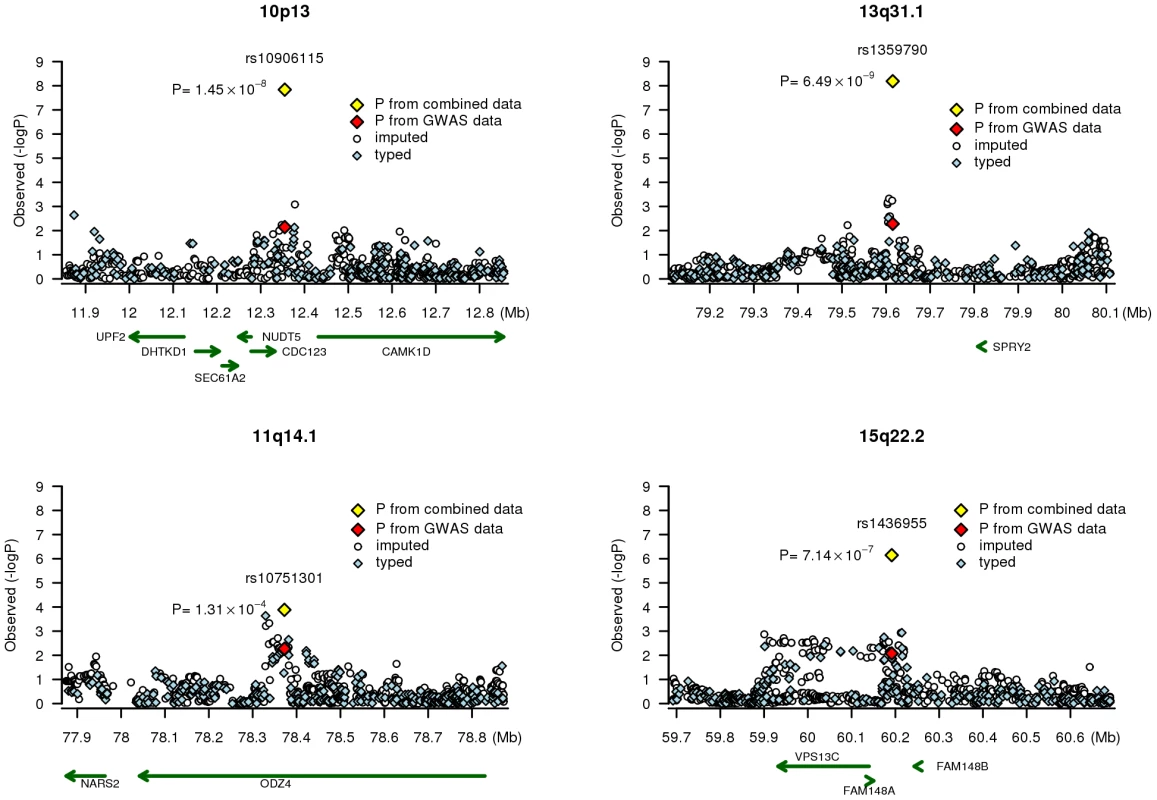
Results (-logP) are shown for directly genotyped (blue diamonds) and imputed (white circles) SNPs for a 1Mb region centered on the SNP of interest. Gene locations are from the March 2006 UCSC genome browser assembly. SNP rs10906115 is located on chromosome 10p13 (Figure 2), 13.0 kb from rs12779790, which was reported by a previous GWAS of T2D [1]. These two SNPs, however, are in low LD in both Chinese (r2 = 0.06) and European populations (r2 = 0.19) based on HapMap data. SNP rs12779790 was not included in the Affymetrix SNP Array 6.0, Illumina HumanHap 610-Quad, or Human1M-Duo; thus, it was imputed for both the SBCS/SWHS and the NHS/HPFS by using MACH with RSQR>0.9 and for the Singapore studies using IMPUTE with PROPER_INFO >0.85. The imputed SNP rs12779790 was associated with a per allele OR of 1.10 (95% CI = 1.01–1.19, P = 0.035) in the analysis of pooled data from three studies. However, when both rs12779790 and rs10906115 were included in the same logistic model, the association with rs10906115 remained statistically significant (per allele OR = 1.09, 95% CI = 1.02–1.16, P = 0.007), while the association with rs12779790 was no longer statistically significant (per allele OR = 1.04 [95% CI = 0.96–1.12], P = 0.38; Table 4). These data provide strong evidence that rs10906115 is a new genetic variant at 10p13 independent of the previously-identified SNP rs12779790.
Tab. 4. Association of SNPs rs10906115 and rs12779790 with type 2 diabetes. 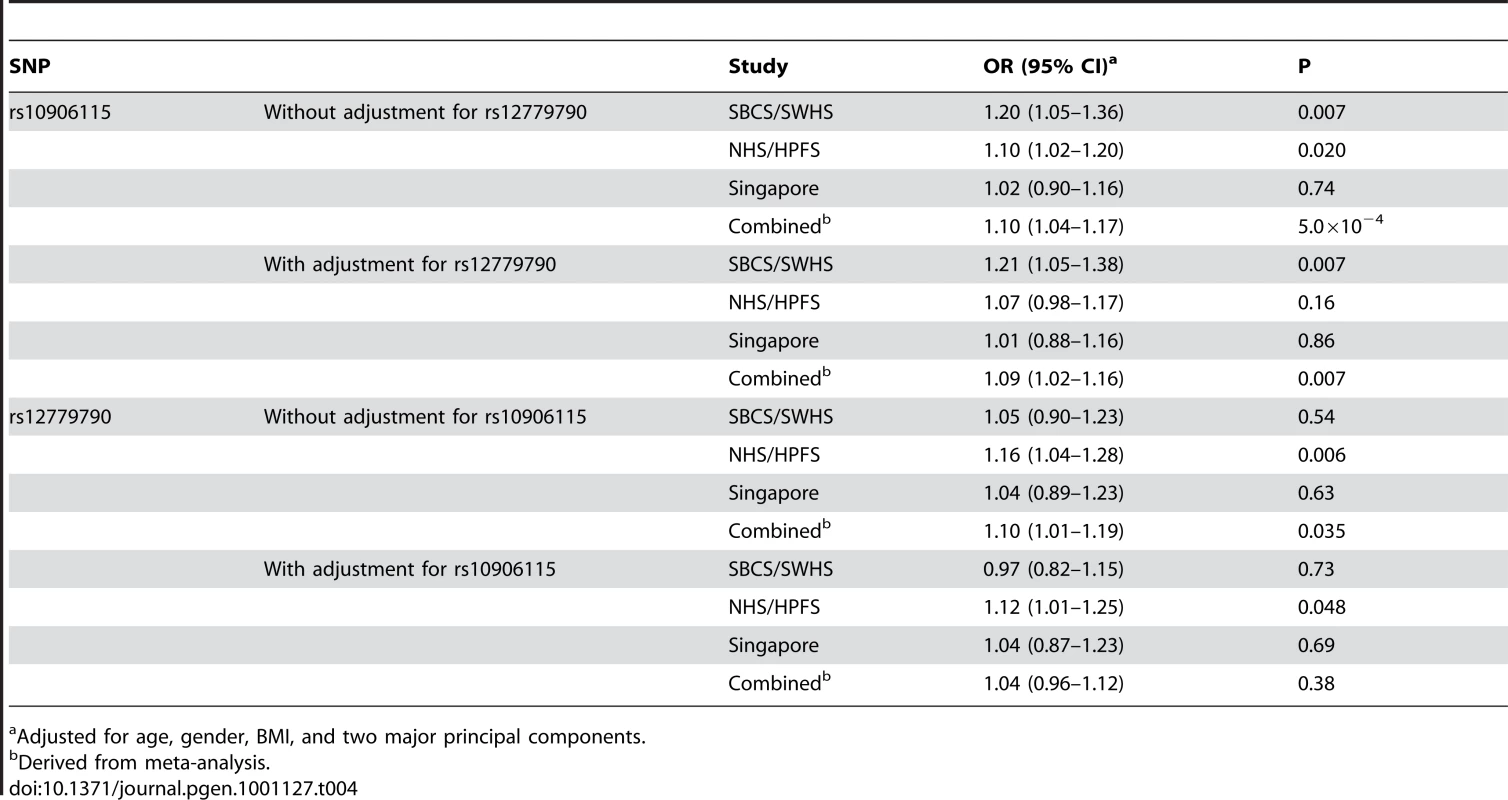
Adjusted for age, gender, BMI, and two major principal components. SNP rs10906115 is located 22.4 kb downstream of the cell division-cycle 123 homolog (S. cerevisiae) (CDC123) gene and 76.6 kb upstream of the calcium/calmodulin-dependent protein kinase ID (CAMK1D) gene (Figure 2). The CDC123 gene encodes a protein involved in cell cycle regulation and nutritional control of gene transcription [18]. The CAMK1D gene encodes a member of the Ca2+/calmodulin-dependent protein kinase 1 subfamily of serine/threonine kinases. The encoded protein may be involved in the regulation of granulocyte function through the chemokine signal transduction pathway [19]. The role of the CDC123 and CAMK1D genes in the etiology of T2D is unclear.
SNP rs1436955, located on chromosome 15q22.2 (Figure 2), is 51.4 kb downstream of a C2 calcium-dependent domain containing the 4B gene (C2CD4B; also known as NLF2 or FAM148B). C2CD4B is up-regulated by pro-inflammatory cytokines and may play a role in regulating genes that control cellular architecture [20]. The role of inflammation in the pathophsyiology of T2D has been suggested previously [21]–[25]. C2CD4B and SPRY2 are both highly expressed in human pancreatic tissue [26]. Intriguingly, a very recent report from the Meta-Analysis of Glucose and Insulin-related traits Consortium (MAGIC) found that a SNP (rs11071657) near the C2CD4B gene was associated with fasting glucose (P = 3.6×10⁻⁸) and T2D (P = 2.9×10⁻³) [27]. SNPs rs11071657 and rs1436955, however, are not in LD (r2 = 0.04) in Asians, although they are weakly related (r2 = 0.25) in Europeans, according to HapMap data. SNP rs11071657 is not included in the Affymetrix SNP 6.0 array. Imputed data from the SBCS/SWHS GWAS showed that this SNP was not significantly associated with T2D risk (per A allele OR = 1.06, 95% CI = 0.94–1.19), although the direction of the association was consistent with that reported by the MAGIC consortium [27]. Adjusting for rs11071657 did not alter the association of T2D risk with rs1436955 (per allele OR = 1.21, 95% CI = 1.06–1.39, P = 0.006). Again, these data strongly imply that rs1436955 may be a new genetic risk variant for T2D at 15q22.2 independent of the recently reported SNP rs11071657.
In summary, in this first GWAS of T2D conducted in a Chinese population, we identified a novel genetic susceptibility locus for T2D, rs1359790, at 13q31.1. Furthermore, we revealed two new genetic variants (rs10906115 at 10p13 and rs1436955 at15q22.2) near T2D susceptibility loci previously reported by GWAS of T2D conducted in European-ancestry populations. Our study demonstrates the value of conducting GWAS in non-European populations for the identification of novel genetic susceptibility markers for T2D.
Supporting Information
Zdroje
1. ZegginiE
ScottLJ
SaxenaR
VoightBF
MarchiniJL
2008 Meta-analysis of genome-wide association data and large-scale replication identifies additional susceptibility loci for type 2 diabetes. Nat Genet 40 638 645
2. QiL
CornelisMC
KraftP
StanyaKJ
KaoWHL
2010 Genetic variants at 2q24 are associated with susceptibility to type 2 diabetes. Hum Mol Genet 19 2706 2715
3. RungJ
CauchiS
AlbrechtsenA
ShenL
RocheleauG
2009 Genetic variant near IRS1 is associated with type 2 diabetes, insulin resistance and hyperinsulinemia. Nat Genet 41 1110 1115
4. FraylingTM
2007 Genome-wide association studies provide new insights into type 2 diabetes aetiology. Nat Rev Genet 8 657 662
5. ZegginiE
WeedonMN
LindgrenCM
FraylingTM
ElliottKS
2007 Replication of genome-wide association signals in UK samples reveals risk loci for type 2 diabetes. Science 316 1336 1341
6. ScottLJ
MohlkeKL
BonnycastleLL
WillerCJ
LiY
2007 A genome-wide association study of type 2 diabetes in Finns detects multiple susceptibility variants. Science 316 1341 1345
7. SladekR
RocheleauG
RungJ
DinaC
ShenL
2007 A genome-wide association study identifies novel risk loci for type 2 diabetes. Nature 445 881 885
8. UnokiH
TakahashiA
KawaguchiT
HaraK
HorikoshiM
2008 SNPs in KCNQ1 are associated with susceptibility to type 2 diabetes in East Asian and European populations. Nat Genet 40 1098 1102
9. TsaiFJ
YangCF
ChenCC
ChuangLM
LuCH
2010 A genome-wide association study identifies susceptibility variants for type 2 diabetes in Han Chinese. PLoS Genet 6 e1000847
10. ChanJC
MalikV
JiaW
KadowakiT
YajnikCS
2009 Diabetes in Asia: epidemiology, risk factors, and pathophysiology. JAMA 301 2129 2140
11. ZhengW
LongJ
GaoYT
LiC
ZhengY
2009 Genome-wide association study identifies a new breast cancer susceptibility locus at 6q25.1. Nat Genet 41 324 328
12. PurcellS
NealeB
Todd-BrownK
ThomasL
FerreiraMA
2007 PLINK: a tool set for whole-genome association and population-based linkage analyses. Am J Hum Genet 81 559 575
13. CabritaMA
ChristoforiG
2008 Sprouty proteins, masterminds of receptor tyrosine kinase signaling. Angiogenesis 11 53 62
14. GuyGR
JacksonRA
YusoffP
ChowSY
2009 Sprouty proteins: modified modulators, matchmakers or missing links? J Endocrinol 203 191 202
15. DingW
WarburtonD
2008 Down-regulation of Sprouty2 via p38 MAPK plays a key role in the induction of cellular apoptosis by tumor necrosis factor-alpha. Biochem Biophys Res Commun 375 460 464
16. LeeksmaOC
Van AchterbergTA
TsumuraY
ToshimaJ
ElderingE
2002 Human sprouty 4, a new ras antagonist on 5q31, interacts with the dual specificity kinase TESK1. Eur J Biochem 269 2546 2556
17. JaggiF
CabritaMA
PerlAK
ChristoforiG
2008 Modulation of endocrine pancreas development but not beta-cell carcinogenesis by Sprouty4. Mol Cancer Res 6 468 482
18. P
ShilinskiK
TsichlisPN
BrennerC
2004 Cdc123 and checkpoint forkhead associated with RING proteins control the cell cycle by controlling eIF2gamma abundance. J Biol Chem 279 44656 44666
19. VerploegenS
UlfmanL
van DeutekomHW
van AalstC
HoningH
2005 Characterization of the role of CaMKI-like kinase (CKLiK) in human granulocyte function. Blood 106 1076 1083
20. WartonK
FosterNC
GoldWA
StanleyKK
2004 A novel gene family induced by acute inflammation in endothelial cells. Gene 342 85 95
21. GoldbergRB
2009 Cytokine and cytokine-like inflammation markers, endothelial dysfunction, and imbalanced coagulation in development of diabetes and its complications. J Clin Endocrinol Metab 94 3171 3182
22. SurampudiPN
John-KalarickalJ
FonsecaVA
2009 Emerging concepts in the pathophysiology of type 2 diabetes mellitus. Mt Sinai J Med 76 216 226
23. RayA
HuismanMV
TamsmaJT
vanAJ
BingenBO
2009 The role of inflammation on atherosclerosis, intermediate and clinical cardiovascular endpoints in type 2 diabetes mellitus. Eur J Intern Med 20 253 260
24. KingGL
2008 The role of inflammatory cytokines in diabetes and its complications. J Periodontol 79 1527 1534
25. MollerDE
BergerJP
2003 Role of PPARs in the regulation of obesity-related insulin sensitivity and inflammation. Int J Obes Relat Metab Disord 27 Suppl 3 S17 S21
26. YanaiI
BenjaminH
ShmoishM
Chalifa-CaspiV
ShklarM
2005 Genome-wide midrange transcription profiles reveal expression level relationships in human tissue specification. Bioinformatics 21 650 659
27. DupuisJ
LangenbergC
ProkopenkoI
SaxenaR
SoranzoN
2010 New genetic loci implicated in fasting glucose homeostasis and their impact on type 2 diabetes risk. Nat Genet
Štítky
Genetika Reprodukční medicína
Článek Allelic Variation at the 8q23.3 Colorectal Cancer Risk Locus Functions as a Cis-Acting Regulator ofČlánek Allelic Selection of Amplicons in Glioblastoma Revealed by Combining Somatic and Germline AnalysisČlánek Lactic Acidosis Triggers Starvation Response with Paradoxical Induction of TXNIP through MondoAČlánek Rice a Cinnamoyl-CoA Reductase-Like Gene Family Member, Is Required for NH1-Mediated Immunity to pv.Článek Differentiation of Zebrafish Melanophores Depends on Transcription Factors AP2 Alpha and AP2 Epsilon
Článek vyšel v časopisePLOS Genetics
Nejčtenější tento týden
2010 Číslo 9
-
Všechny články tohoto čísla
- Optimal Strategy for Competence Differentiation in Bacteria
- Mutational Patterns Cannot Explain Genome Composition: Are There Any Neutral Sites in the Genomes of Bacteria?
- Frail Hypotheses in Evolutionary Biology
- Genetic Architecture of Complex Traits and Accuracy of Genomic Prediction: Coat Colour, Milk-Fat Percentage, and Type in Holstein Cattle as Contrasting Model Traits
- Allelic Variation at the 8q23.3 Colorectal Cancer Risk Locus Functions as a Cis-Acting Regulator of
- Allelic Selection of Amplicons in Glioblastoma Revealed by Combining Somatic and Germline Analysis
- Germline Variation Controls the Architecture of Somatic Alterations in Tumors
- Mice Doubly-Deficient in Lysosomal Hexosaminidase A and Neuraminidase 4 Show Epileptic Crises and Rapid Neuronal Loss
- Analysis of Population Structure: A Unifying Framework and Novel Methods Based on Sparse Factor Analysis
- FliO Regulation of FliP in the Formation of the Flagellum
- Cdc20 Is Critical for Meiosis I and Fertility of Female Mice
- dMyc Functions Downstream of Yorkie to Promote the Supercompetitive Behavior of Hippo Pathway Mutant Cells
- DCAF26, an Adaptor Protein of Cul4-Based E3, Is Essential for DNA Methylation in
- Genome-Wide Double-Stranded RNA Sequencing Reveals the Functional Significance of Base-Paired RNAs in
- An Immune Response Network Associated with Blood Lipid Levels
- Genetic Variants and Their Interactions in the Prediction of Increased Pre-Clinical Carotid Atherosclerosis: The Cardiovascular Risk in Young Finns Study
- The Histone H3K36 Methyltransferase MES-4 Acts Epigenetically to Transmit the Memory of Germline Gene Expression to Progeny
- Long- and Short-Term Selective Forces on Malaria Parasite Genomes
- Lactic Acidosis Triggers Starvation Response with Paradoxical Induction of TXNIP through MondoA
- Identification of Early Requirements for Preplacodal Ectoderm and Sensory Organ Development
- Orphan CpG Islands Identify Numerous Conserved Promoters in the Mammalian Genome
- Analysis of the Basidiomycete Reveals Conservation of the Core Meiotic Expression Program over Half a Billion Years of Evolution
- ETS-4 Is a Transcriptional Regulator of Life Span in
- The SR Protein B52/SRp55 Is Required for DNA Topoisomerase I Recruitment to Chromatin, mRNA Release and Transcription Shutdown
- The Baker's Yeast Diploid Genome Is Remarkably Stable in Vegetative Growth and Meiosis
- Chromatin Landscape Dictates HSF Binding to Target DNA Elements
- The APETALA-2-Like Transcription Factor OsAP2-39 Controls Key Interactions between Abscisic Acid and Gibberellin in Rice
- Accurately Assessing the Risk of Schizophrenia Conferred by Rare Copy-Number Variation Affecting Genes with Brain Function
- Widespread Over-Expression of the X Chromosome in Sterile F Hybrid Mice
- The Characterization of Twenty Sequenced Human Genomes
- The Genome of a Pathogenic : Cooptive Virulence Underpinned by Key Gene Acquisitions
- A Single Element Maintains Repression of the Key Developmental Regulator
- Identification of New Genetic Risk Variants for Type 2 Diabetes
- Effect of Correlated tRNA Abundances on Translation Errors and Evolution of Codon Usage Bias
- Evidence of Selection upon Genomic GC-Content in Bacteria
- Proteomic Changes Resulting from Gene Copy Number Variations in Cancer Cells
- Rice a Cinnamoyl-CoA Reductase-Like Gene Family Member, Is Required for NH1-Mediated Immunity to pv.
- Longitudinal Genome-Wide Association of Cardiovascular Disease Risk Factors in the Bogalusa Heart Study
- Response to Mechanical Stress Is Mediated by the TRPA Channel Painless in the Heart
- DNMT3L Modulates Significant and Distinct Flanking Sequence Preference for DNA Methylation by DNMT3A and DNMT3B
- Identifying Signatures of Natural Selection in Tibetan and Andean Populations Using Dense Genome Scan Data
- Incremental Genetic Perturbations to MCM2-7 Expression and Subcellular Distribution Reveal Exquisite Sensitivity of Mice to DNA Replication Stress
- Loss of Maternal ATRX Results in Centromere Instability and Aneuploidy in the Mammalian Oocyte and Pre-Implantation Embryo
- Comparative Genomic Hybridization (CGH) Reveals a Neo-X Chromosome and Biased Gene Movement in Stalk-Eyed Flies (Genus )
- Differentiation of Zebrafish Melanophores Depends on Transcription Factors AP2 Alpha and AP2 Epsilon
- Gene–Environment Interactions at Nucleotide Resolution
- Dementia Revealed: Novel Chromosome 6 Locus for Late-Onset Alzheimer Disease Provides Genetic Evidence for Folate-Pathway Abnormalities
- Critical Functions of Rpa3/Ssb3 in S-Phase DNA Damage Responses in Fission Yeast
- Preferential Re-Replication of Heterochromatin in the Absence of Geminin
- The Potential for Enhancing the Power of Genetic Association Studies in African Americans through the Reuse of Existing Genotype Data
- Evidence That Mutation Is Universally Biased towards AT in Bacteria
- Perturbation Analysis of Heterochromatin-Mediated Gene Silencing and Somatic Inheritance
- Diversity of Eukaryotic DNA Replication Origins Revealed by Genome-Wide Analysis of Chromatin Structure
- Genetic Deletion of the Desmosomal Component Promotes Tumor Microinvasion in a Mouse Model of Pancreatic Neuroendocrine Carcinogenesis
- The Metabolic Enzyme ManA Reveals a Link between Cell Wall Integrity and Chromosome Morphology
- SNPs Associated with Cerebrospinal Fluid Phospho-Tau Levels Influence Rate of Decline in Alzheimer's Disease
- Synthesizing and Salvaging NAD: Lessons Learned from
- A Central Regulatory System Largely Controls Transcriptional Activation and Repression Responses to Phosphate Starvation in Arabidopsis
- An Insect Herbivore Microbiome with High Plant Biomass-Degrading Capacity
- PLOS Genetics
- Archiv čísel
- Aktuální číslo
- Informace o časopisu
Nejčtenější v tomto čísle- Synthesizing and Salvaging NAD: Lessons Learned from
- Optimal Strategy for Competence Differentiation in Bacteria
- Long- and Short-Term Selective Forces on Malaria Parasite Genomes
- Identifying Signatures of Natural Selection in Tibetan and Andean Populations Using Dense Genome Scan Data
Kurzy
Zvyšte si kvalifikaci online z pohodlí domova
Současné možnosti léčby obezity
nový kurzAutoři: MUDr. Martin Hrubý
Všechny kurzyPřihlášení#ADS_BOTTOM_SCRIPTS#Zapomenuté hesloZadejte e-mailovou adresu, se kterou jste vytvářel(a) účet, budou Vám na ni zaslány informace k nastavení nového hesla.
- Vzdělávání


