-
Články
Top novinky
Reklama- Vzdělávání
- Časopisy
Top články
Nové číslo
- Témata
Top novinky
Reklama- Videa
- Podcasty
Nové podcasty
Reklama- Kariéra
Doporučené pozice
Reklama- Praxe
Top novinky
ReklamaTransformation of Natural Genetic Variation into Genomes
Many bacteria are able to efficiently bind and take up double-stranded DNA fragments, and the resulting natural transformation shapes bacterial genomes, transmits antibiotic resistance, and allows escape from immune surveillance. The genomes of many competent pathogens show evidence of extensive historical recombination between lineages, but the actual recombination events have not been well characterized. We used DNA from a clinical isolate of Haemophilus influenzae to transform competent cells of a laboratory strain. To identify which of the ∼40,000 polymorphic differences had recombined into the genomes of four transformed clones, their genomes and their donor and recipient parents were deep sequenced to high coverage. Each clone was found to contain ∼1000 donor polymorphisms in 3–6 contiguous runs (8.1±4.5 kb in length) that collectively comprised ∼1–3% of each transformed chromosome. Seven donor-specific insertions and deletions were also acquired as parts of larger donor segments, but the presence of other structural variation flanking 12 of 32 recombination breakpoints suggested that these often disrupt the progress of recombination events. This is the first genome-wide analysis of chromosomes directly transformed with DNA from a divergent genotype, connecting experimental studies of transformation with the high levels of natural genetic variation found in isolates of the same species.
Published in the journal: . PLoS Pathog 7(7): e32767. doi:10.1371/journal.ppat.1002151
Category: Research Article
doi: https://doi.org/10.1371/journal.ppat.1002151Summary
Many bacteria are able to efficiently bind and take up double-stranded DNA fragments, and the resulting natural transformation shapes bacterial genomes, transmits antibiotic resistance, and allows escape from immune surveillance. The genomes of many competent pathogens show evidence of extensive historical recombination between lineages, but the actual recombination events have not been well characterized. We used DNA from a clinical isolate of Haemophilus influenzae to transform competent cells of a laboratory strain. To identify which of the ∼40,000 polymorphic differences had recombined into the genomes of four transformed clones, their genomes and their donor and recipient parents were deep sequenced to high coverage. Each clone was found to contain ∼1000 donor polymorphisms in 3–6 contiguous runs (8.1±4.5 kb in length) that collectively comprised ∼1–3% of each transformed chromosome. Seven donor-specific insertions and deletions were also acquired as parts of larger donor segments, but the presence of other structural variation flanking 12 of 32 recombination breakpoints suggested that these often disrupt the progress of recombination events. This is the first genome-wide analysis of chromosomes directly transformed with DNA from a divergent genotype, connecting experimental studies of transformation with the high levels of natural genetic variation found in isolates of the same species.
Introduction
For many bacteria, natural transformation is the dominant mode of genetic transfer between close relatives. These naturally competent bacterial species can actively take up DNA fragments from their surroundings and incorporate it into their chromosomes by homologous recombination [1]–[3]. Like sexual reproduction in eukaryotes, natural transformation moves alleles and loci between related bacterial lineages, allowing pathogens to share antibiotic resistances, antigenic determinants, and other virulence factors [4]–[10]. Population genetic studies have found evidence of pervasive recombination between lineages of human pathogenic bacteria, especially in taxa known to be naturally competent [11]–[12]. However such estimates of recombination are confounded by the other evolutionary forces of mutation and selection, and by the poorly understood demographic histories of the sampled isolates [13]–[15].
Naturally competent bacterial cells bind double-stranded DNA fragments at the cell surface but transport only single strands into the cytoplasm (Figure 1) [1]–[2]. Although several details of DNA uptake differ between Gram-positive and Gram-negative bacteria, in all bacteria the ensuing recombination between donor molecule and recipient chromosome is mediated by RecA homologs and other cytoplasmic proteins that limit DNA degradation and/or facilitate RecA-mediated strand exchange [1], [16]–[17]. In the laboratory competent cells can take up multiple long DNA fragments, although typically only a fraction of cells in a culture becomes competent [18]. As a consequence selection for transformation at one marker increases the fraction of cells found to be transformed by markers on independent DNA fragments.
Fig. 1. Model of natural transformation. 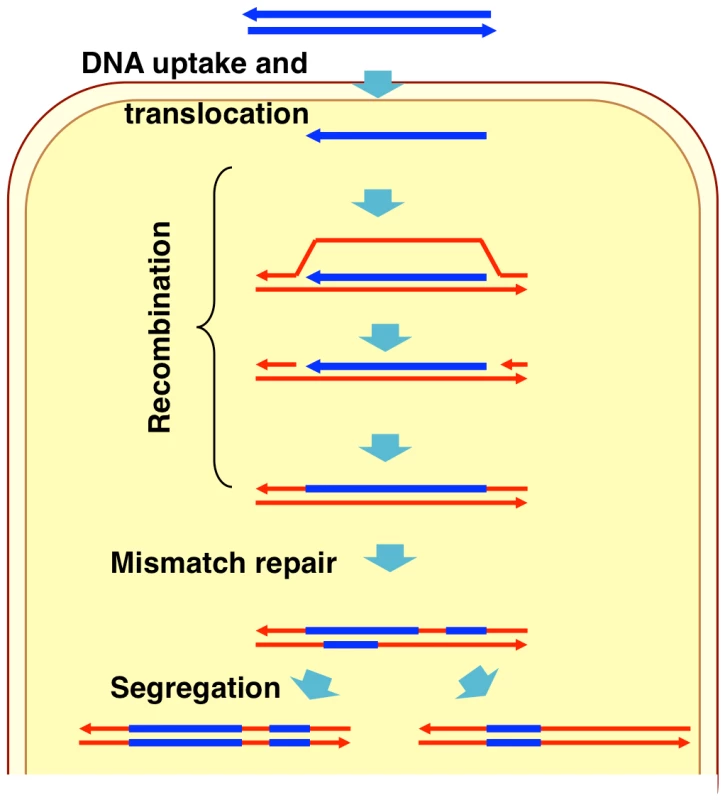
During natural transformation, the extent to which incoming donor DNAs replace segments of recipient chromosomes is limited by the extent and type of sequence differences between the two, as is the case with other pathways that depend on homologous recombination [19]–[20]. Higher sequence identity between donor DNA and recipient chromosome increases transformation efficiency, while transformation by insertions and deletions is less efficient and requires flanking sequence homology [21]–[23]. The heteroduplex DNA created by strand exchange may be subsequently corrected by mismatch repair (to either a donor or recipient allele), or the uncorrected strands may segregate into daughter cells after DNA replication (Figure 1) [24]–[26].
The genomes of independent isolates of many bacterial species differ in two ways [27]–[30]. First, the 80–95% of two isolates' genome sequences that can be readily aligned differ at about 1–5% of bases. Second, the remaining 5–20% of unalignable DNA consists of structural variation resulting from past insertions, deletions, and more complex events. The finding that species show such high variation in gene content has led to a ‘supragenome hypothesis’, under which non-essential loci are frequently exchanged between lineages by transformation, potentially enabling rapid adaptation to varying conditions [29]–[31].
Natural genetic variation between bacterial strains has previously been used to characterize transformation at specific selected loci [18], [32]–[34], but no transformant has been genotyped across the entire chromosome. To investigate the factors that either promote or constrain the movement of genetic variation between otherwise clonal lineages of bacterial pathogens, we are using the well-characterized natural transformation system of Haemophilus influenzae, combining inexpensive sequencing technology with the availability of complete genome sequences of divergent strains. Here we report a high coverage sequence analysis of four H. influenzae genomes derived by natural transformation of a recipient strain with donor DNA of another strain differing at ∼40,000 genetic markers (∼2.5% of aligned positions and ∼300 indels and other rearrangements).
Results
Preliminary genetic analysis
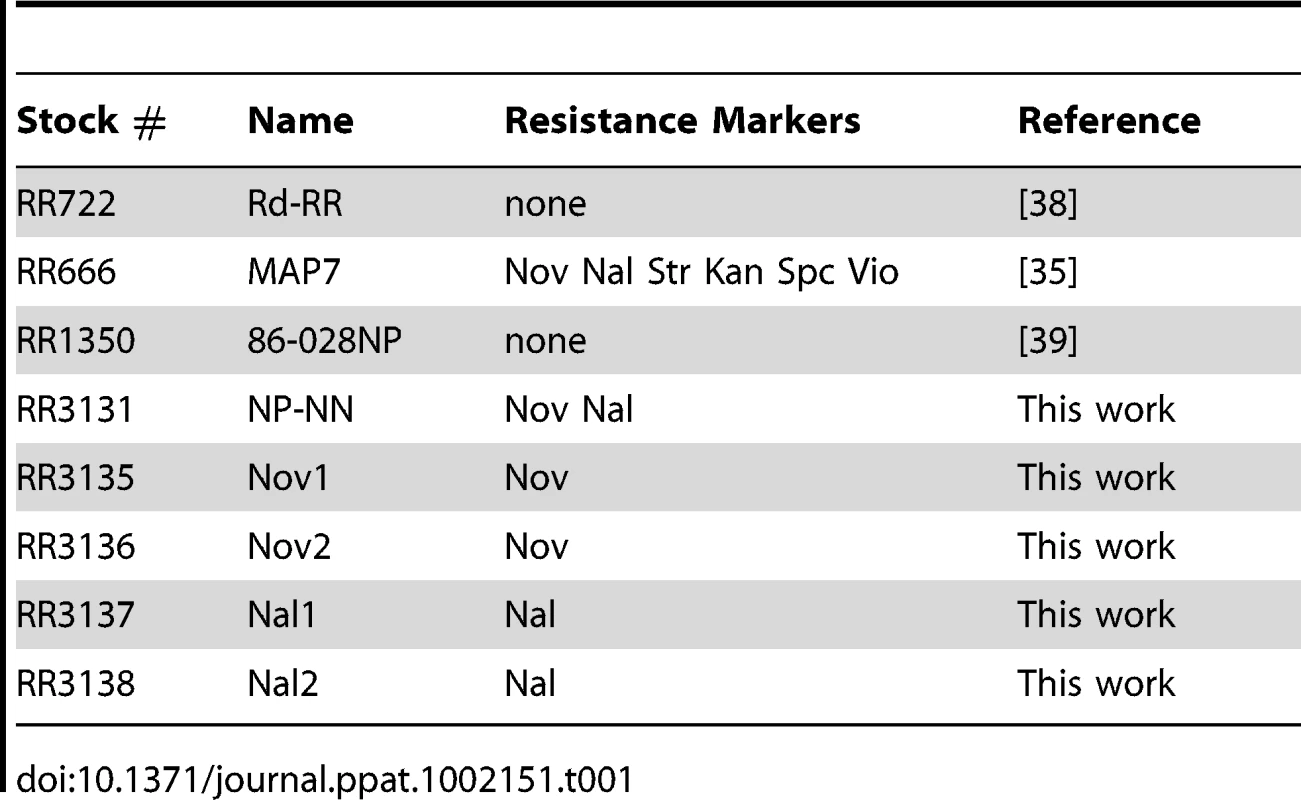
Competent cultures of H. influenzae are reported to contain many non-competent cells [18]. To avoid wastefully sequencing clones derived from non-competent cells, we chose for sequencing clones that had acquired a phenotypic marker in a standard transformation experiment. Before doing this, we confirmed that selection for transformation at one locus does not compromise transformation at distant loci, using donor DNA purified from the multiply marked Rd strain MAP7 [35] to transform our standard laboratory Rd strain Rd-RR (strains used are listed in Table 1). Figures 2A and B show that the relative transformation frequencies at five loci were not altered by selection for a distant marker, and Figure 2C shows that the transformation frequency of a nalidixic acid resistance marker (NalR) did not vary when any of 4 distant markers is used for selection of transformed clones.
Fig. 2. Natural transformation of H. influenzae. 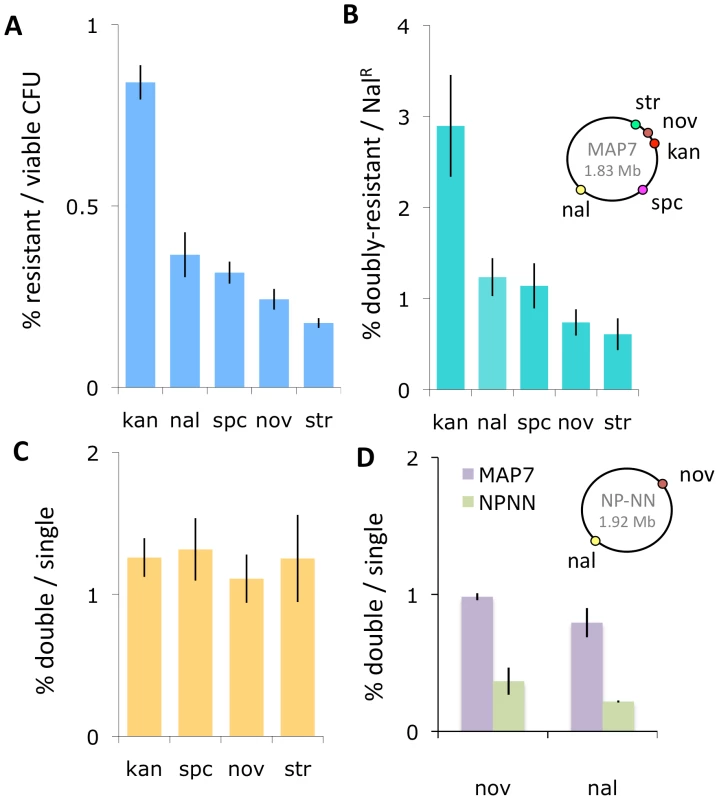
The inset chromosome maps show the positions of the antibiotic resistance markers in the two donor strains. (A) Transformants per viable cell at five markers using MAP7 donor DNA. (B) Double-selected transformants per single-selected transformant using MAP7 donor DNA. For KanR, SpcR, NovR, and StrR, the selection was for the distant NalR marker. For NalR, the distant selection was at each of the other 4 markers. (C) NalR transformants per selected transformant using MAP7 donor. (D) Transformation of MAP7 vs. NP-NN donor DNA markers into Rd-RR per competent cell. Accurate mapping of recombination events depends on the density and distribution of sequence differences between the donor and recipient genomes. We chose the clinical isolate 86-028NP as the source of donor DNA because, like Rd, it has been completely sequenced and annotated, and because its genome differs from Rd at about 2.4% of their alignable bases, typical for a pair of H. influenzae isolates [30], [36]. To provide phenotypic markers in 86-028NP for transformant selection, we introduced NovR (novobiocin resistance) and NalR alleles from MAP7 by transformation with short PCR fragments.
We used this doubly marked strain (NP-NN) to investigate how strongly the sequence divergence between NP-NN and Rd-RR limits transformation. Figure 2D shows that the sequence divergence of the NP-NN donor DNA at or near the NovR and NalR alleles reduced transformation efficiency into recipient chromosomes by ∼3-fold, compared to Rd-derived MAP7 donor DNA.
Genomic DNA sequencing of transformed clones and controls
To identify recombination events in clones transformed with chromosomal DNA from a divergent strain, we selected four Rd-RR clones that had been transformed with NP-NN chromosomal DNA to either a NovR (transformants Nov1 and Nov2) or a NalR (transformants Nal1 and Nal2) phenotype. Acquisition and processing of sequence data for these clones is described in detail in the Materials and Methods. Briefly, the Illumina GA2 sequencer [37] was used to obtain a high yield of short paired-end sequence reads from genomic DNA of these four transformants (two individually and all four as a pool), and also to individually resequence the genomes of the Rd-RR recipient and NP-NN donor strains as controls (Table 1 and Table S1). Each set of paired-end reads was separately aligned to each of the two reference genomes (Rd and 86-028NP [38]-[39]) using the alignment software BWA [40], and pileups and consensus base calls at each reference position were generated using the SamTools software package [41]. Since these genomes are <2 Mb, genome coverage per set of reads was high, with median read depths of ∼400 per mapped reference position (Table S2 and S3 and Figure S1).
For each set of reads, the base corresponding to each position in each of the two reference genomes was classified as: (a) the same as the reference, (b) different from the reference, (c) ambiguous, or (d) unmapped (summarized in Tables 2 and 3). Ambiguous positions were those where the specific base at a position could not be confidently identified, likely due to sequencing or read-mapping artifacts (see Materials and Methods). Positions were classed as unmapped if none of the reads aligned, either because the positions were absent from that DNA or unmapped for other reasons.
Tab. 2. Summary of read mapping to Rd (KW20). 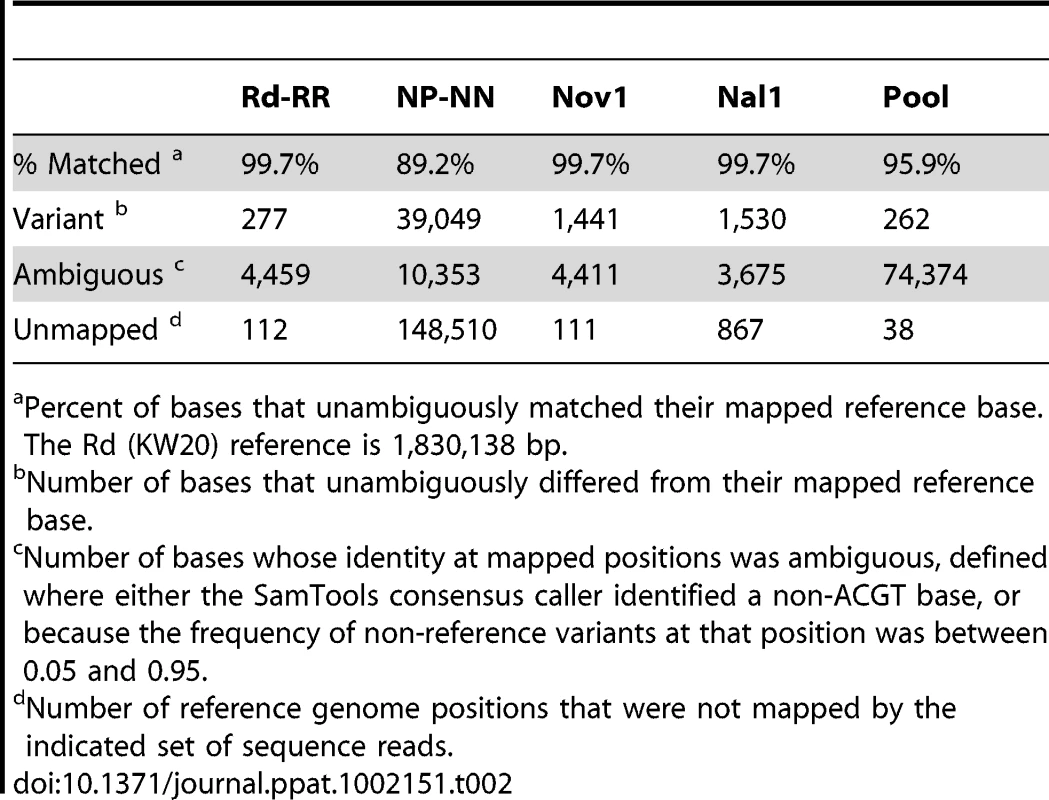
Percent of bases that unambiguously matched their mapped reference base. The Rd (KW20) reference is 1,830,138 bp. Tab. 3. Summary of read mapping to 86-028NP. 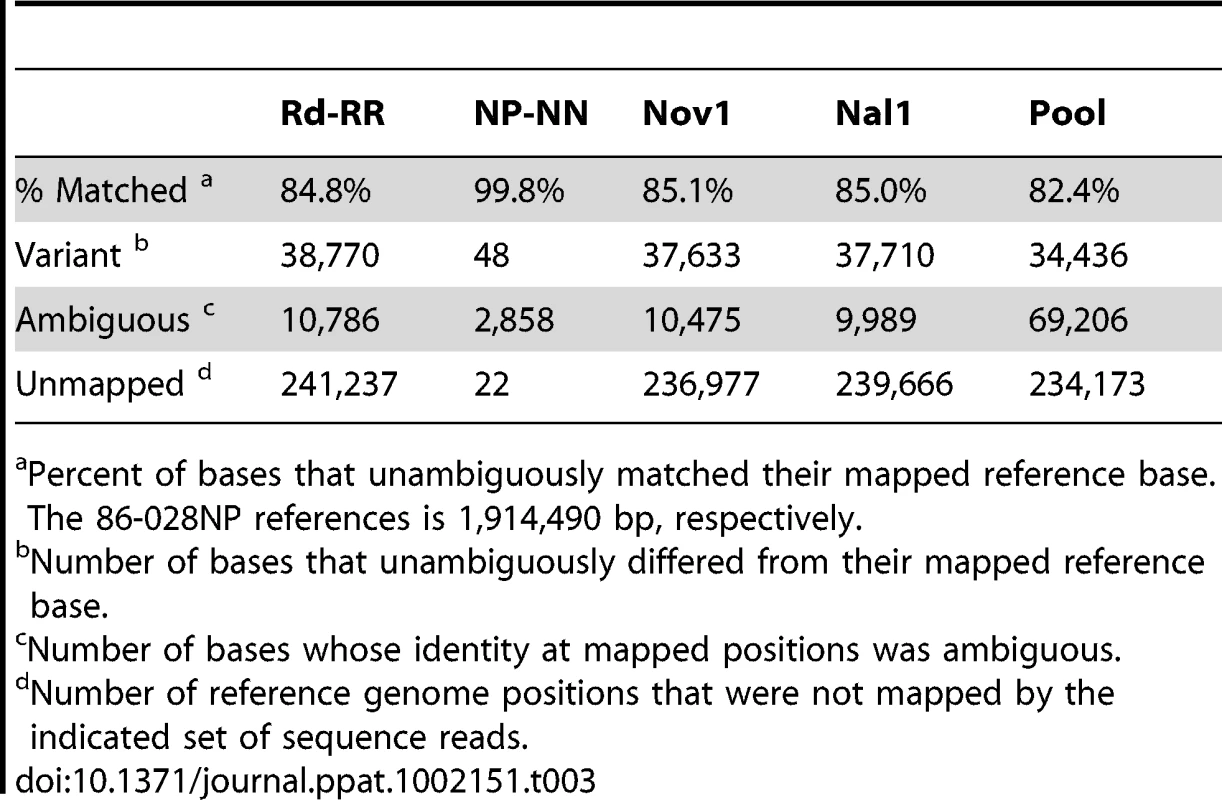
Percent of bases that unambiguously matched their mapped reference base. The 86-028NP references is 1,914,490 bp, respectively. Control analyses of donor and recipient re-sequencing data
Before transformant data sets were analyzed to identify recombination events, the control sequence reads were used to (1) identify differences between the published reference genome sequences and the genomes of the donor and recipient strains we used; (2) confirm the reliability of single-nucleotide variants (SNVs) for distinguishing between donor and recipient sequences; and (3) identify positions that were systematically error-prone, ambiguous, or unmapped in the alignment of reads to references. The three steps (A, B and C) of these control analyses are illustrated in Figure 3.
Fig. 3. Control alignments. 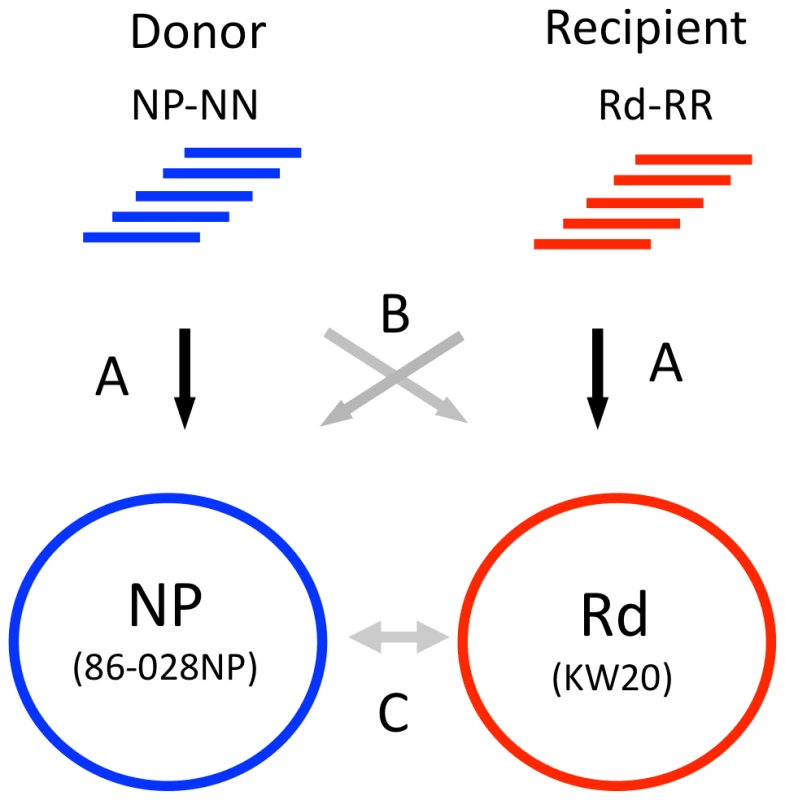
Step A. Self-alignments: Identifies intra-strain variants and ambiguous positions. Step B. Reciprocal alignments: Identifies putative SNVs and indels between donor and recipient. Step C. Reference alignments: Whole-genome alignment of the 86-028NP and Rd reference sequences identifies a set of SNVs for cross-validation with the self- and reciprocal-alignments. Step A. Self-alignment of donor and recipient reads to their own references
Aligning the sequence reads from the recipient and donor strains to their corresponding reference genomes provided two controls. First, it showed that our sequencing approach was comprehensive and accurate: at >98% of the positions the aligned reads agreed with the reference with <1% error (Tables 2 and 3, and Tables S4 and S5). Although the Rd-RR reads disagreed with the Rd reference at several hundred positions, many of these appear to be errors in the 1995 reference sequence. Second, these self-alignments allowed other potential artifacts to be accounted for by identifying (i) sequence differences between the strain and their respective references (Table 4), (ii) several thousand positions where sequencing results were ambiguous (Figure S2), and (iii) a small number of unmapped positions at apparent deletions (Tables 2 and 3).
Tab. 4. Correction for variants detected by self-alignment (Steps A and C). 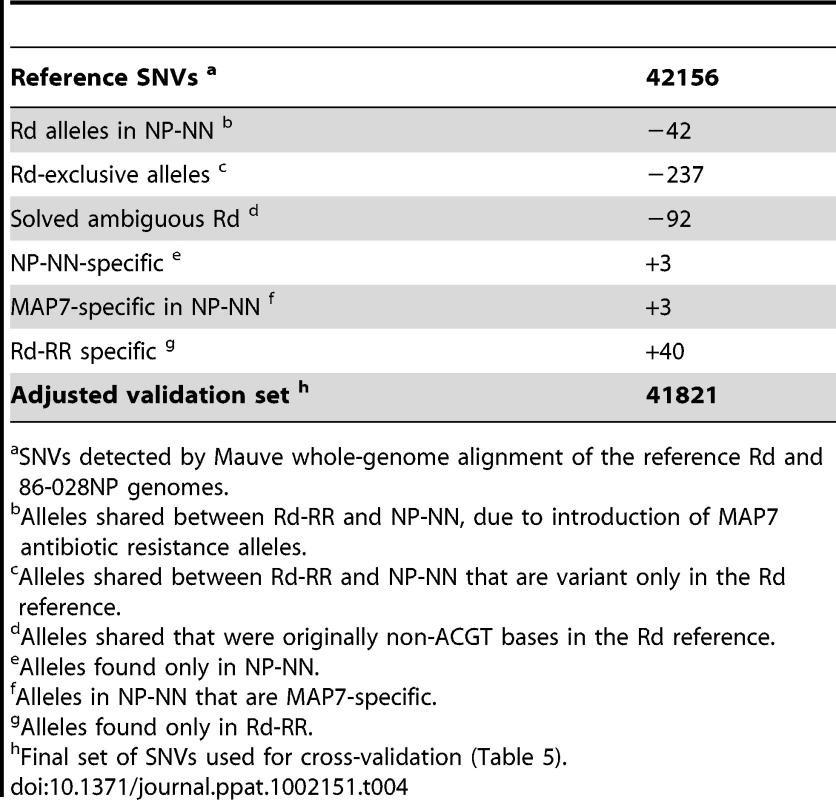
SNVs detected by Mauve whole-genome alignment of the reference Rd and 86-028NP genomes. Tab. 5. Cross-validation of SNVs detected by reciprocal alignment (Steps B and C). 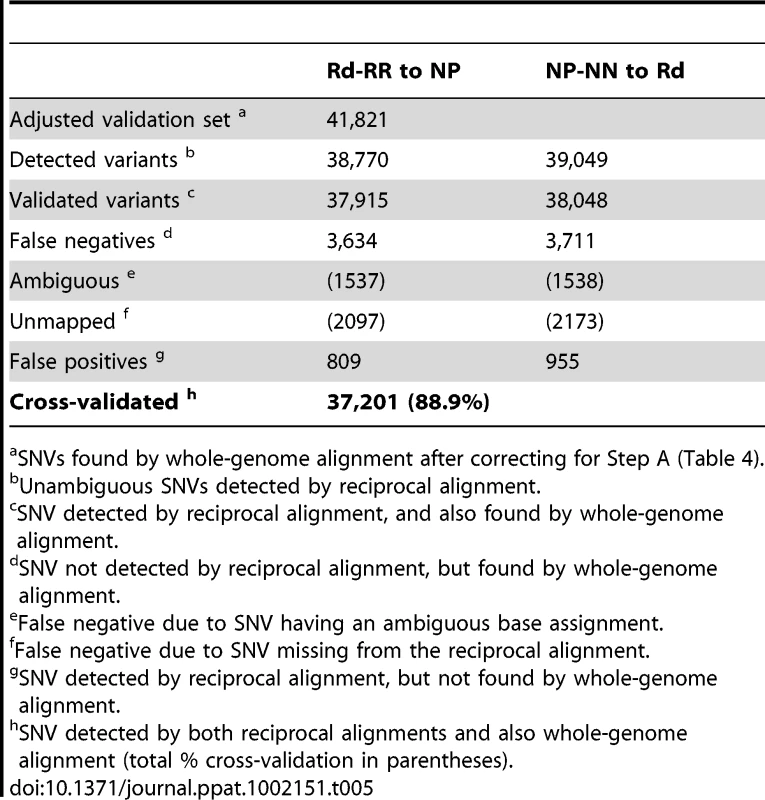
SNVs found by whole-genome alignment after correcting for Step A (Table 4). Step B. Reciprocal alignment of donor and recipient reads
We next evaluated the alignment of donor and recipient reads to the alternative reference genomes (Rd-RR aligned to 86-028NP, and NP-NN aligned to Rd; Tables 2 and 3). These alignments served to identify variant, ambiguous and unmapped positions arising when reads are aligned to a reference with substantial sequence divergence. The ∼40,000 SNVs detected by the two reciprocal alignments were roughly consistent with the whole-genome alignment of the Rd and 86-028NP reference sequences described below (Tables 2 and 3, and Tables S6–S8).
Many of the positions identified as ambiguous in the self-alignments were also ambiguous in the reciprocal-alignments (44% and 58% overlap), suggesting that these positions suffer from systematic and persistent sequencing or mapping artifacts (example in Figure S3A). However, more than twice as many positions were classified as ambiguous in reciprocal alignments than in self-alignments (Tables 2 and 3, and Figure S2). Many of these were due to sequence reads that consistently misaligned at regions of high divergence between donor and recipient (example in Figure S3B), causing lower read depths and higher variant frequencies at these positions than in self-alignments (Figure S4).
Because of the substantial number of indels and other rearrangements between donor and recipient (Table S8), many reference positions were not mapped by reciprocal alignment (Tables 2 and 3, and Figure S5). 12.6% of 86-028NP positions had no recipient reads mapped, and 8.1% of Rd positions had no donor reads mapped. Because of the high sequence coverage of these genomes, these unmapped positions served as markers to identify structural variation between the two (see below).
Step C. Cross-validation of SNVs between donor and recipient
Most of the mapped SNVs found by reciprocal alignment were expected to identify genuine polymorphisms, but others were mistakes generated by read mapping artifacts. To independently validate SNVs, we aligned the two reference genomes using the Mauve whole-genome alignment software [42] (Tables S6–S8). After correcting for the variation detected between the strains and their references (Step A, Table 4), we used this set of SNVs to cross-validate the sequence variants identified by the reciprocal alignments (Step B). This gave a final set of 37,201 positions for which the same distinct variants were detected in both the alignments of control reads to their reciprocal references (Step B), and the alignments of the two references to each other (Step C). The positions of these cross-validated SNVs were used to identify the donor - and recipient-specific alleles in transformed clones (see below); they captured 88.9% of the total SNVs identified by whole-genome alignment, with a mean spacing of 52 bp (median 15 bp). Exclusion of SNVs that failed this cross-validation test modestly reduced the number of markers available for recombination analysis, but it eliminated artifacts that would otherwise have been interpreted as novel alleles (new mutations) and as interruptions of recombination tracts (Table 5).
Recombination tracts in two individually sequenced transformed chromosomes
To determine the locations of donor alleles in transformant clones Nov1 and Nal1, sequence reads were aligned to both reference genomes and each cross-validated SNV position was classified as donor-specific, recipient-specific, or ambiguous. The two clones contained 1,133 and 1,213 donor-specific SNVs, while nearly all of the remaining cross-validated positions contained recipient-specific SNVs (Figure 4A and Table 6). As expected for the products of homologous recombination, donor-specific alleles in the transformed clones were found in contiguous runs, which we term donor segments (Figure 4A, Figure 5, and Figure S7).
Fig. 4. Identifying transformation events genome-wide. 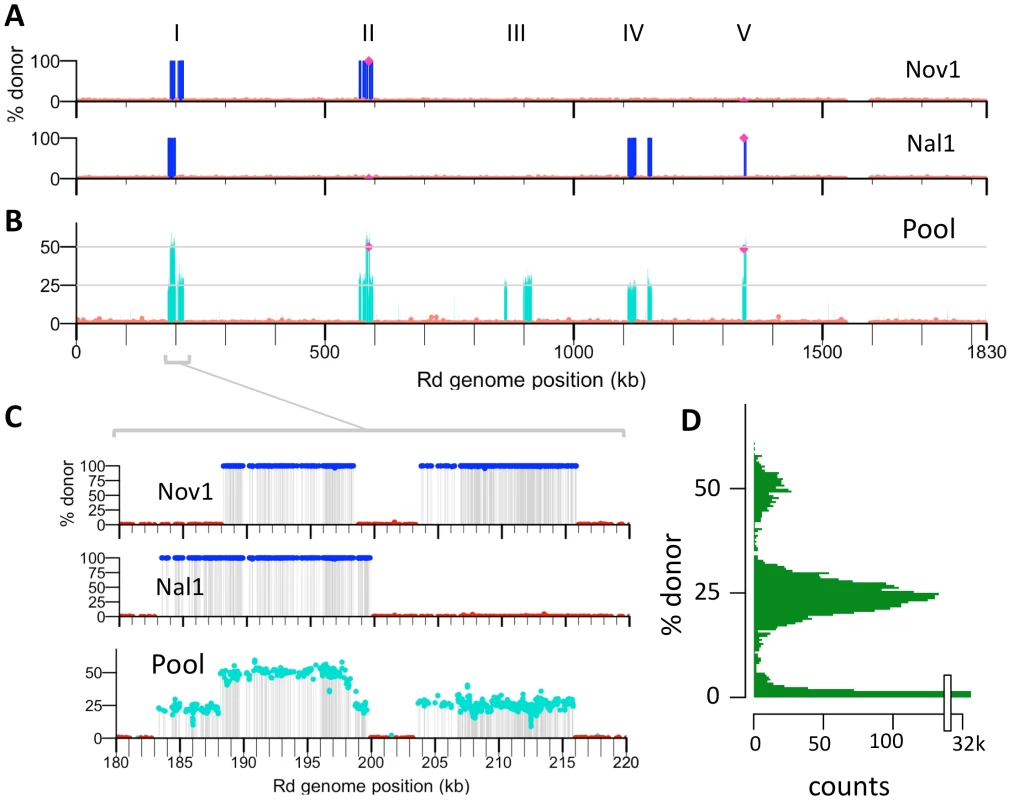
(A) Donor allele frequency at cross-validated SNVs in the Nov1 and Nal1 transformants plotted against recipient genome position. Donor SNVs are blue and recipient SNVs are red. Roman numerals indicate intervals where transformation was detected in either A or B. The selected NovR and NalR alleles in intervals II and V are purple. (B) Donor allele frequency at cross-validated SNV positions in the pool of four transformants (Nov1, Nov2, Nal1, and Nal2) plotted against recipient genome position. Coloring as in A, with turquoise used for intermediate donor allele frequencies. (C) Expanded view of interval I, as in A and B. All five intervals are shown in Figure S7. (D) Histogram of the donor allele frequency at cross-validated SNV positions in the pool of four transformants mapped to the Rd reference. Fig. 5. Recombination events detected in four transformants. 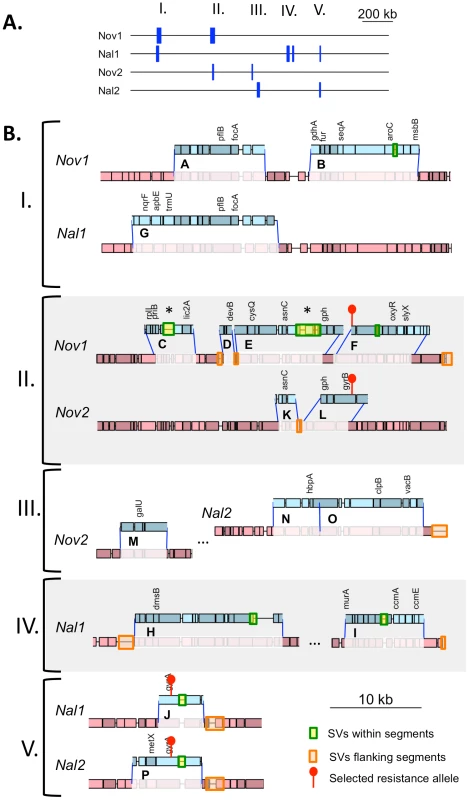
(A) Summary of donor segments in each transformant are illustrated as blue bars. (B) Detailed illustrations of recombination tracts in each interval showing gene annotations. Donor segments are shown in blue, and recipient sequences are shown in red. Pale shading indicates genes on the plus strand and dark shading indicates genes on the minus strand. Dark blue lines joining donor and recipient segments indicate recombination breakpoints. The key in the lower right shows additional annotation of the selected antibiotic resistance alleles and the locations of structural variation between the genomes. Exact donor segment breakpoints and additional data on each segment are provided in Table S9 and Table S10 for the Rd and 86-028NP genome coordinates, respectively. Scale bars are shown for both (A) and (B). Tab. 6. Summary of transforming donor DNA in 4 recombinants. 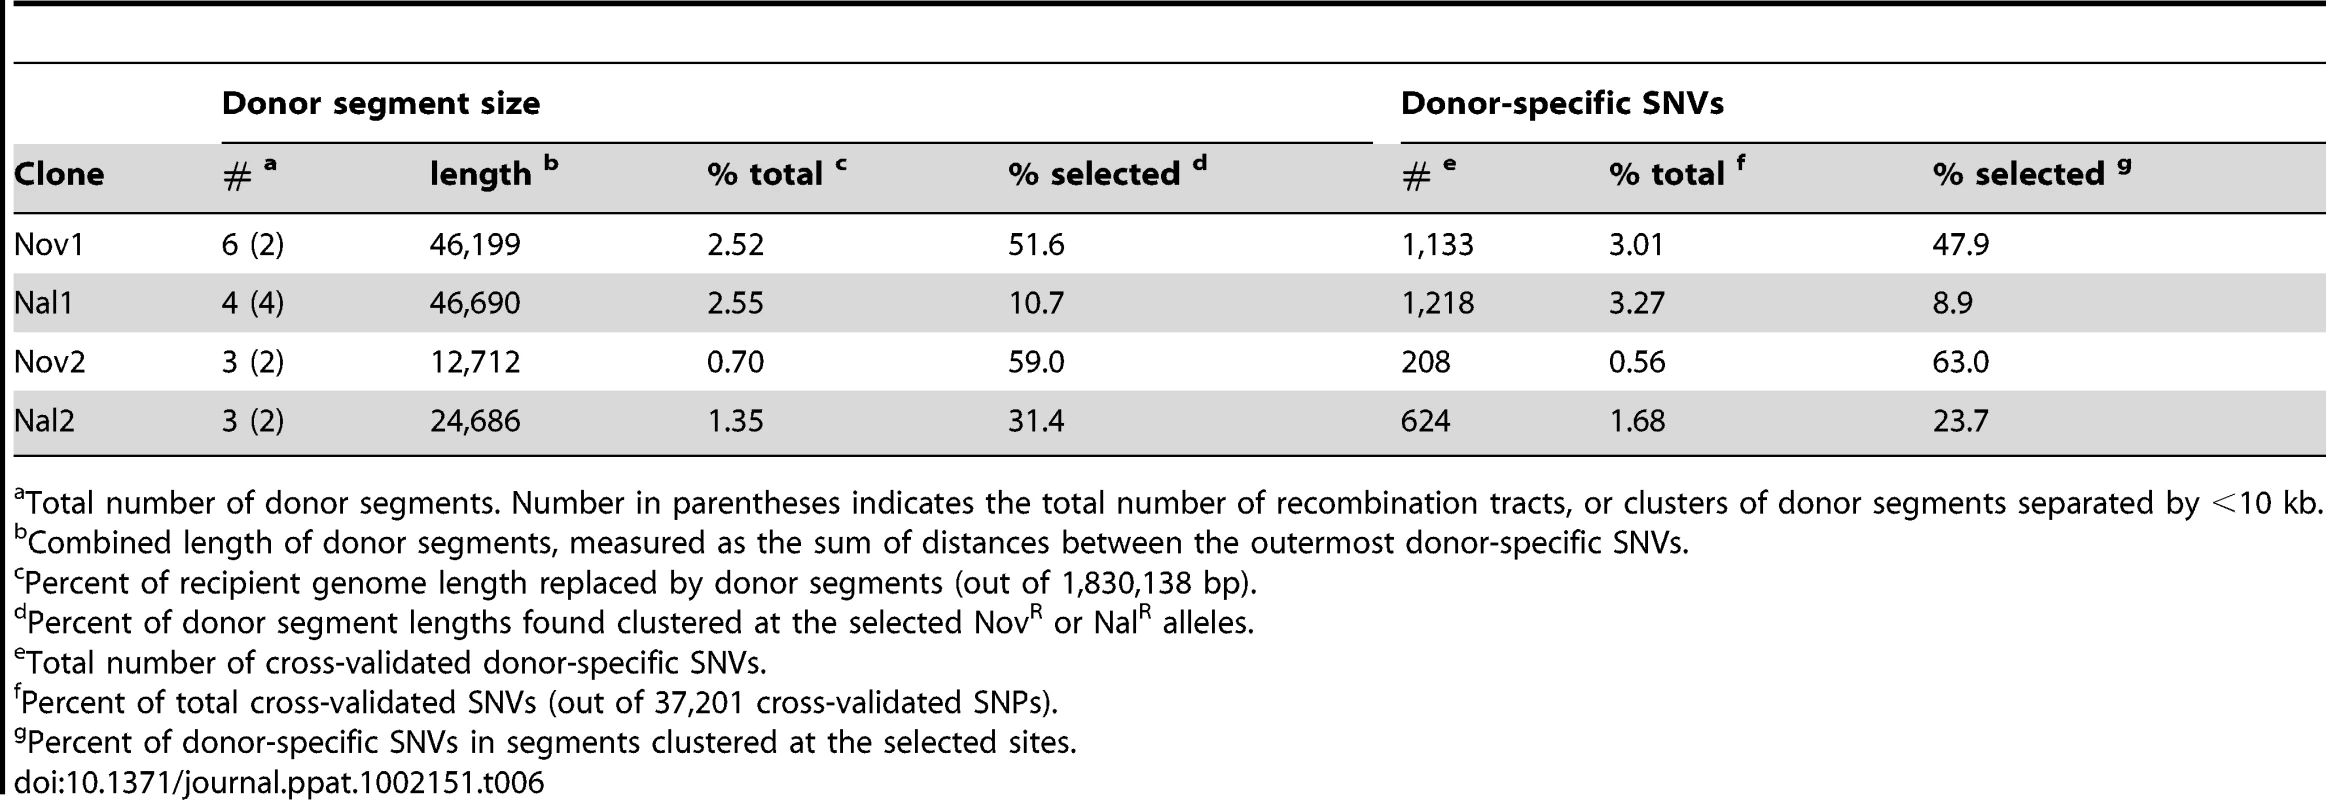
Total number of donor segments. Number in parentheses indicates the total number of recombination tracts, or clusters of donor segments separated by <10 kb. The lengths of the 10 donor segments in the Nov1 and Nal1 transformants ranged from 1.2 kb to 16.6 kb (Figure S5 and Figure S6). As expected, transformant Nov1 had a donor segment spanning the NovR allele at gyrB (Segment F), and transformant Nal1 had a donor segment spanning the NalR allele at gyrA (Segment L). Nov1 contained five additional donor segments, two separated by only 4.5 kb and the other three adjacent to the selected Segment F. Nal1 contained three other widely spaced segments in addition to the selected Segment L; one of these overlapped one of those in the Nov1 transformant by 10.9 kb (Segments A and G, shown expanded in Figure 4C and Figure 5). Additional analysis of these segments is presented below.
Recombination tracts in a pool of four transformed chromosomes
The ∼400-fold coverage obtained per sequencing lane was much higher than needed, so we tested whether sequencing a pool of genomic DNA from four transformants could accurately identify donor segments without compromising the resolution of recombination breakpoints. Equal amounts of four genomic DNAs were pooled and sequenced (two transformant clones, Nov2 and Nal2, and as internal controls, the individually sequenced clones Nov1 and Nal1). The reads from this pool were aligned to the donor and recipient references, and the allele frequencies at each position for each reference were calculated (Tables 2 and 3). In this analysis donor alleles acquired by transformation of one clone will be given ‘ambiguous’ base assignments, with donor alleles at 25%. These are seen in the allele-frequency histogram in Figure 4D as the large peak centered on 25%; the smaller peak centered on 50% reflects the donor alleles present in two clones.
When plotted against chromosome coordinate, the recombination breakpoints of the donor segments in the pool are evident as abrupt transitions of donor-allele frequency (Figure 4 and Figure S7). For this pool of 4 genomes, donor segments are seen as intervals of contiguous ∼25% or 50% donor allele frequency. As expected, overlapping segments were seen at the selected NovR and NalR alleles, with the NovR allele in the Nov1 and Nov2 transformants and the NalR allele in the Nal1 and Nal2 transformants (purple diamonds in Figures 4 and Figure S7). The previously identified overlapping segments A and G were also detected (in Nov1 and Nal1, respectively). The pool contained three more unselected donor segments specific to either Nov2 or Nal2. Allele-specific PCR was performed to determine which of the two clones these three donor segments were found; Segment M was in Nov2, while Segments N and O were in Nal2.
While the pooling approach was successful at precisely identifying recombination breakpoints and overlaps between donor segments in the four different clones, the assignment of endpoints to overlapping donor segments and to particular recombinant clones required additional information. The increasing availability and decreasing cost of multiplexed sequencing methods will partially circumvent this problem in the future.
Properties of donor segments
In total, we identified 16 donor segments across the four transformants, spanning a total of ∼130 kb and containing 3,183 donor-specific SNVs (Table 6 and Tables S9 and S10). This is 7.1% of the Rd genome, or 6.0% if overlaps are only counted once. The 16 donor segments had a mean length of 8.1±4.5 kb, suggesting that transformation of very short DNA fragments is rare (at least with the high molecular weight donor DNA prep we used). The average amount of sequence introduced into each transformed clone (∼1.8%) was consistent with the transformation frequencies of individual selectable markers shown in Figure 2.
Although transformation might be expected to preferentially occur at regions with low sequence divergence, the regions participating in recombination had divergences typical of the whole genome (2.4±0.9% vs 2.3%). A more detailed analysis of sequence divergence in these regions is shown in Figure 6 Notably, the extent of sequence divergence is locally highly variable, ranging from less than 1% to more than 15% within only a few kilobases. However this variation did not appear to affect recombination, since all donor segments contained regions of both high and low divergence, and there were no obvious correlations between recombination breakpoints and extremes of divergence. Notably, recombination was not interrupted even when divergence was as high as 20% (light green line, 250 bp sliding windows).
Fig. 6. Sliding window analysis of % nucleotide divergence across the five intervals containing recombination tracts, I to V. 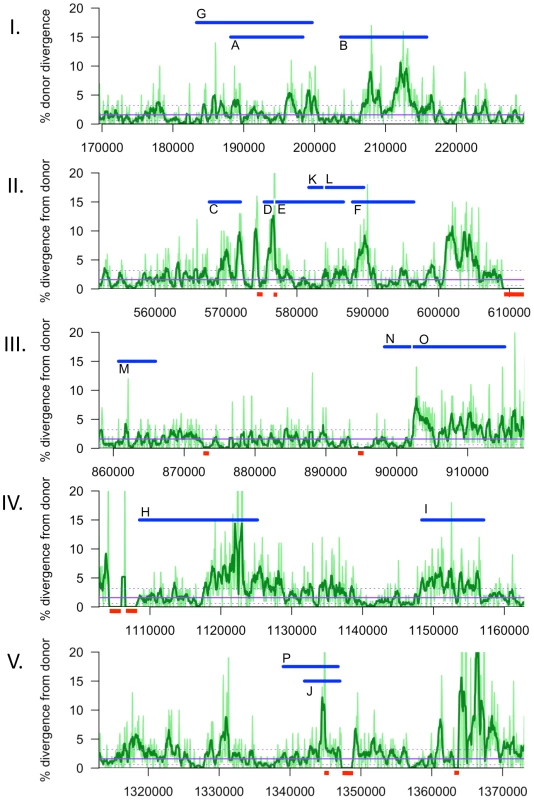
Donor segments are shown as horizontal blue bars. Dark and light green lines indicate 1 kb and 250 bp window sizes, respectively (both with a step size of 100 bp). The solid purple line shows the median genome-wide divergence, and the dotted purple lines shows the 25% and 75% quartiles. Red bars below the axis indicate positions of large recipient-specific sequences (deletions in the donor), where the % divergence is artificially reduced to 0%. The spacing between Segments D/E, K/L, and N/O are not to scale, so that the position of putative restoration repair are clearly visible. The adjacent locations of many donor segments (Figure 5) likely resulted from disruption of longer transforming DNA fragments rather than independent events. For example the 6 donor segments in Nov1 were found in 2 clusters of 22 and 24 kb. Across all four clones, there were 6 instances of apparent disruptions within longer “recombination tracts”, where adjacent donor segments were separated by relatively short intervals (<10 kb) of recipient-specific alleles. The longest is the 5.3 kb interval separating segments A and B in transformant Nov1, and the shortest is the single recipient SNV dividing Segments N and O in transformant Nal2 (Tables S9 and S10). When the 16 donor segments were treated as 10 clusters, the mean recombination tract length was 14.2±8.8 kb.
Recombination not only brought thousands of donor-specific SNVs into the transformant genomes but introduced several donor-specific insertions and deletions (Table S11) resulting in some donor segments being different lengths than the recipient segments they replaced (Figure 5, Tables S9 and S10). In particular, strain Nov1 received two large donor-specific insertions (1.2 and 2.7 kb) as parts of Segments C and E (Figure 5 asterisks and Figure 7A). These were confirmed by read depth analysis along the two reference sequences (Figure S8).
Fig. 7. Transformation at structural variation. 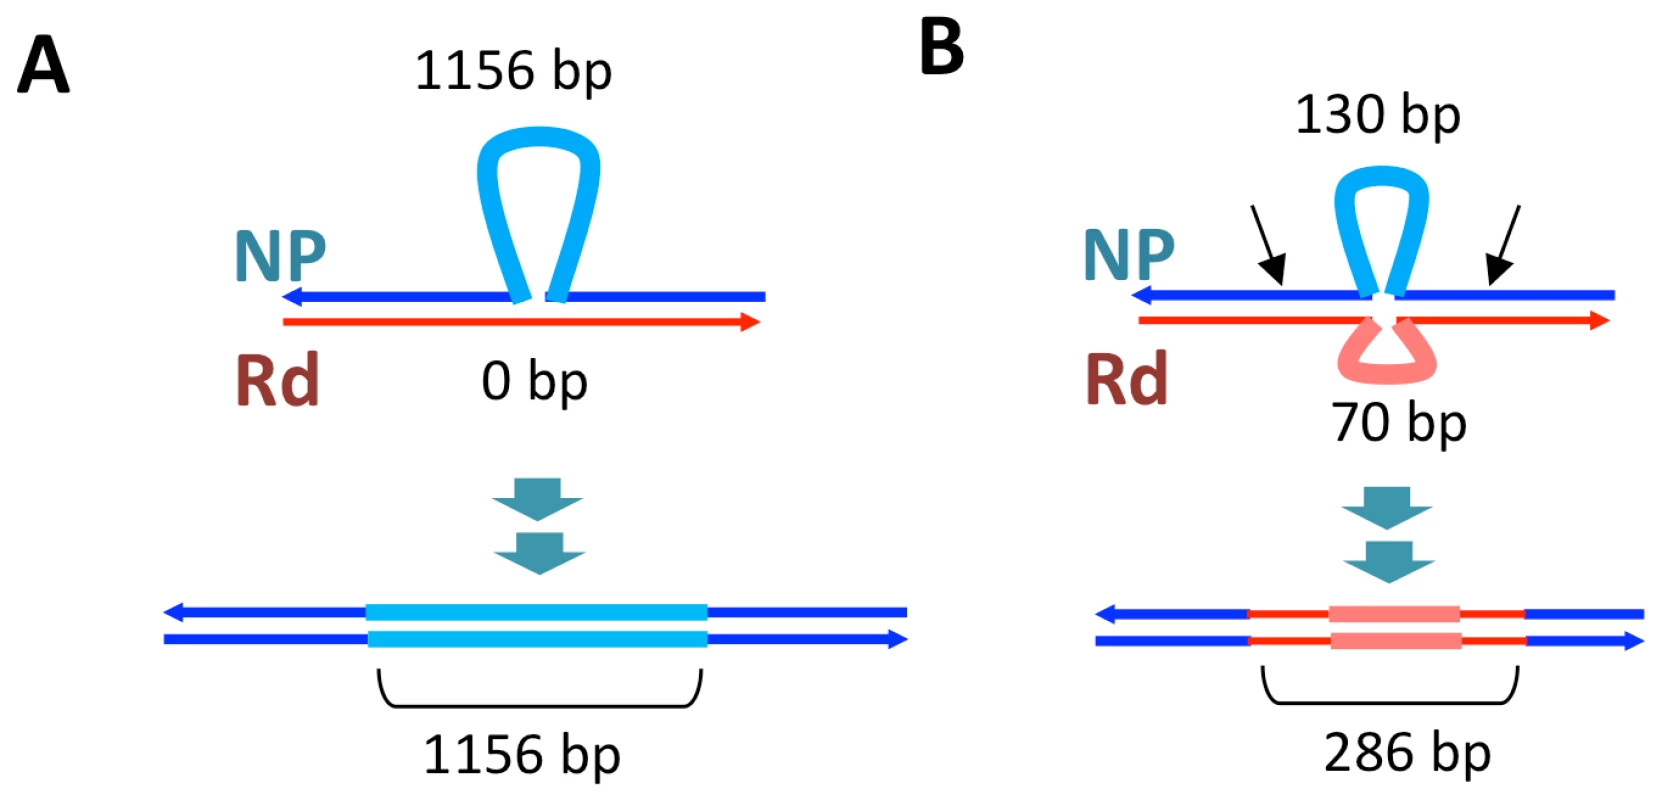
The top drawings illustrate the inferred joint molecule intermediates that yielded the recombination products illustrated in the bottom drawings. In (A) the 1.2 kb insertion in Segment C is shown, and in (B) the putative restoration repair at an insertional deletion disrupting Segments D and E is shown. Thin dark lines show aligned sequence (blue and red for donor and recipient sequences, respectively). Thick pale lines show unaligned indel differences between the genomes. For B, black arrows show putative cut sites by a mismatch correction endonuclease. On the other hand, indels and other structural variants between the donor and recipient chromosomes appear to have blocked progression of strand exchange in several instances (Figure 5 and Table S12). Of the 32 donor segment breakpoints, 12 are within 5 kb of indel or other structural variation; 6 of these are within 3 of the 6 apparent disruptions described above and thus are likely sites of restoration repair. Indeed, one structural variant gave different outcomes in different recombinants: the 2.7 kb donor insertion allele that was acquired by strain Nov1 was not inserted into strain Nov2, but instead a short segment of recipient sequence interrupts donor segments K and L. Figure 7B illustrates another example of putative restoration repair at an insertional deletion difference between the donor and recipient, as indicated by the interruption between Segments D and E by the recipient insertion allele along with 26 flanking recipient SNVs (Figure S8).
Discussion
The plummeting cost of deep sequencing allowed us to characterize the genome-wide consequences of natural transformation, but the ability of this analysis to account for artefacts depended on our high-coverage control sequencing of the donor and recipient genomes. Aligning these control reads to the two reference genome sequences revealed many positions prone to ambiguity or false-positive SNV calls. In the absence of these controls, such artifacts would have mistakenly been interpreted as recombination-induced mutations, since mapping reads to divergent references generated these erroneous variants, while mapping reads to highly similar references did not. The frequency of these artifacts depends not only on nucleotide divergence, but also on the spectrum of structural variation and the complexity of the genome. Analysis of such high-coverage control datasets will be essential for reference-guided assembly approaches that use data with lower coverage, such as that obtained using inexpensive multiplexing methods.
H. influenzae's normal environment is the mucosal layer of the human respiratory tract, which contains abundant DNA, much of it high molecular weight like that we used [43]. The broad spectrum of sequence differences between donor and recipient used in these experiments is typical of the natural genetic variation between H. influenzae strains and present in the human host [44]-[45]. However most of the DNA in respiratory mucosa is from human cells and, although bacterial DNA is known to be abundant in biofilms, its fragment sizes and composition in mucus are not known. The short DNA fragments also present in mucus may be taken up more efficiently than long fragments, since H. influenzae cells take up more fragments when fragments are short (40 fragments of 120 bp) [46]–[47], but the implications for transformation are not clear. Competent cells incubated with short donor DNAs might acquire more donor segments, but short fragments will also be more severely affected by the exonucleolytic degradation that accompanies translocation into the cytoplasm. H. influenzae's preference for DNA containing uptake sequences (see below) will also affect both the sources and sizes of the fragments cells take up.
Analysis of recombination tracts showed that the four transformants had replaced ∼1–3% of their genomes with 3–6 segments of donor DNA ranging in length from 1.2 to 16.6 kb. The number of donor segments per transformant agrees well with the ∼3.3 fragments found to be taken up per cell in laboratory experiments using long 14.4 kb fragments [47]. The lengths of the donor segments we found in H. influenzae are similar to those reported from analysis of naturally occurring recombination tracts observed in Neisseria meningitidis at specific loci[48], but contrast with the shorter tracts seen for Helicobacter pylori (∼0.5–3.5 kb) in experiments using DNAs of similar divergence to ours [33]–[34], [49]. The difference suggests that population genetic models for measuring recombination in nature will require incorporating species-specific estimates of the distribution of recombination tract lengths [15].
The lengths of donor segment found in recombinant chromosomes may underestimate the original lengths of DNA fragments participating in uptake and recombination, because clustering of donor segments suggests that longer incoming DNA fragments are often disrupted before transformation is complete. Similar clustering of donor segments was seen when recombination at a single locus was examined in Helicobacter pylori [33]–[34]. The clustering of H. influenzae donor segments is unlikely to be due to chance, because of the small number of donor segments in each transformant. More probable explanations are that (1) cytosolic or translocation endonucleases degrade incoming DNAs prior to strand exchange, or (2) sequence heterology blocks progression of strand exchange, with the heterologous sequences trimmed away by nucleases.
Intracellular cleavage of incoming DNA by restriction enzymes has been proposed for competent Helicobacter pylori [49], but this is problematic because, in both H. pylori and H. influenzae, only single DNA strands are thought to enter the cytoplasm [50]–[51]. Although McKane and Milkman have shown that restriction can create clustered recombination tracts in E. coli transduction experiments [52], the single strands brought into the cytoplasm by transformation are not normally substrates for restriction enzymes, and donor strands recombined into the chromosome will be protected from restriction by the methylation of the base-paired recipient strands. The effect of restriction in H. pylori may instead be due to the accumulation of extracellular restriction enzymes during the long transformation protocol [34]. Similar accumulation might be a transformation-limiting factor for many species that normally live in mixed-species biofilms, whenever environmental DNA encounters restriction enzymes derived from other strains or species.
We found no evidence that recombination preferentially occurred in regions of lower nucleotide divergence than the genome-wide average. Instead, sequence divergence varied on a scale much shorter than the donor segments, with most segments spanning local regions of both high and low divergence (Figure 6). Although strand exchange of short fragments is known to be dramatically inhibited by sequence divergence of >10% [19]–[20], most donor segments contained one or more regions with >15% divergence. This suggests that, although strand exchange may initiate between regions of high sequence identity, it readily extends into and through regions with many mismatches. Measuring the effect of divergence on recombination break points and interruptions will require sequencing many more recombinants.
Effects of structural variation on recombination were evident even with this small sample size, as heterologous sequences were much more common at donor-segment breakpoints than expected from their abundance in the recombining genomes, e.g. between the clustered segments C and D, D and E, and K and L (Figure 5 and 6B). This is consistent with previous genetic experiments showing that insertions and deletions transform at much lower rates than do substitutions [22] and may be due to inhibition of strand exchange or to subsequent excision of heteroduplex from recombination intermediates by a mismatch correction mechanism. However, at other sites the donor versions of structural variation were acquired as parts of longer donor segments, showing that such accessory loci can indeed readily move by natural transformation.
Other factors could have influenced the transformation events we observed: (1) H. influenzae's strong preference for DNA fragments containing uptake signal sequences (USS) biases transformation to USS-containing fragments [53]–[54]. However USSs are unlikely to have been a factor in these experiments, since they occur at a high density in the genome (∼1/kb) and the donor DNA fragments used typically contained dozens of USSs. (2) Segregation of uncorrected heteroduplex at the first post-transformation cell division could cause the extent of strand replacement in individual competent cells to be underestimated by up to 2-fold (Figure 1). We do not know the extent of heteroduplex correction at these or other independently transforming sites, nor how recombination tracts are distributed between the two strands of the originally transformed chromosome. Although the relatively short putative restoration repair events observed in this study might suggest that heteroduplex correction only act on parts of larger heteroduplex recombination products, other repair events might have completely removed shorter segments of donor DNA.
Because clones chosen for sequencing had acquired one of two antibiotic resistance alleles from the donor, we were able to examine overlapping recombination events at each of these loci, detecting striking differences at the NovR locus. The selection for NovR and NalR also showed that unselected events are common, as 58% of donor alleles were found in segments distant from the selected loci. On the other hand, the 11 kb overlap between the unselected donor segments A and G was unexpected given the transformation frequencies of single markers (Figures 4C and 5), and a sufficiently large dataset might identify a transformation hotspot, as has recently been found in Neisseria meningitidis [55]. The overlapping sequences do not have any obvious distinguishing features: divergence between donor and recipient is typical, no virulence genes have been annotated, and density of USSs is slightly lower than the genome average.
In addition to the selected antibiotic resistance alleles, the recombination events characterized here had the potential to significantly change the cell's biology, both by introducing new genes and by creating new genetic combinations by homologous recombination both between and within genes alleles. In particular, the Segment E insertion contains four donor-specific ORFs, one encoding a predicted transposase, and the Segment C insertion contains the LPS biosynthesis gene lic2C (between infA and ksgA). Each recombinant clone also acquired donor-specific versions of 20–50 shared genes, and these may have altered phenotype both directly and because of new interactions with recipient alleles at unrecombined loci. Recombination breakpoints that were not at structural variation usually fell within genes (Figure 5) and, because of the high level of sequence variation, these are likely to have created novel recombinant alleles potentially with substantial changes to function.
The results presented above considered only four recombinant clones, but continuing advances in DNA sequencing technology and bioinformatics methods will allow characterization of many more recombinants under a variety of experimental conditions and using different donor DNAs. This will help bridge experimental studies of transformation with the population genomic approaches used to detect recombination between bacterial lineages in nature. The comprehensive identification of donor segments in a large set of experimentally transformed clones will also provide a novel resource for the genetic mapping of phenotypes that differ between the donor and recipient strains, such as their dramatic natural variation in transformability [56], as well as natural variation in pathogenesis-related traits like serum-resistance [57]–[58].
Materials and Methods
Culture conditions, competent cell preparations, and DNA purification
Standard protocols were used for growth and manipulation of H. influenzae, preparation and storage of competent cultures, and purification of high molecular weight chromosomal DNA from overnight cultures [35], [59]. Briefly, cells were grown in the rich medium sBHI and made competent by transfer of log-phase cultures to the starvation medium M-IV for 100 minutes before transformation experiments or storage in 15% glycerol at −80°C.
Strains (Table 1)
The H. influenzae recipient strain Rd-RR (RR722) was obtained from H. O. Smith in 1988, and is separated by ∼10 passages (∼500 generations) from the KW20 Rd strain sequenced in 1995 [38] (NCBI Taxonomy ID: 71421). The donor strain NP-NN (RR3131; resistant to novobiocin and nalidixic acid (NovR and NalR)) was derived from the clinical isolate 86-028NP [39] (RR1350, gift of Richard Moxon in 2006, NCBI Taxonomy ID: 281310); it is separated from the sequenced 86-028NP strain by ∼5 passages (∼250 generations). NP-NN was constructed by PCR-mediated transformation of 86-028NP with NovR and NalR amplicons of gyrB and gyrA, respectively, (both caused by point mutations). For the NovR allele of gyrB, a 2.6 kb fragment (Rd coordinates 585,533 to 588,096 bp) was amplified from MAP7 (RR666) chromosomal DNA. For the NalR allele of gyrA, a 2.8 kb fragment (Rd coordinates 1,341,635 to 1,344,397) was amplified.
Transformation experiments
Transformation experiments used 2 µg of chromosomal DNA per 1 ml of M-IV competent culture (∼109 cells) for a final DNA concentration of ∼1 genome equivalent per cell. Cells were incubated with DNA at 37°C for 20 min, diluted 1∶5 into sBHI, and incubated at 37°C for 80 min to allow expression of donor resistance alleles before dilution and plating to sBHI agar ± antibiotics [35]. Experiments were performed in triplicate from frozen aliquots of competent cultures prepared on three separate occasions. No DNA controls were performed in parallel, and antibiotic resistant colonies were not observed (limit of detection typically ∼10−9 resistant colonies/CFU). Cells from defrosted aliquots were pelleted and resuspended in fresh MIV before transformation. Two NovR and two NalR transformant colonies (Nov1, Nov2, Nal1, and Nal2; Table 1) were randomly selected for sequencing from a single experiment that used Rd-RR competent cells and NP-NN chromosomal DNA fragments (size range ∼20–100 kb).
Whole-genome alignment of the reference sequences
The reference sequences for Rd and 86-028NP were compared using the Mauve whole-genome alignment software [42]. The complete genome sequences were aligned twice, once with Rd as the query and once with 86-028NP as the query. SNVs were then extracted using Mauve's “Export SNPs…” function. The few identified SNVs that were inconsistent between the two independent whole-genome alignments were excluded. The two resulting files provided positions of each SNV in each genome, ordered against one or the other reference.
Illumina GA2 sequencing and initial data processing pipeline
Chromosomal DNA was sheared by nebulization, and converted into paired-end sequencing libraries with an insert size of ∼100–300 bp, as previously described [37]. About 10 million paired-end sequences of 42 bases were obtained from each library on individual lanes of an Illumina GA2 flow cell (Table S1). Raw data was processed using Illumina Pipeline Version 1.4, and all paired-end reads that passed standard Illumina quality control filters were used for analysis (i.e. those in the “.sequence.txt” file). The raw sequence reads for each DNA sample (Table S1) were deposited at the NCBI short-read archive under project accession SRP003474.
Aligning sequence reads to the reference
The Rd (KW20) and 86-028NP complete genome sequences (NCBI genome accessions NC_000907 and NC_007416) were each used as references for read alignment, with the BWA algorithm (version 0.5.5) [40] set to highly sensitive alignment parameters (bwa aln -n 8 -o 3 -e 3 -l 20 -R 100000; bwa sampe -a 400 -o 1000000). While this generates some spurious mapping artifacts, it ensures that reads will map to both references when possible, even where there is high divergence.
Processing the read alignments
A combination of two criteria was used to identify differences between sequence reads and their references and to flag positions with ambiguous base identity. The first method used the SamTools (version 1.12a)[41] consensus caller, which either assigns positions a standard A, C, G or T base or tags them as ambiguous. Reference positions missing from the SamTools consensus were treated as unmapped positions presumably within or near deletions. The second method used direct calculation of the frequency of each base at each reference position. This used a Perl script obtained from Galaxy [60] (pileup_parser.pl, parameter settings: 3 9 10 8 40 20 “No” “No” 2) to parse the pileup output from SamTools, and provided the count of each non-reference base call at each position. Parsed pileup files were subsequently analyzed using custom scripts written in the R statistical programming language [61]. Plots including gene maps were made with the assistance of the ‘genoPlotR’ package [62].
-
Control self-alignments. Sequence differences between the Rd-RR and NP-NN strains and their respective reference sequences were identified using the following two criteria: (1) a difference was found by the SamTools consensus caller, and (2) the frequency of the same non-reference variant at that position was greater than 95%. Positions prone to sequencing and read mapping artifacts were flagged as ambiguous when the SamTools tagged a base as ambiguous, the variant frequency was between 5% and 95%, or both.
-
Control reciprocal alignments. Differences between our donor and recipient strains were identified from the reciprocal alignments of Rd-RR reads to the 86-028NP reference genome and of NP-NN reads to the Rd reference genome. SNV positions were considered cross-validated, if both reciprocal alignments and whole-genome alignment identified the same SNV. Ambiguous positions prone to read mapping artifacts in reciprocal-alignments were also flagged using the same criteria as above.
Identifying donor segments in individually sequenced transformed clones
Transformant sequence reads were analyzed as above. Recombination events were identified in the transformed clones by classifying the positions of cross-validated SNVs as donor, recipient, or ambiguous. Donor segments were defined as contiguous runs of donor-specific SNVs, uninterrupted by recipient-specific SNVs (ambiguous cross-validated SNV positions were ignored). Individual donor segments breakpoints were defined by the positions of their outermost donor-specific alleles. Donor segments were then manually inspected using the Integrated Genomics Viewer [63] to validate the donor segment breakpoint locations.
Identifying donor segments in a pool of transformed clones
For the pooled sample of four transformed clones (RR3135-RR3138), donor-specific allele frequencies were determined at each cross-validated SNV position. Non-overlapping donor segments were unambiguously identified as contiguous runs of SNV positions with ∼25% donor-specific alleles. Overlapping donor segments (contiguous SNV positions with ∼50% donor-specific alleles) were disambiguated by comparison with the segments identified in RR3135 and RR3137. Segments unique to either RR3137 or RR3138 were disambiguated using allele-specific PCR; two primer pairs were designed that contained several SNVs that distinguished Rd and NP alleles (Table S13).
Analysis of structural variation in and around donor segments
Positions that were unmapped by reads in the reciprocal alignments (but mapped in self-alignments) were used as markers of indel differences and other structural variation between donor and recipient, and the donor segment intervals were examined for read coverage at positions unmapped by either reciprocal alignment. Indel differences flanking the observed donor segments were also tabulated. Manual inspection of read alignments to both references used the Integrative Genome Viewer, and the “.rdiff” and “.qdiff” output from the dnadiff utility of Mummer [64] was used to cross-validate. GenomeMatcher [65] was used to view annotated sequence alignments at transforming and flanking structural variation to identify affected loci.
Supporting Information
Zdroje
1. MaughanHSinhaSWilsonLRedfieldRJ 2008 Competence, DNA uptake and transformation in the Pasteurellaceae. KuhnertPChristensenH Pasteurellaceae: Biology, Genomics and Molecular Aspects Norfolk, UK Caister Academic Press
2. ChenIChristiePJDubnauD 2005 The ins and outs of DNA transfer in bacteria. Science 310 1456 1460
3. ClaverysJPMartinB 2003 Bacterial “competence” genes: signatures of active transformation, or only remnants? Trends Microbiol 11 161 165
4. CroucherNJHarrisSRFraserCQuailMABurtonJ 2011 Rapid pneumococcal evolution in response to clinical interventions. Science 331 430 434
5. HanageWPFraserCTangJConnorTRCoranderJ 2009 Hyper-recombination, diversity, and antibiotic resistance in pneumococcus. Science 324 1454 1457
6. Garcia-CobosSCamposJLazaroERomanFCercenadoE 2007 Ampicillin-resistant non-beta-lactamase-producing Haemophilus influenzae in Spain: recent emergence of clonal isolates with increased resistance to cefotaxime and cefixime. Antimicrob Agents Chemother 51 2564 2573
7. CodyAJFieldDFeilEJStringerSDeadmanME 2003 High rates of recombination in otitis media isolates of non-typeable Haemophilus influenzae. Infect Genet Evol 3 57 66
8. MaidenMC 1998 Horizontal genetic exchange, evolution, and spread of antibiotic resistance in bacteria. Clin Infect Dis 27 Suppl 1 S12 20
9. SeifertHSAjiokaRSMarchalCSparlingPFSoM 1988 DNA transformation leads to pilin antigenic variation in Neisseria gonorrhoeae. Nature 336 392 395
10. KrollJSHopkinsIMoxonER 1988 Capsule loss in H. influenzae type b occurs by recombination-mediated disruption of a gene essential for polysaccharide export. Cell 53 347 356
11. Perez-LosadaMBrowneEBMadsenAWirthTViscidiRP 2006 Population genetics of microbial pathogens estimated from multilocus sequence typing (MLST) data. Infect Genet Evol 6 97 112
12. FeilEJHolmesECBessenDEChanMSDayNP 2001 Recombination within natural populations of pathogenic bacteria: short-term empirical estimates and long-term phylogenetic consequences. Proc Natl Acad Sci U S A 98 182 187
13. FeilEJSprattBG 2001 Recombination and the population structures of bacterial pathogens. Annu Rev Microbiol 55 561 590
14. DidelotXLawsonDDarlingAFalushD 2010 Inference of homologous recombination in bacteria using whole-genome sequences. Genetics 186 1435 1449
15. DidelotXMaidenMC 2010 Impact of recombination on bacterial evolution. Trends Microbiol 18 315 322
16. CoxMM 1993 Relating biochemistry to biology: how the recombinational repair function of RecA protein is manifested in its molecular properties. Bioessays 15 617 623
17. BergeMMortier-BarriereIMartinBClaverysJP 2003 Transformation of Streptococcus pneumoniae relies on DprA - and RecA-dependent protection of incoming DNA single strands. Mol Microbiol 50 527 536
18. GoodgalSHHerriottRM 1961 Studies on transformations of Hemophilus influenzae. I. Competence. J Gen Physiol 44 1201 1227
19. VulicMDionisioFTaddeiFRadmanM 1997 Molecular keys to speciation: DNA polymorphism and the control of genetic exchange in enterobacteria. Proc Natl Acad Sci U S A 94 9763 9767
20. ZawadzkiPRobertsMSCohanFM 1995 The log-linear relationship between sexual isolation and sequence divergence in Bacillus transformation is robust. Genetics 140 917 932
21. BianchiMERaddingCM 1983 Insertions, deletions and mismatches in heteroduplex DNA made by recA protein. Cell 35 511 520
22. StuyJHWalterRB 1981 Addition, deletion, and substitution of long nonhomologous deoxyribonucleic acid segments by genetic transformation of Haemophilus influenzae. J Bacteriol 148 565 571
23. BuckaAStasiakA 2001 RecA-mediated strand exchange traverses substitutional heterologies more easily than deletions or insertions. Nucleic Acids Res 29 2464 2470
24. StambukSRadmanM 1998 Mechanism and control of interspecies recombination in Escherichia coli. I. Mismatch repair, methylation, recombination and replication functions. Genetics 150 533 542
25. HumbertOPrudhommeMHakenbeckRDowsonCGClaverysJP 1995 Homeologous recombination and mismatch repair during transformation in Streptococcus pneumoniae: saturation of the Hex mismatch repair system. Proc Natl Acad Sci U S A 92 9052 9056
26. MajewskiJZawadzkiPPickerillPCohanFMDowsonCG 2000 Barriers to genetic exchange between bacterial species: Streptococcus pneumoniae transformation. J Bacteriol 182 1016 1023
27. KislyukAOHaegemanBBergmanNHWeitzJS 2011 Genomic fluidity: an integrative view of gene diversity within microbial populations. BMC Genomics 12 32
28. TreangenTJAmburOHTonjumTRochaEP 2008 The impact of the neisserial DNA uptake sequences on genome evolution and stability. Genome Biol 9 R60
29. HillerNLJantoBHoggJSBoissyRYuS 2007 Comparative genomic analyses of seventeen Streptococcus pneumoniae strains: insights into the pneumococcal supragenome. J Bacteriol 189 8186 8195
30. HoggJSHuFZJantoBBoissyRHayesJ 2007 Characterization and modeling of the Haemophilus influenzae core and supragenomes based on the complete genomic sequences of Rd and 12 clinical nontypeable strains. Genome Biol 8 R103
31. MediniDDonatiCTettelinHMasignaniVRappuoliR 2005 The microbial pan-genome. Curr Opin Genet Dev 15 589 594
32. RayJLHarmsKWikmarkOGStarikovaIJohnsenPJ 2009 Sexual isolation in Acinetobacter baylyi is locus-specific and varies 10,000-fold over the genome. Genetics 182 1165 1181
33. LinEAZhangXSLevineSMGillSRFalushD 2009 Natural transformation of Helicobacter pylori involves the integration of short DNA fragments interrupted by gaps of variable size. PLoS Pathog 5 e1000337
34. KulickSMocciaCDidelotXFalushDKraftC 2008 Mosaic DNA imports with interspersions of recipient sequence after natural transformation of Helicobacter pylori. PLoS ONE 3 e3797
35. PojeGRedfieldRJ 2003 Transformation of Haemophilus influenzae. Methods Mol Med 71 57 70
36. MaughanHRedfieldRJ 2009 Tracing the evolution of competence in Haemophilus influenzae. PLoS One 4 e5854
37. BentleyDRBalasubramanianSSwerdlowHPSmithGPMiltonJ 2008 Accurate whole human genome sequencing using reversible terminator chemistry. Nature 456 53 59
38. FleischmannRDAdamsMDWhiteOClaytonRAKirknessEF 1995 Whole-genome random sequencing and assembly of Haemophilus influenzae Rd. Science 269 496 512
39. HarrisonADyerDWGillaspyARayWCMungurR 2005 Genomic sequence of an otitis media isolate of nontypeable Haemophilus influenzae: comparative study with H. influenzae serotype d, strain KW20. J Bacteriol 187 4627 4636
40. LiHDurbinR 2010 Fast and accurate long read alignment with Burrows-Wheeler transform. Bioinformatics 26 589 95
41. LiHHandsakerBWysokerAFennellTRuanJ 2009 The Sequence Alignment/Map format and SAMtools. Bioinformatics 25 2078 2079
42. DarlingACMauBBlattnerFRPernaNT 2004 Mauve: multiple alignment of conserved genomic sequence with rearrangements. Genome Res 14 1394 1403
43. ShakSCaponDJHellmissRMarstersSABakerCL 1990 Recombinant human DNase I reduces the viscosity of cystic fibrosis sputum. Proc Natl Acad Sci U S A 87 9188 9192
44. LacrossNCMarrsCFPatelMSandstedtSAGilsdorfJR 2008 High genetic diversity of nontypeable Haemophilus influenzae isolates from two children attending a day care center. J Clin Microbiol 46 3817 3821
45. FarjoRSFoxmanBPatelMJZhangLPettigrewMM 2004 Diversity and sharing of Haemophilus influenzae strains colonizing healthy children attending day-care centers. Pediatr Infect Dis J 23 41 46
46. RedfieldRJFindlayWABosseJKrollJSCameronAD 2006 Evolution of competence and DNA uptake specificity in the Pasteurellaceae. BMC Evol Biol 6 82
47. BaroukiRSmithHO 1986 Initial steps in Haemophilus influenzae transformation. Donor DNA binding in the com10 mutant. J Biol Chem 261 8617 8623
48. LinzBSchenkerMZhuPAchtmanM 2000 Frequent interspecific genetic exchange between commensal Neisseriae and Neisseria meningitidis. Mol Microbiol 36 1049 1058
49. HumbertODorerMSSalamaNR 2011 Characterization of Helicobacter pylori factors that control transformation frequency and integration length during inter-strain DNA recombination. Mol Microbiol 79 387 401
50. PiferMLSmithHO 1985 Processing of donor DNA during Haemophilus influenzae transformation: analysis using a model plasmid system. Proc Natl Acad Sci U S A 82 3731 3735
51. StinglKMullerSScheidgen-KleyboldtGClausenMMaierB 2010 Composite system mediates two-step DNA uptake into Helicobacter pylori. Proc Natl Acad Sci U S A 107 1184 1189
52. McKaneMMilkmanR 1995 Transduction, restriction and recombination patterns in Escherichia coli. Genetics 139 35 43
53. SiscoKLSmithHO 1979 Sequence-specific DNA uptake in Haemophilus transformation. Proc Natl Acad Sci U S A 76 972 976
54. SmithHOTombJFDoughertyBAFleischmannRDVenterJC 1995 Frequency and distribution of DNA uptake signal sequences in the Haemophilus influenzae Rd genome. Science 269 538 540
55. CahoonLASeifertHS 2009 An alternative DNA structure is necessary for pilin antigenic variation in Neisseria gonorrhoeae. Science 325 764 767
56. MaughanHRedfieldRJ 2009 Extensive Variation in Natural Competence in Haemophilus Influenzae. Evolution 63 1852 66
57. NakamuraSShchepetovMDaliaABClarkSEMurphyTF 2011 Molecular basis of increased serum resistance among pulmonary isolates of non-typeable Haemophilus influenzae. PLoS Pathog 7 e1001247
58. WilliamsBJMorlinGValentineNSmithAL 2001 Serum resistance in an invasive, nontypeable Haemophilus influenzae strain. Infect Immun 69 695 705
59. PojeGRedfieldRJ 2003 General methods for culturing Haemophilus influenzae. Methods Mol Med 71 51 56
60. TaylorJSchenckIBlankenbergDNekrutenkoA 2007 Using galaxy to perform large-scale interactive data analyses. Curr Protoc Bioinformatics Chapter 10: Unit 10 15
61. R_Development_Core_Team 2009 R: A language and environment for statistical computing. Vienna, Austria R Foundation for Statistical Computing
62. GuyLKultimaJRAnderssonSG 2010 genoPlotR: comparative gene and genome visualization in R. Bioinformatics 26 2334 2335
63. The IGV Team at the Broad Institute 2010 Interactive Genomics Viewer. Broad Institute. Available: http://www.broadinstitute.org/igv
64. KurtzSPhillippyADelcherALSmootMShumwayM 2004 Versatile and open software for comparing large genomes. Genome Biol 5 R12
65. OhtsuboYIkeda-OhtsuboWNagataYTsudaM 2008 GenomeMatcher: a graphical user interface for DNA sequence comparison. BMC Bioinformatics 9 376
Štítky
Hygiena a epidemiologie Infekční lékařství Laboratoř
Článek A Typhimurium-Typhi Genomic Chimera: A Model to Study Vi Polysaccharide Capsule Function In VivoČlánek SUMO Pathway Dependent Recruitment of Cellular Repressors to Herpes Simplex Virus Type 1 GenomesČlánek A Structural Model for Binding of the Serine-Rich Repeat Adhesin GspB to Host Carbohydrate ReceptorsČlánek Dynamic Evolution of Pathogenicity Revealed by Sequencing and Comparative Genomics of 19 IsolatesČlánek Widespread Endogenization of Genome Sequences of Non-Retroviral RNA Viruses into Plant GenomesČlánek The Cost of Virulence: Retarded Growth of Typhimurium Cells Expressing Type III Secretion System 1Článek A Role for the Chemokine RANTES in Regulating CD8 T Cell Responses during Chronic Viral Infection
Článek vyšel v časopisePLOS Pathogens
Nejčtenější tento týden
2011 Číslo 7- Jak souvisí postcovidový syndrom s poškozením mozku?
- Měli bychom postcovidový syndrom léčit antidepresivy?
- Farmakovigilanční studie perorálních antivirotik indikovaných v léčbě COVID-19
- 10 bodů k očkování proti COVID-19: stanovisko České společnosti alergologie a klinické imunologie ČLS JEP
-
Všechny články tohoto čísla
- What Do We Really Know about How CD4 T Cells Control ?
- “Persisters”: Survival at the Cellular Level
- E6 and E7 from Beta Hpv38 Cooperate with Ultraviolet Light in the Development of Actinic Keratosis-Like Lesions and Squamous Cell Carcinoma in Mice
- Selection of Resistant Bacteria at Very Low Antibiotic Concentrations
- The Extracytoplasmic Domain of the Ser/Thr Kinase PknB Binds Specific Muropeptides and Is Required for PknB Localization
- CD39/Adenosine Pathway Is Involved in AIDS Progression
- Hypoxia and a Fungal Alcohol Dehydrogenase Influence the Pathogenesis of Invasive Pulmonary Aspergillosis
- One Is Enough: Effective Population Size Is Dose-Dependent for a Plant RNA Virus
- Effects of Interferon-α/β on HBV Replication Determined by Viral Load
- A Typhimurium-Typhi Genomic Chimera: A Model to Study Vi Polysaccharide Capsule Function In Vivo
- Dual Chaperone Role of the C-Terminal Propeptide in Folding and Oligomerization of the Pore-Forming Toxin Aerolysin
- Rotavirus Stimulates Release of Serotonin (5-HT) from Human Enterochromaffin Cells and Activates Brain Structures Involved in Nausea and Vomiting
- Dissociation of Infectivity from Seeding Ability in Prions with Alternate Docking Mechanism
- The Impact of Recombination on dN/dS within Recently Emerged Bacterial Clones
- The Regulation of Sulfur Metabolism in
- Illumination of Parainfluenza Virus Infection and Transmission in Living Animals Reveals a Tissue-Specific Dichotomy
- A Permeable Cuticle Is Associated with the Release of Reactive Oxygen Species and Induction of Innate Immunity
- A Concerted Action of Hepatitis C Virus P7 and Nonstructural Protein 2 Regulates Core Localization at the Endoplasmic Reticulum and Virus Assembly
- SUMO Pathway Dependent Recruitment of Cellular Repressors to Herpes Simplex Virus Type 1 Genomes
- Re-localization of Cellular Protein SRp20 during Poliovirus Infection: Bridging a Viral IRES to the Host Cell Translation Apparatus
- Divergent Effects of Human Cytomegalovirus and Herpes Simplex Virus-1 on Cellular Metabolism
- A Structural Model for Binding of the Serine-Rich Repeat Adhesin GspB to Host Carbohydrate Receptors
- Transformation of Natural Genetic Variation into Genomes
- EBV Latency Types Adopt Alternative Chromatin Conformations
- Global mRNA Degradation during Lytic Gammaherpesvirus Infection Contributes to Establishment of Viral Latency
- Dynamic Evolution of Pathogenicity Revealed by Sequencing and Comparative Genomics of 19 Isolates
- Microbial Virulence as an Emergent Property: Consequences and Opportunities
- Widespread Endogenization of Genome Sequences of Non-Retroviral RNA Viruses into Plant Genomes
- Structural Basis of Chemokine Sequestration by CrmD, a Poxvirus-Encoded Tumor Necrosis Factor Receptor
- Cross-Species Transmission of a Novel Adenovirus Associated with a Fulminant Pneumonia Outbreak in a New World Monkey Colony
- An Interaction between KSHV ORF57 and UIF Provides mRNA-Adaptor Redundancy in Herpesvirus Intronless mRNA Export
- Elevated 17β-Estradiol Protects Females from Influenza A Virus Pathogenesis by Suppressing Inflammatory Responses
- The Role of IL-15 Deficiency in the Pathogenesis of Virus-Induced Asthma Exacerbations
- Fluorescence Lifetime Imaging Unravels Metabolism and Its Crosstalk with the Host Cell
- Programmed Death (PD)-1-Deficient Mice Are Extremely Sensitive to Murine Hepatitis Virus Strain-3 (MHV-3) Infection
- Hemoglobin Promotes Nasal Colonization
- Crystallography of a Lewis-Binding Norovirus, Elucidation of Strain-Specificity to the Polymorphic Human Histo-Blood Group Antigens
- The Cost of Virulence: Retarded Growth of Typhimurium Cells Expressing Type III Secretion System 1
- A Genome-Wide Approach to Discovery of Small RNAs Involved in Regulation of Virulence in
- Requires Glycerol for Maximum Fitness During The Tick Phase of the Enzootic Cycle
- C Metabolic Flux Analysis Identifies an Unusual Route for Pyruvate Dissimilation in Mycobacteria which Requires Isocitrate Lyase and Carbon Dioxide Fixation
- A Role for the Chemokine RANTES in Regulating CD8 T Cell Responses during Chronic Viral Infection
- Glycosaminoglycans and Sialylated Glycans Sequentially Facilitate Merkel Cell Polyomavirus Infectious Entry
- Regulation of Stomatal Tropism and Infection by Light in : Evidence for Coordinated Host/Pathogen Responses to Photoperiod?
- Multiple Translocation of the Effector Gene among Chromosomes of the Rice Blast Fungus and Related Species
- Comparative Genomics Yields Insights into Niche Adaptation of Plant Vascular Wilt Pathogens
- Unique Cell Adhesion and Invasion Properties of O:3, the Most Frequent Cause of Human Yersiniosis
- C-Terminal Region of EBNA-2 Determines the Superior Transforming Ability of Type 1 Epstein-Barr Virus by Enhanced Gene Regulation of LMP-1 and CXCR7
- Novel Chikungunya Vaccine Candidate with an IRES-Based Attenuation and Host Range Alteration Mechanism
- PLOS Pathogens
- Archiv čísel
- Aktuální číslo
- Informace o časopisu
Nejčtenější v tomto čísle- Requires Glycerol for Maximum Fitness During The Tick Phase of the Enzootic Cycle
- Comparative Genomics Yields Insights into Niche Adaptation of Plant Vascular Wilt Pathogens
- The Role of IL-15 Deficiency in the Pathogenesis of Virus-Induced Asthma Exacerbations
- “Persisters”: Survival at the Cellular Level
Kurzy
Zvyšte si kvalifikaci online z pohodlí domova
Současné možnosti léčby obezity
nový kurzAutoři: MUDr. Martin Hrubý
Všechny kurzyPřihlášení#ADS_BOTTOM_SCRIPTS#Zapomenuté hesloZadejte e-mailovou adresu, se kterou jste vytvářel(a) účet, budou Vám na ni zaslány informace k nastavení nového hesla.
- Vzdělávání


