-
Články
Top novinky
Reklama- Vzdělávání
- Časopisy
Top články
Nové číslo
- Témata
Top novinky
Reklama- Videa
- Podcasty
Nové podcasty
Reklama- Kariéra
Doporučené pozice
Reklama- Praxe
Top novinky
ReklamaGenetic Association for Renal Traits among Participants of African Ancestry Reveals New Loci for Renal Function
Chronic kidney disease (CKD) is an increasing global public health concern, particularly among populations of African ancestry. We performed an interrogation of known renal loci, genome-wide association (GWA), and IBC candidate-gene SNP association analyses in African Americans from the CARe Renal Consortium. In up to 8,110 participants, we performed meta-analyses of GWA and IBC array data for estimated glomerular filtration rate (eGFR), CKD (eGFR <60 mL/min/1.73 m2), urinary albumin-to-creatinine ratio (UACR), and microalbuminuria (UACR >30 mg/g) and interrogated the 250 kb flanking region around 24 SNPs previously identified in European Ancestry renal GWAS analyses. Findings were replicated in up to 4,358 African Americans. To assess function, individually identified genes were knocked down in zebrafish embryos by morpholino antisense oligonucleotides. Expression of kidney-specific genes was assessed by in situ hybridization, and glomerular filtration was evaluated by dextran clearance. Overall, 23 of 24 previously identified SNPs had direction-consistent associations with eGFR in African Americans, 2 of which achieved nominal significance (UMOD, PIP5K1B). Interrogation of the flanking regions uncovered 24 new index SNPs in African Americans, 12 of which were replicated (UMOD, ANXA9, GCKR, TFDP2, DAB2, VEGFA, ATXN2, GATM, SLC22A2, TMEM60, SLC6A13, and BCAS3). In addition, we identified 3 suggestive loci at DOK6 (p-value = 5.3×10⁻⁷) and FNDC1 (p-value = 3.0×10⁻⁷) for UACR, and KCNQ1 with eGFR (p = 3.6×10⁻⁶). Morpholino knockdown of kcnq1 in the zebrafish resulted in abnormal kidney development and filtration capacity. We identified several SNPs in association with eGFR in African Ancestry individuals, as well as 3 suggestive loci for UACR and eGFR. Functional genetic studies support a role for kcnq1 in glomerular development in zebrafish.
Published in the journal: . PLoS Genet 7(9): e32767. doi:10.1371/journal.pgen.1002264
Category: Research Article
doi: https://doi.org/10.1371/journal.pgen.1002264Summary
Chronic kidney disease (CKD) is an increasing global public health concern, particularly among populations of African ancestry. We performed an interrogation of known renal loci, genome-wide association (GWA), and IBC candidate-gene SNP association analyses in African Americans from the CARe Renal Consortium. In up to 8,110 participants, we performed meta-analyses of GWA and IBC array data for estimated glomerular filtration rate (eGFR), CKD (eGFR <60 mL/min/1.73 m2), urinary albumin-to-creatinine ratio (UACR), and microalbuminuria (UACR >30 mg/g) and interrogated the 250 kb flanking region around 24 SNPs previously identified in European Ancestry renal GWAS analyses. Findings were replicated in up to 4,358 African Americans. To assess function, individually identified genes were knocked down in zebrafish embryos by morpholino antisense oligonucleotides. Expression of kidney-specific genes was assessed by in situ hybridization, and glomerular filtration was evaluated by dextran clearance. Overall, 23 of 24 previously identified SNPs had direction-consistent associations with eGFR in African Americans, 2 of which achieved nominal significance (UMOD, PIP5K1B). Interrogation of the flanking regions uncovered 24 new index SNPs in African Americans, 12 of which were replicated (UMOD, ANXA9, GCKR, TFDP2, DAB2, VEGFA, ATXN2, GATM, SLC22A2, TMEM60, SLC6A13, and BCAS3). In addition, we identified 3 suggestive loci at DOK6 (p-value = 5.3×10⁻⁷) and FNDC1 (p-value = 3.0×10⁻⁷) for UACR, and KCNQ1 with eGFR (p = 3.6×10⁻⁶). Morpholino knockdown of kcnq1 in the zebrafish resulted in abnormal kidney development and filtration capacity. We identified several SNPs in association with eGFR in African Ancestry individuals, as well as 3 suggestive loci for UACR and eGFR. Functional genetic studies support a role for kcnq1 in glomerular development in zebrafish.
Introduction
Chronic kidney disease (CKD) affects approximately 15% of U.S adults [1]. Due in part to increasing rates of diabetes and obesity, the prevalence of CKD continues to rise [1]. Marked variability in the incidence of CKD suggests that factors other than diabetes and hypertension contribute to its etiology [2]. Recently, we identified 16 genomic loci associated with estimated glomerular filtration rate (eGFR), a primary measure of CKD, using genome-wide association studies (GWAS) in a combined sample of 67,093 European ancestry individuals from the CKDGen consortium [3], [4]. However, these loci only account for 1.4% of the eGFR variation, suggesting that additional loci remain to be identified [5].
African American ethnicity is a well-established risk factor for CKD, and rates of end-stage renal disease (ESRD) are up to 4-fold higher among African Americans as compared to European Americans [6]. Several prior studies, including the FIND consortium, have performed linkage analysis of diabetic ESRD [7]–[9]. Recent genome-wide admixture mapping studies identified genetic variation in the regions of MYH9 and APOL1 on chromosome 22 that may explain up to 70% of the differences in ESRD rates between European and African Americans [10]–[12]. While this finding has great implications for ESRD, recent evidence also suggests that African Americans progress faster from moderately decreased kidney function to ESRD, spending less time in the recognized earlier stages of CKD [13], [14]. The identification of additional risk factors for CKD, including genetic loci in association with eGFR, may help to advance our understanding of the underpinnings of CKD in African Americans.
Thus, the goal of this study was to uncover loci for kidney traits in African ancestry participants in the Candidate-gene Association Resource (CARe) Consortium. CARe is a consortium of 9 studies which form a combined population of approximately 40,000 African and European Americans genotyped on the IBC array [15] and approximately 8,000 African American participants genotyped using a GWAS platform. We aimed to interrogate known regions previously associated with eGFR in European Ancestry populations [3], [4], as well as to perform discovery analyses in African ancestry populations. In order to gain further insight into the functional implications of our associations, genes at or near loci of interest were knocked down by morpholino injection in zebrafish, and kidney gene expression and function were investigated using in situ hybridization and glomerular filtration assays.
Results
Study sample characteristics are shown in Table 1 and Table S1. Overall, 7,382 participants of African ancestry had genome-wide SNP data and phenotype information on eGFR and CKD; and 5,569 had data on UACR and albuminuria. For the IBC chip analysis, 8,110 participants of African ancestry had data on eGFR and CKD and 5,995 had data on UACR and albuminuria.
Tab. 1. Study sample characteristics in the CARE Renal Consortium.* 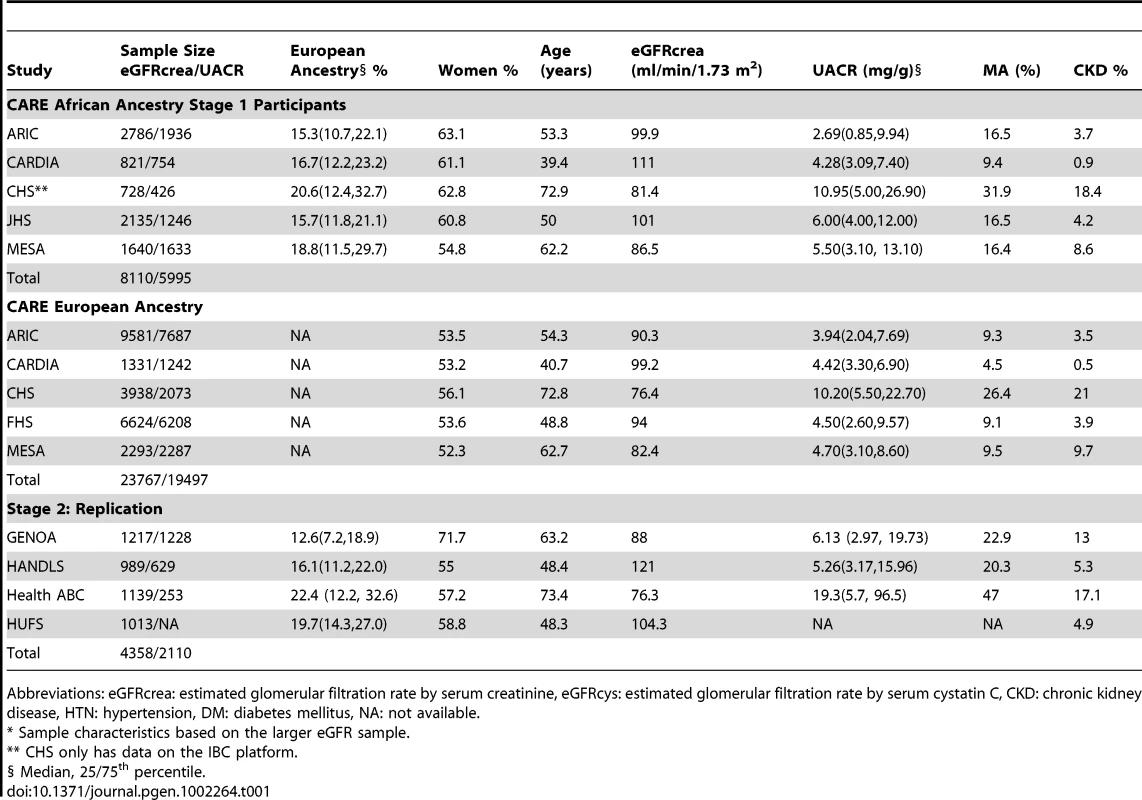
Abbreviations: eGFRcrea: estimated glomerular filtration rate by serum creatinine, eGFRcys: estimated glomerular filtration rate by serum cystatin C, CKD: chronic kidney disease, HTN: hypertension, DM: diabetes mellitus, NA: not available. Interrogation of Known Renal Function Loci in African American Participants
Genome-wide association analyses were conducted for eGFR, CKD, UACR, and albuminuria. Quantile-quantile and Manhattan plots are displayed in Figure S1 and Figure S2, respectively; lambdas ranged from 1.0 to 1.02.
We examined previously published loci in association with eGFR in participants of European Ancestry [3], [4], [16] in our African American GWAS (Table 2). In 23 of 24 SNPs, the directions of the beta coefficients for eGFR were identical (p-value = 1.4*10−6) in CKDGen and CARe (rs6420094 at SLC34A1 was the only exception), even though only 2 of the SNPs achieved nominal significance (rs4293393 at the UMOD locus [p = 0.01] and rs4744712 at the PIP5K1B locus [p = 0.003]). We further interrogated the 250 kb flanking regions around each of these 24 SNP to identify the top SNP in CARe; statistical significance was determined based on a locus-specific Bonferroni correction (see statistical methods for more detail). Of the 24 SNPs with the lowest p-value in each of these regions identified in CARe African Americans, we were able to replicate 12 loci (UMOD, ANXA9, GCKR, TFDP2, DAB2, VEGFA, ATXN2, GATM, SLC22A2, TMEM60, SLC6A13, and BCAS3) in independent samples of 4358 participants (Table 3, Figure S3).
Tab. 2. Interrogation of known loci in EA in AA for the trait eGFRcrea; best SNP at each locus is shown below; SNP ID in bold from Kottgen et al, Nature Genetics 2009, and Nature Genetics 2010. 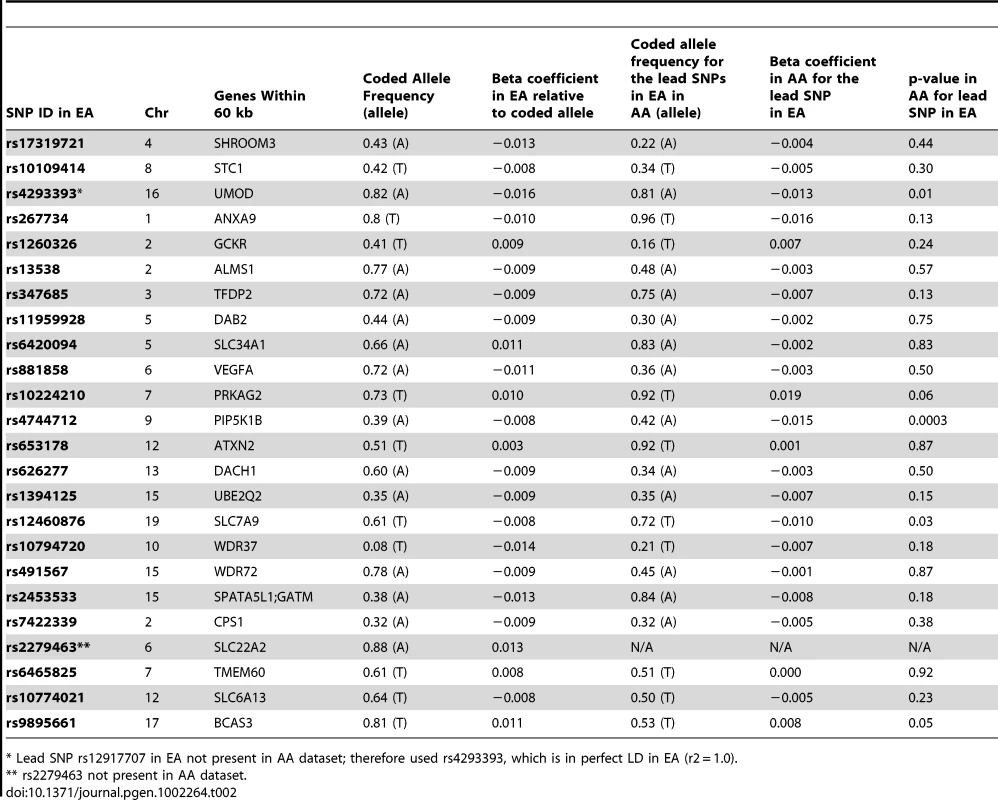
* Lead SNP rs12917707 in EA not present in AA dataset; therefore used rs4293393, which is in perfect LD in EA (r2 = 1.0). Tab. 3. Interrogation of known loci in EA in AA for the trait eGFRcrea; best SNP at each locus is shown below; SNP ID in bold from Kottgen et al, Nature Genetics 2009, and Nature Genetics 2010. 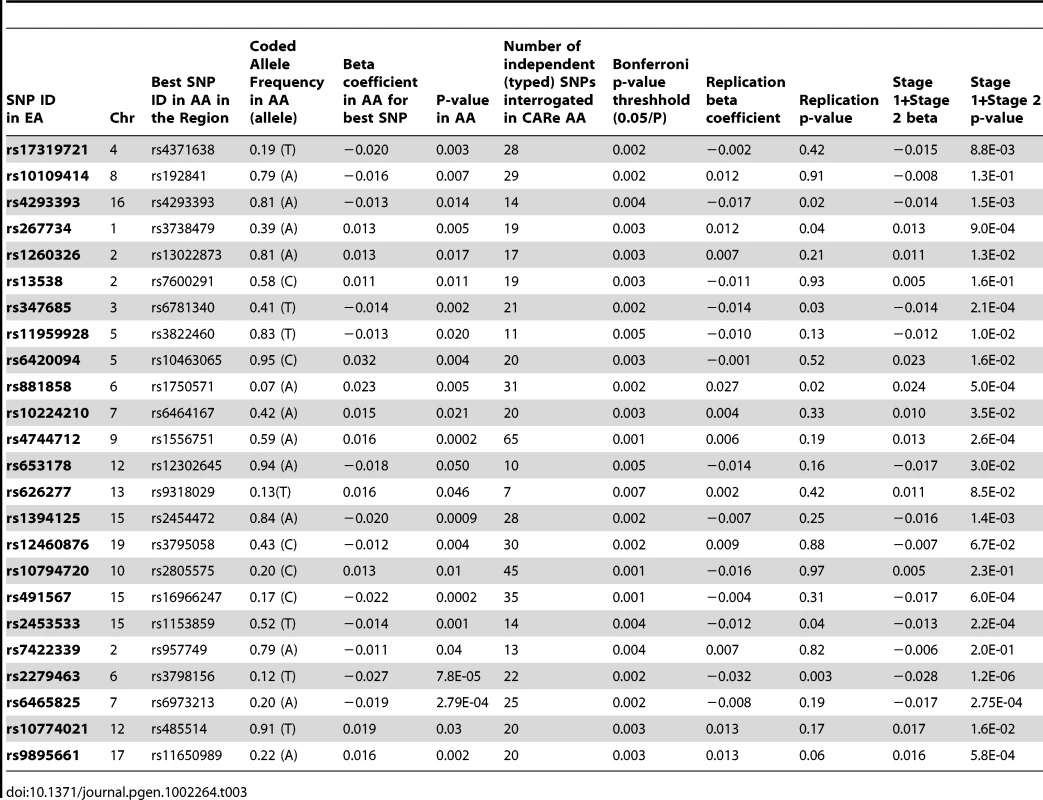
We also interrogated the CARe CKD GWAS results at the chromosome 22 MYH9/APOL1 locus (Figure S4); however, none of the G1 haplotype SNPs in APOL1 was present in our GWAS dataset. The lowest p-value was observed for rs739097 (MAF 0.36, p = 0.00179), which was in weak LD with the previously described rs4821480 in MYH9 (r2 0.03, D′ 0.38 as determined by Hapmap Release 22 YRI phase 2) [10].
Genome-Wide Association Analyses for Renal Indices
We performed discovery analyses using GWAS and the IBC chip array; p-value thresholds for discovery were p<5.0*10−8 for GWAS and p<2.0*10−6 for the IBC array [17]. We observed no genome-wide signals; instead, we carried forward 8 SNPs from GWAS that had a p-value<5*10−6 in Stage 1 for replication; results for these SNPs are presented in Table 4.
Tab. 4. Stage 1 and Stage 2 results from loci in African Americans from GWAS (p<5.0*10E-06): SNP association with renal traits. 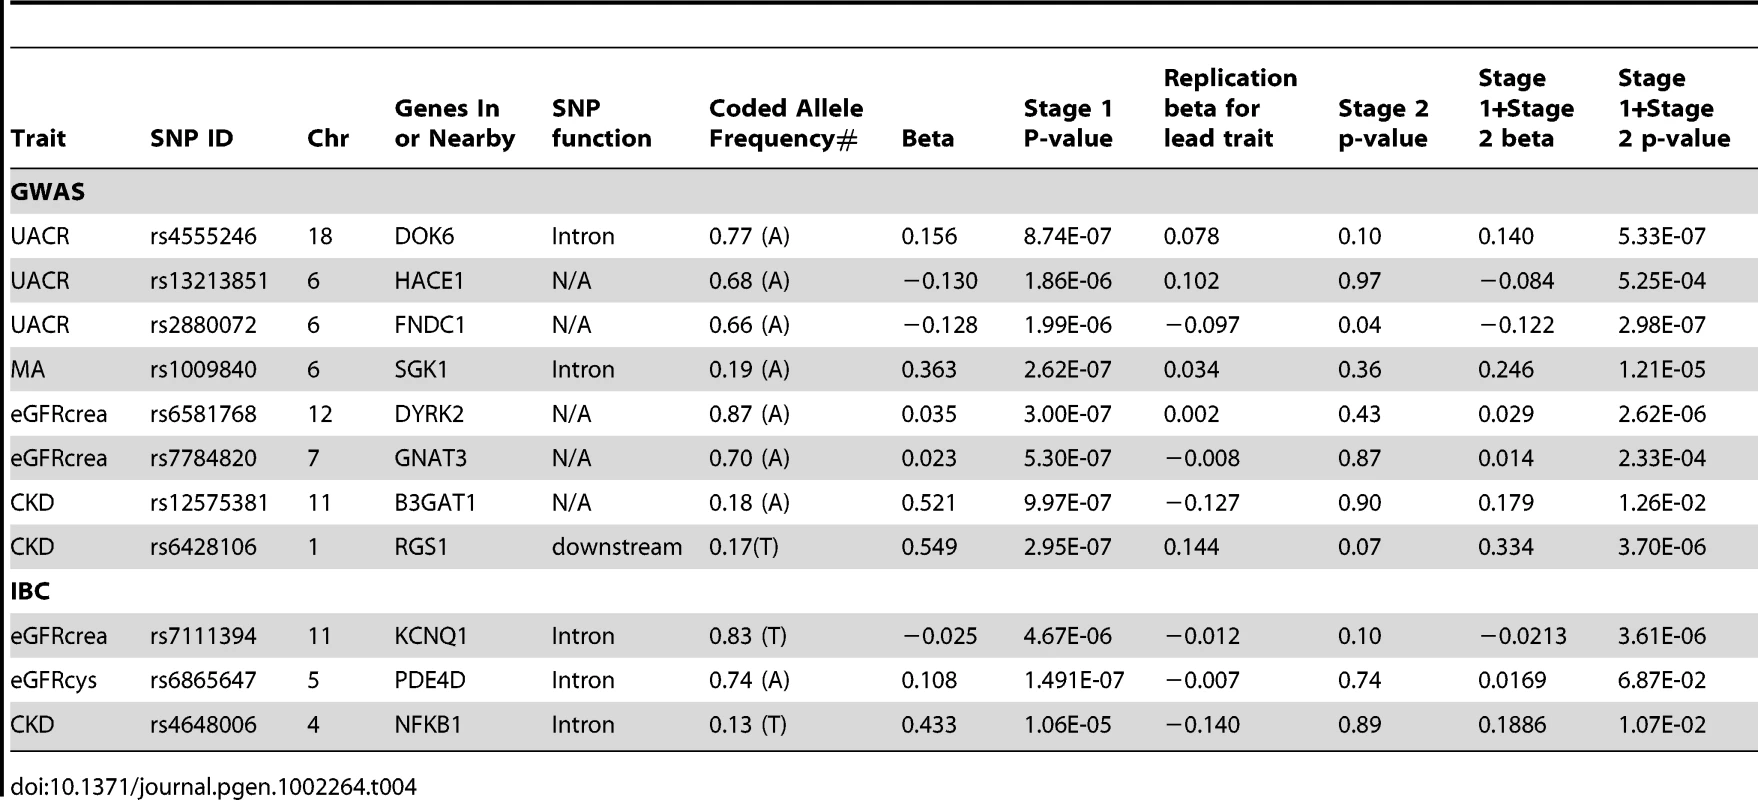
Replication was performed in 4,358 participants of African ancestry for eGFR and 2,110 for UACR. Characteristics of the replication samples are shown in Table 1. Results from discovery, replication, and the combined GWAS analyses in African Americans are presented in Table 4 (imputation scores can be found in Table S2). Of the 8 SNPs from GWAS carried forward to replication, the combined Stage 1 + Stage 2 p-value was 5.3*10−7 for the association between UACR and rs4555246 in DOK6 (Figure 1a) and the combined p-value was 2.9*10−7 for association between UACR and rs2880072 in FNDC1 (Figure 1b). Due to modest power of our replication set and the possibility that loci relevant for CKD may be similar across ethnic groups, we also attempted replication of the association between UACR and these two loci in the CKDGen consortium, a large consortium of participants of European ancestry (n = 31,580 with UACR [18]). The beta coefficient for rs4555246 in DOK6 in the CKDGen data was direction-consistent, although the p-value for this SNP was non-significant (p = 0.44). Recognizing that regions, but not necessarily specific tagging SNPs, may replicate across ethnicities, we interrogated the 250 kb flanking region of rs4555246 (n = 31 independent SNPs). The SNP with the lowest p-value was rs11151530 (MAF 0.17, p = 0.008), which did not meet the Bonferroni-corrected threshold of p = 0.0016 (0.05/31). For FNDC1, the beta coefficient for the lead SNP was direction-consistent in CKDGen (beta = −0.0196), although the p-value was not significant (p = 0.053). Interrogating the 250 kb flanking region (n = 7 independent SNPs) revealed that rs7758822 had the lowest p-value at p = 0.002 (MAF 0.12), which met the Bonferroni-corrected threshold of p = 0.007 (0.05/7).
Fig. 1. Regional association plots for DOK6 and FNDC1. 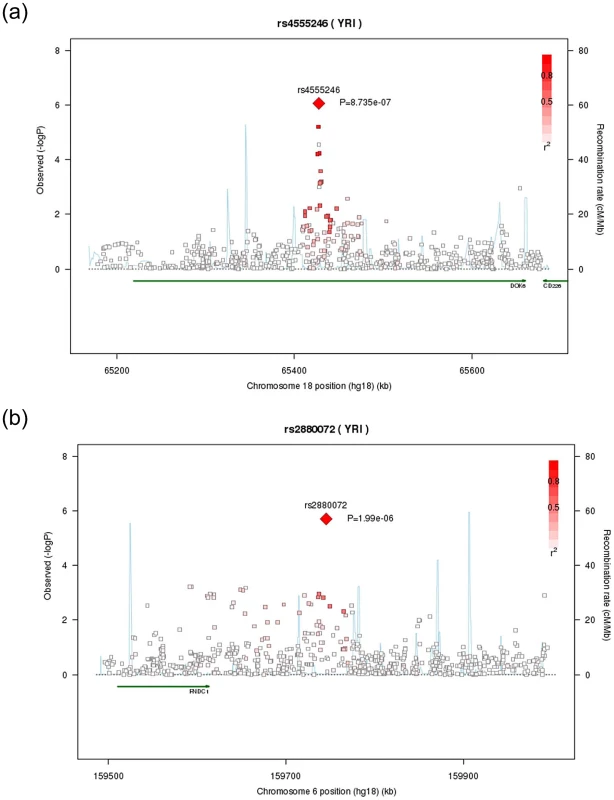
For A) DOK6 and B) FNDC1, Stage 1 only. IBC Chip Analyses for Renal Function Indices
In European Americans, we confirmed several known loci for eGFR/CKD [3], [4], [16]; no novel genome-wide significant associations (defined as p<2.0*10−6) were identified (Table S3). In African Americans, three loci for eGFR/CKD were brought forward to replication (Table 4). Of these, we observed nominal replication for rs7111394 in the KCNQ1 gene (Figure 2a, Stage 1 + Stage 2 p-value = 3.6*10−6). This SNP was not identified in the European American analysis as it was monomorphic in this population. Thus, we interrogated the 250 kb flanking region around this SNP (93 independent SNPs) in the CARe IBC European ancestry participants. The SNP with the lowest p-value was rs81204 (Figure 2b, MAF 0.16, p-value = 0.00036), which exceeded the corrected regional-specific threshold of 0.000538 (0.05/93).
Fig. 2. Regional association plots for KCNQ1. 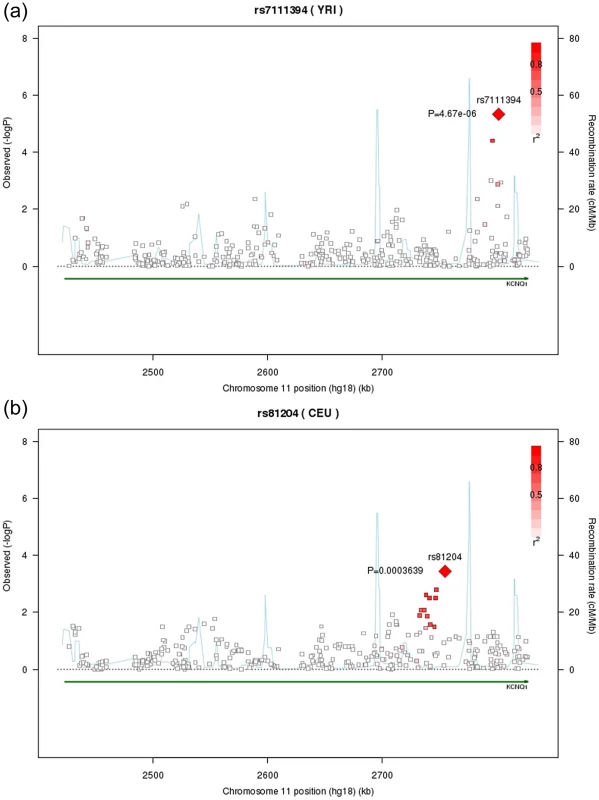
For A) KCNQ1 in participants of African ancestry and B) in participants of European ancestry. Functional Studies of New Loci for Renal Function
To further understand the impact of the three new loci on kidney function and to bolster confidence in the sub-genome-wide statistical associations that we observed, we performed morpholino knockdown of kcnq1, dok6, and fndc1 in zebrafish embryos (see methods).
In situ hybridization for well-established renal markers was used to assess specific anatomic regions of the kidney during development. Kcnq1 knockdown caused abnormalities in glomerular gene expression in the majority of injected embryos, as shown by the global kidney marker pax2a at 48 hours post fertilization (hpf) (see Table 5, Figure 3F). Assessment of the podocyte markers wt1a at 24 hpf and nephrin at 48 hpf revealed similar, glomerular-specific effects. In contrast, the tubular markers slc20a1a and slc12a3 showed no significant changes. Analysis of glomerular architecture at 120 hpf by electron microscopy did not demonstrate significant differences between control and kcnq1 morphant embryos (Figure S5), possibly due to diminished morpholino efficacy at this later stage. Knockdown of dok6 and fndc1 did not result in generalized edema or significant developmental abnormalities of the kidney (Table 5, Figure S6).
Fig. 3. Kcnq1 knockdown in zebrafish embryos causes glomerular abnormalities. 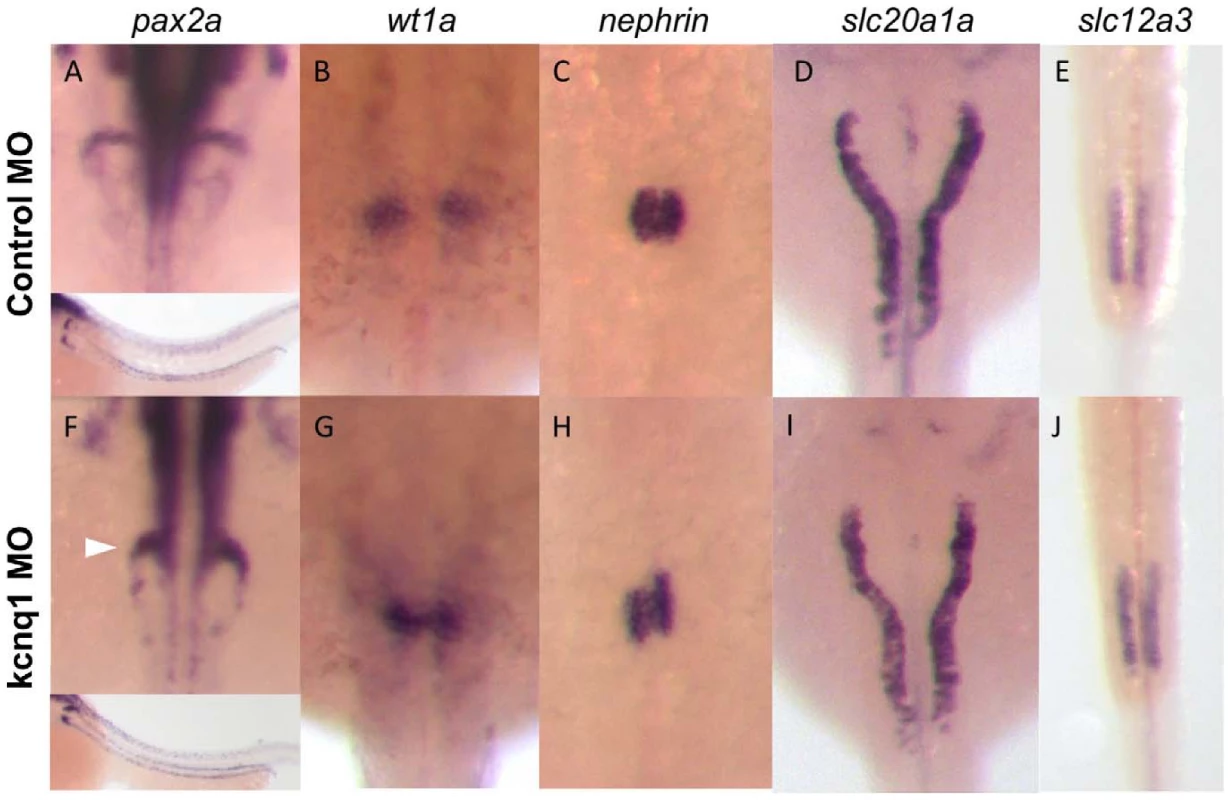
(A–E) Zebrafish embryos injected with control morpholino show normal glomerular and tubular morphology, as shown by in situ hybridization for the global kidney marker pax2a (A, inset showing lower-magnification image, with staining in both glomerulus and tubules), the podocyte markers wt1a (B) and nephrin (C), and the proximal and distal tubular markers slc20a1a (D) and slc12a3 (E). (F–J) Injection of the kcnq1 antisense morpholino, targeting the ATG site of the gene, at the one-cell stage results in significant changes in glomerular gene expression (F–H). No changes were observed in the proximal tubule (I) or the distal tubule (J). Tab. 5. Number of observed abnormalities/number of embryos examined at 200 uM injection (kcnq1) and 400 uM injection (dok6 and fndc1). 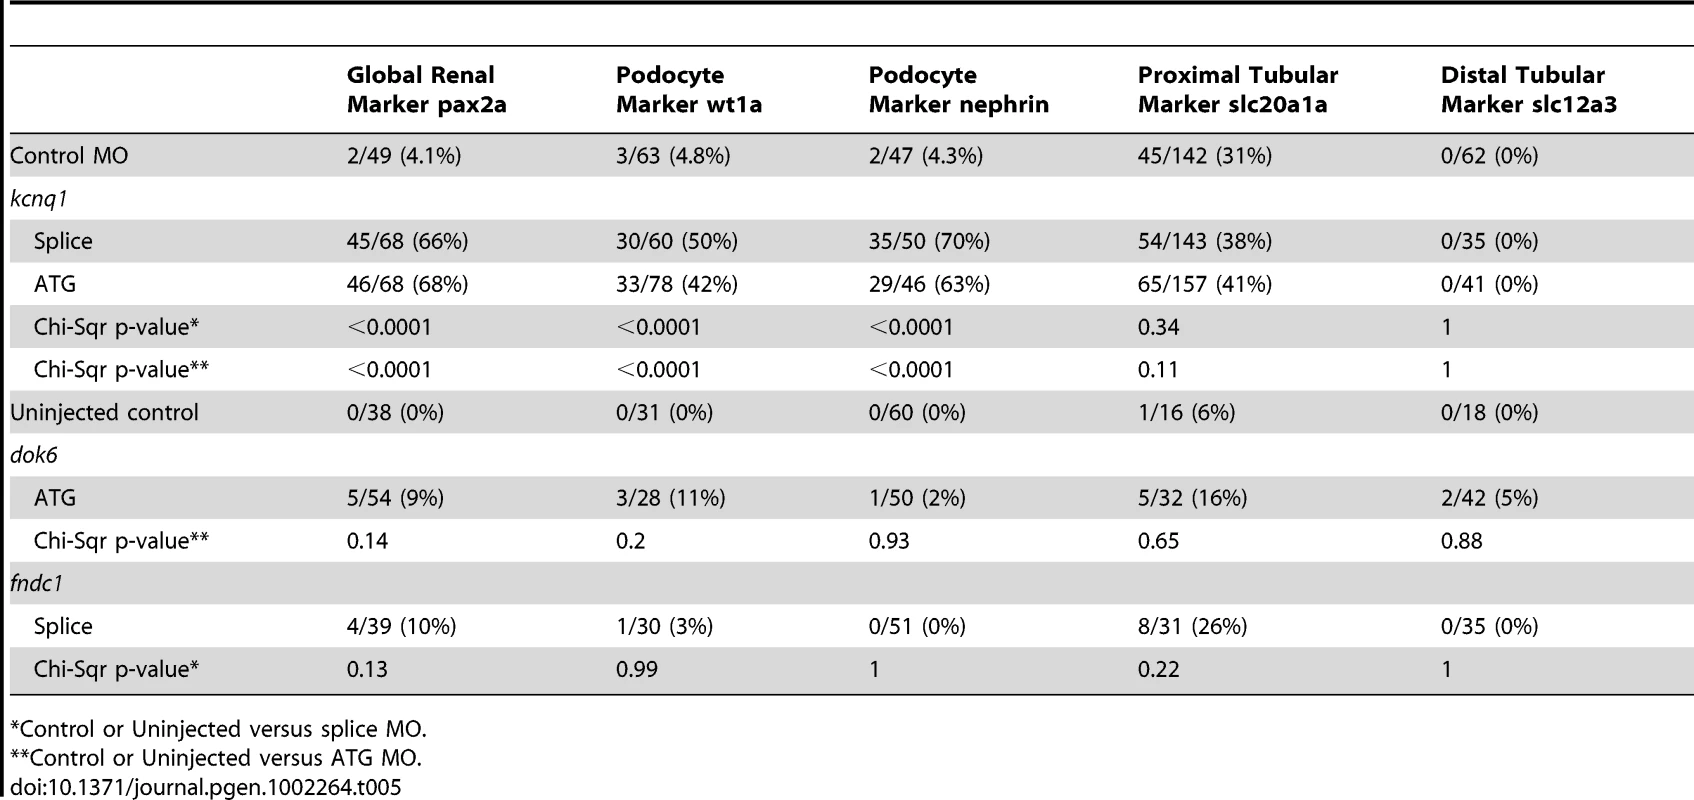
*Control or Uninjected versus splice MO. To determine whether differences in gene expression resulted in altered kidney function, we evaluated glomerular filtration in kcnq1 morphant embryos by assessing the kidney's capacity to retain fluorescent dextran. Fluorescently labeled high-molecular weight dextran has been used in zebrafish to directly visualize functional glomerular integrity [19]. Control or kcnq1 morphant embryos were equally loaded with rhodamine-labeled 10,000 MW dextran by injection into the cardiac sinus venosus at 48 hpf (Figure S7A, S7D). Dextran clearance was assessed by overall fluorescence in the embryo at 72 and 96 hpf (Figure S7B, S7C, S7E, S7F) and presence of red fluorescence in the green fluorescent tubules of cdh17:GFP reporter embryos. Kcnq1 morphant embryos exhibited decreased fluorescence by 96 hpf, indicative of increased dextran clearance compared to control embryos (Figure 4C, 4F). Time course analysis confirmed equal loading and progressive loss of fluorescence over 48 hours in kcnq1 morphants. These results suggest that loss of kcnq1 causes decreased glomerular retention of macromolecules. The majority of embryos with increased loss of dextran fluorescence also exhibited generalized edema (Figure 4A, 4B, 4D, 4E, 4G), which has been previously linked to kidney dysfunction in zebrafish [20], [21].
Fig. 4. Tg(cdh17:GFP) embryos were injected with 200 uM control or kcnq1 morpholino (MO) at the 1-cell stage. 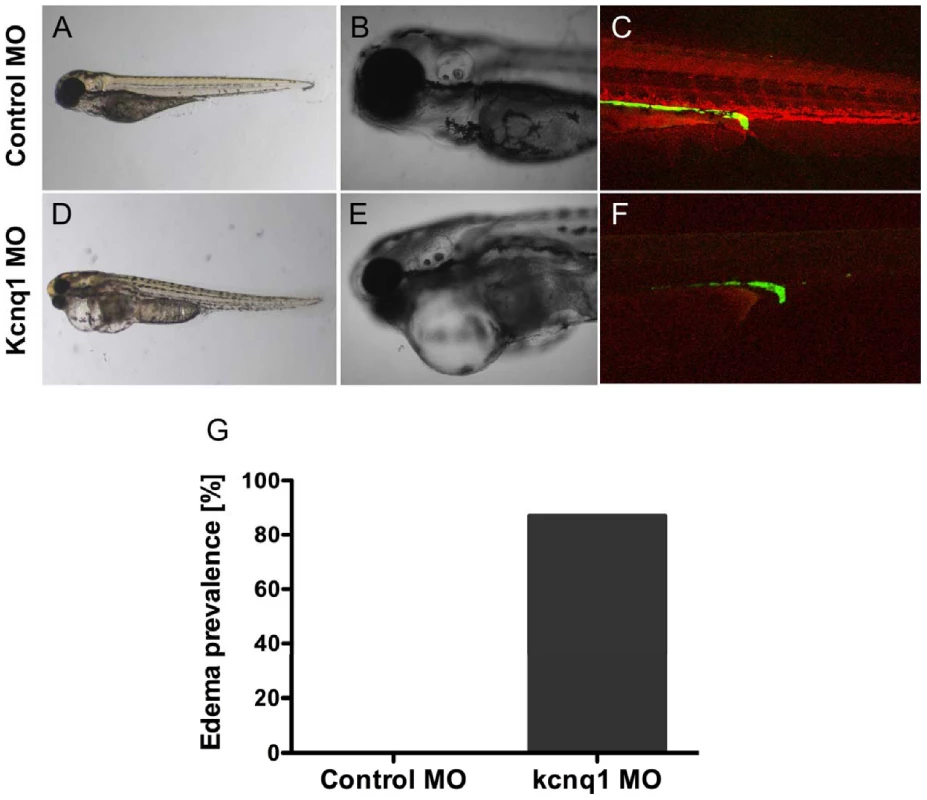
Embryos were subsequently injected in the sinus venosus with 10,000 MW rhodamine dextran at 48 hpf. Dextran clearance was monitored over the next 48 hours by confocal microscopy. Compared to control MO-injected embryos (A–C), kcnq1 MO-injected embryos exhibit edema (D, E) and increased dextran clearance (F) 48 hours post-injection (hpi), suggestive of a filtration defect. At 5 dpf, 87% of kcnq1 morphant embryos (n = 38) develop edema (G). Cross-Trait Associations
rs4555246 in DOK6 was associated with albuminuria (OR = 1.20, p = 0.001) but not with eGFR (p = 0.23) or CKD (p = 0.92; Table S4). Similarly, rs2880072 in FNDC1 was associated with albuminuria (OR = 0.83, p = 4.9*10−5) but not with eGFR or CKD. Although rs7111394 in KCNQ1 was associated with eGFR, it was not significantly associated with CKD (direction consistent OR 1.07, p = 0.36), UACR, or albuminuria. These findings underscore the specificity of the genetic underpinnings of eGFR as compared to albuminuria.
Stratification by Hypertension and Diabetes Status
All replicating loci were stratified by hypertension and diabetes status (Table S5). We observed nominal significance for nearly all loci in the non-diabetes and non-hypertension strata, and many loci retained statistical significance in the diseased strata despite smaller sample sizes.
Discussion
In more than 8,000 African Americans, for 24 known renal susceptibility loci identified in European ancestry consortia for eGFR and CKD, we have identified the most significant SNP in African Americans, of which several showed evidence of confirmation or replication. In addition, we performed discovery analyses using GWAS and a candidate-gene based array, and uncovered 3 suggestive loci, including KCNQ1 in association with eGFR and DOK6 and FNDC1 in association with UACR. Finally, we show that loss of function of kcnq1 leads to abnormalities in glomerular gene expression and function during zebrafish development.
Despite having one of the largest GWAS datasets in African Americans, both our discovery and replication samples were of relatively modest size. Thus, we have focused primarily on interrogating regions previously identified in well-powered European ancestry meta-analyses for renal function in order to reduce our genome-wide penalty for multiple testing. While we have uncovered 3 suggestive loci, the strength of the statistical significance is only suggestive. Because of this, we have corroborated our findings with functional data from zebrafish, providing compelling evidence for the role of KCNQ1 in renal abnormalities.
Several prior genome-wide studies using GWAS or admixture approaches have identified loci for renal function in participants of European [3], [4], [16] and African ancestry [10], [11]. These studies have identified loci for eGFR, CKD, and non-diabetic ESRD; however, few novel discoveries and relatively limited replication have been made for renal function indices in African Americans. African ancestry populations have smaller LD blocks and hence more genetic diversity, thus offering the potential opportunity to fine map genomic regions and to identify novel genomic regions for indices of renal function.
The genes located closest to our three suggestive loci are KCNQ1 in association with eGFR, as well as FNDC1 and DOK6 in association with UACR. KCNQ1 on chromosome 11 encodes for the potassium voltage-gated channel, KQT-like subfamily, member 1 (KvLQT1). The lead SNP identified among the African ancestry participants is located in an intron of KCNQ1 and is flanked by two recombination hotspots. The kcnq1 protein is abundantly expressed in the brush border membrane of renal proximal tubule cells, where it interacts with other K+ channels (KCNE) to mediate net K+ secretion. Loss of Kcnq1 in the mouse leads to impaired Na+ absorption with increased glucose load, however, developmental abnormalities have not been reported [22]. Variants in KCNQ1 have been associated with type 2 diabetes [23] and beta cell function [24], due to its role as a potassium channel in the pancreatic beta cells. A recent study of individuals with diabetes from Japan identified variants in the KCNQ1 gene in association with diabetic nephropathy [25]. Our lead SNP is not in LD with this signal in either European or African ancestry individuals. Importantly, we observe a strong and significant association with KCNQ1 among participants without diabetes, and our functional work suggests an independent association of kcnq1 in renal development. Thus, it is unlikely that our observed associations are solely due to the association of KCNQ1 with diabetes.
The DOK6 gene on chromosome 18 encodes a member of a family of intracellular adaptor proteins that have a role in the assembly of multimolecular signaling complexes. It is expressed in the human kidney as well as the ureteric buds of the murine developing kidney [26]. Although a direct role in renal disease has not been described so far, DOK6 interacts with Ret [26], the ablation of which resulted in kidney agenesis in model systems [27]. The lead SNP we identified is located in an intron of a very circumscribed region of the gene. DOK6 has been recently found in a GWAS for osteoporosis [28], although our lead SNP is not in LD with this variant.
The fibronectin type III domain containing 1 (FNDC1) gene on chromosome 6 is also expressed in the kidney; the lead SNP is located nearly 100 kb downstream of the gene. Little is known about the function of this gene to date; previous studies found that FNDC1 may mediate G protein signaling and have a role in hypoxia-induced apocytosis of cultured ventricular cardiomyocytes [29], [30].
Zebrafish have been extensively used to study principal pathways of kidney development and function [31], [32]. More recently, adult models of kidney injury have been developed [33]. For example, targeted knockdown of a prolyl 4-hydroxylase resulted in kidney dysfunction with edema and changes in podocytes and Bowman's capsule [34]. In addition, a zebrafish model of human nephrotic syndrome was generated by plce1 knockdown after positional cloning of this gene in affected siblings, similarly resulting in cardiac edema and functional abnormalities [35]. Here, we use morpholino knockdown to demonstrate that loss of kcnq1 leads to changes in global morphology and gene expression abnormalities during zebrafish kidney development. Furthermore, in vivo fluorescence-based functional analysis of zebrafish glomerular filtration capacity demonstrated decreased retention of macromolecules, as previously demonstrated for other genes affecting glomerular integrity [19], [20]. Interestingly, KCNQ1 was identified in association with eGFR, and knockdown of kcnq1 in zebrafish predominantly causes glomerular gene expression and filtration defects. These results suggest that genes associated with polygenic chronic conditions can produce developmental phenotypes when knocked down in vivo.
Our analytic approach was complemented by a large-scale candidate gene analysis using the IBC SNP Chip array [15] and replication of our findings in an additional 4358 African American individuals. By using participants from predominantly population-based cohorts, we were able to study disease initiation. An important focus of our multi-ethnic samples allowed us to explore allelic heterogeneity, and support the notion that genomic risk regions are observed across ethnicities. Our replication was derived from in silico samples, which allowed for the adjustment for principle components where necessary. Finally, we were able to corroborate our results in the zebrafish, a model organism for studying vertebrate kidney development.
While the advantage of the zebrafish model is to rapidly assess gene function during development, the role of genes in aging and chronic disease cannot be modeled by transient morpholino knockdown. eGFR was estimated using the MDRD study equation, as obtaining gold-standard measures of GFR in large population-based samples is not feasible. Serum creatinine and albuminuria were measured at a single-point in time, which may misclassify certain individuals and bias our results toward the null. Even with imputation, the coverage of the genome in African Americans is not comprehensive, thus limiting our statistical power. With respect to the chromosome 22 MYH9/APOL1 locus, neither the E1 haplotype in MYH9 nor the G1 haplotype in APOL1 were in our GWAS dataset, limiting our ability to examine this region in association with more modest CKD phenotypes. Finally, our power was low for CKD to detect SNPs with odds ratios of 1.2, the largest odds ratio detected in other GWAS for CKD [4].
We identified several SNPs in association with eGFR in African Ancestry individuals, as well as 3 suggestive loci for UACR and eGFR. Functional genomic studies support a role for kcnq1 in glomerular development and function in zebrafish.
Methods
Renal Function Indices
Serum creatinine was measured as described in Text S1. Serum creatinine was calibrated to NHANES in all studies (including replication cohorts) to account for between-laboratory variation as previously described [3], [36], [37]. Glomerular filtration rate was calculated based on serum creatinine (eGFR) with the Modification of Diet in Renal Disease (MDRD) equation [38]. We defined chronic kidney disease (CKD) as eGFR <60 ml/min/1.73 m2 in accordance with the National Kidney Foundation guidelines; CKD was based on a single serum creatinine measurement as described in Text S1. Urinary albumin to creatinine ratio (UACR, mg/g) was computed as described in Text S1; microalbuminuria was defined as UACR >17 mg/g [men] and >25 mg/g [women].
Covariate Definitions
We defined diabetes as fasting glucose ≥126 mg/dl, self-report, or pharmacologic treatment. Similarly, hypertension was defined as systolic blood pressure ≥140 mm Hg, diastolic blood pressure ≥90 mm Hg, or pharmacologic treatment.
Genotyping Platforms for Genome-Wide Genotype and Imputation
For the present study, the CARe consortium genotyped the IBC SNP chip [15] in 23767 European Americans and 8110 African Americans, as well as the Affymetrix 6.0 chip in 7382 African Americans. The IBC array contains nearly 50,000 SNPs across 2,000 loci. SNPs were selected using a tagging approach among populations represented in HapMap and the SeattleSNPs project. The array was designed to focus on candidate loci related to cardiovascular disease and its risk factors. More details can be found in the design paper [15]. Table S1 details the genotyping that was conducted. For the CARe study cohorts, quality control and imputation were conducted centrally using MACH 1.0.16 (http://www.sph.umich.edu/csg/abecasis/MaCH/). Imputation results were filtered using thresholds RSQ_HAT value of 0.3 and minor allele frequency 0.01. Fractional counts between 0 and 2 were coded for the imputed genotypes in order to estimate the number of copies of a pre-specified allele. For European samples, the CEU population from HapMap 2 (2.54 million SNPs) was used as the reference panel.
For African American samples, a 1∶1 combined HapMap 2 CEU+YRI reference panel was used. This panel includes SNPs that were present in both populations, as well as SNPs segregating in one panel and monomorphic and nonmissing in the other (2.74 million altogether). Since the African American samples were genotyped for both the Affymetrix 6.0 and IBC arrays, we were able to analyze imputation performance at non-genotyped SNPs. The use of the CEU+YRI panel resulted in an allelic concordance rate of ∼95.6%, calculated as 1 – 1/2*|imputed_dosage – chip_dosage| for imputation on the Affymetrix chip. This is similar to rates obtained from African ancestry participants imputed using HapMap 2 YRI individuals [39].
Statistical Methods for Discovery Stage
Trait creation details are described above (Renal Function Indices). Performed centrally but within each individual study, genome-wide association analyses and IBC chip analyses of natural log-transformed eGFR, UACR, CKD, and MA were conducted using linear and logistic regression with an additive genetic model. We adjusted for age, sex and study site (when applicable) and the first 10 principal components; relatedness was accounted for when necessary using linear mixed effect (LME) models for eGFR and UACR and logistic regression via generalized estimating equations (GEE) for CKD and MA. Additional details regarding the discovery cohorts are in Text S1.
Principal Components Analysis
Principal components were generated using EIGENSTRAT [40] within each study using the CARe African ancestry Affy6.0 genotype data. Two reference populations were included in the principal component analysis of African Americans: 1,178 European Americans from a multiple sclerosis GWA study (from Dr. Phil de Jager and colleagues), and 756 Nigerians from the Yoruba region from a hypertension GWA (provided by Dr. Richard Cooper and colleagues). Importantly, these two underwent extensively quality control procedures to remove population outliers using PCA. Ten principal components were generated for each study and used to adjust for population substructure.
Meta-Analysis
We performed fixed-effect meta-analyses of the IBC chip and genome-wide association data using the inverse-variance weighted approach in METAL (http://www.sph.umich.edu/csg/abecasis/Metal/index.html). Genomic control correction was applied after calculating the inflation factor lambda (λ) within each individual study and after the genome-wide association meta-analysis was performed.
The standard threshold of p<5×10⁻⁸ for genome-wide significance in the genome-wide association and p<2.0×10⁻⁶ in the IBC chip analyses was used. The rationale for the p-value threshold used for the IBC chip is based on an empiric test of the number of independent loci (∼25,000) that appear on the IBC array [17]. We selected independent SNPs (pairwise r2<0.2) at each locus for replication.
The R software (v2.9.0) was used for data management, statistical analyses and graphing.
Interrogation of CKDGen Loci in CARe
We developed a set of criteria to validate the lead SNPs and interrogate regions around each of the loci that were previously reported among European ancestry (EA) participants [3], [4] in our African American (AA) CARe samples. For each lead SNP in EA, we looked-up the respective association result with eGFR in AA. To accommodate the difference of LD structure and possible allelic heterogeneity across different ethnicities, we then interrogated the 250 kb flanking region around each lead SNP to determine whether there exist other SNPs with stronger associations with the outcome. We used the following criteria to identify the top AA SNP: 1) the SNP with the smallest association p-value within the region; 2) MAF >0.03; 3) location of the AA lead SNP within the same recombination block of the lead EA SNP, where the recombination block was defined as a 20% recombination rate. The statistical significance of each identified SNP was evaluated using a region-specific Bonferroni correction. We determined the number of independent SNPs based on the variance inflation factor (VIF), which was calculated recursively within a sliding window with size 50 SNPs and pairwise r2 value of 0.2 using PLINK.
Finally, each identified top SNP in AA was sent for replication in additional independent AA samples.
Interrogation of CARe Loci in CKDGen
Similar to the interrogation in AA for the EA lead loci, we also interrogated the newly identified loci from the CARe GWAS and the IBC chip in EA participants of the CKDGen consortium.
Stage 2 Replication Analysis
Replication analyses were performed using imputed in silico genome-wide association data; replication studies conducted the same association analyses as the Stage 1 phase. Details regarding the replication cohorts can be found in Text S1.
Replication was performed as follows: meta-analysis was conducted in the Stage 2 studies only, and then in the Stage 1 + Stage 2 studies combined. Replication was defined as a direction-consistent Stage 2 beta coefficient; replication p-values are thus represented as one-sided tests. SNPs were declared to replicate when the p-value in the Stage 1 + Stage 2 studies combined was smaller than the p-value in the Stage 1 alone.
Cross-Trait Analyses
The correlation between ln(UACR) and ln(eGFR) can range from non-significant to as high as 0.237 (p<0.001) in our study; therefore, we examined the cross-trait associations across albuminuria and eGFR phenotypes.
Functional Studies in Zebrafish
Zebrafish were maintained in accordance with established procedures and IACUC approval. At the one-cell stage, zebrafish embryos were injected with varying doses of morpholino antisense oligonucleotides (MO, GeneTools, Philomath OR). MO sequences are shown in Table S6. For in vivo observations, edema development was documented at 5-days post-fertilization.
In situ hybridization was performed according to established procedures (http://zfin.org/ZFIN/Methods/ThisseProtocol.html).To visualize different regions of the kidney, we used pax2a (global kidney marker) [41], wt1a (podocyte marker) [41], nephrin (podocyte marker) [31], slc20a1a (proximal tubule) [42], and slc12a3 (distal tubule marker) [42]. The morphology of the expression pattern was independently scored by two investigators. Electron microscopy was performed as previously described [41].
Dextran clearance was assessed as described previously [20], 48 hours after morpholino injection, embryos were manually dechorionated, anesthetized in a 1∶20 dilution of 4 mg/ml Tricaine in egg water and positioned on their back in a 1% agarose injection mold. An equal volume of tetramethylrhodamine dextran (10,000 MW; Invitrogen) was injected into the cardiac sinus venosus of each embryo, after which embryos were returned to fresh egg water. Embryos were imaged by fluorescence microscopy 6 hours post-injection (54 hpf) to demonstrate equal loading, then subsequently imaged at 72 and 96 hpf to evaluate dextran clearance. Confocal images were obtained from agarose embedded embryos using a Zeiss LSM500 microscope.
Supporting Information
Zdroje
1. CoreshJSelvinEStevensLAManziJKusekJW 2007 Prevalence of chronic kidney disease in the United States. JAMA 298 2038 2047
2. FoxCSMuntnerP 2008 Trends in diabetes, high cholesterol, and hypertension in chronic kidney disease among U.S. adults: 1988–1994 to 1999–2004. Diabetes Care 31 1337 1342
3. KottgenAGlazerNLDehghanAHwangSJKatzR 2009 Multiple loci associated with indices of renal function and chronic kidney disease. Nat Genet 41 712 717
4. KottgenAPattaroCBogerCAFuchsbergerCOldenM 2010 New loci associated with kidney function and chronic kidney disease. Nat Genet 42 376 384
5. FoxCSYangQCupplesLAGuoCYLarsonMG 2004 Genomewide Linkage Analysis to Serum Creatinine, GFR, and Creatinine Clearance in a Community-Based Population: The Framingham Heart Study. J Am Soc Nephrol 15 2457 2461
6. U.S. Renal Data System, USRDS 2008 Annual Data Report, National Institutes of Health, National Institute of Diabetes and Digestive and Kidney Diseases, Bethesda, MD, 2008
7. IgoRPJrIyengarSKNicholasSBGoddardKALangefeldCD 2011 Genomewide Linkage Scan for Diabetic Renal Failure and Albuminuria: The FIND Study. Am J Nephrol 33 381 389
8. SchellingJRAbboudHENicholasSBPahlMVSedorJR 2008 Genome-wide scan for estimated glomerular filtration rate in multi-ethnic diabetic populations: the Family Investigation of Nephropathy and Diabetes (FIND). Diabetes 57 235 243
9. IyengarSKAbboudHEGoddardKASaadMFAdlerSG 2007 Genome-wide scans for diabetic nephropathy and albuminuria in multiethnic populations: the family investigation of nephropathy and diabetes (FIND). Diabetes 56 1577 1585
10. KaoWHKlagMJMeoniLAReichDBerthier-SchaadY 2008 MYH9 is associated with nondiabetic end-stage renal disease in African Americans. Nat Genet 40 1185 1192
11. KoppJBSmithMWNelsonGWJohnsonRCFreedmanBI 2008 MYH9 is a major-effect risk gene for focal segmental glomerulosclerosis. Nat Genet 40 1175 1184
12. GenoveseGFriedmanDJRossMDLecordierLUzureauP 2010 Association of trypanolytic ApoL1 variants with kidney disease in African Americans. Science 329 841 845
13. HsuCYLinFVittinghoffEShlipakMG 2003 Racial differences in the progression from chronic renal insufficiency to end-stage renal disease in the United States. J Am Soc Nephrol 14 2902 2907
14. HunsickerLGAdlerSCaggiulaAEnglandBKGreeneT 1997 Predictors of the progression of renal disease in the Modification of Diet in Renal Disease Study. Kidney Int 51 1908 1919
15. KeatingBJTischfieldSMurraySSBhangaleTPriceTS 2008 Concept, design and implementation of a cardiovascular gene-centric 50 k SNP array for large-scale genomic association studies. PLoS ONE 3 e3583 doi:10.1371/journal.pone.0003583
16. ChambersJCZhangWLordGMvan derHPLawlorDA 2010 Genetic loci influencing kidney function and chronic kidney disease. Nat Genet 42 373 375
17. LoKSWilsonJGLangeLAFolsomARGalarneauG 2011 Genetic association analysis highlights new loci that modulate hematological trait variation in Caucasians and African Americans. Hum Genet 129 307 317
18. BogerCAChenMHTinAOldenMKottgenA 2011 CUBN Is a Gene Locus for Albuminuria. J Am Soc Nephrol
19. AshworthSTengBKaufeldJMillerETossidouI 2010 Cofilin-1 inactivation leads to proteinuria–studies in zebrafish, mice and humans. PLoS ONE 5 e12626 doi:10.1371/journal.pone.0012626
20. HentschelDMMengelMBoehmeLLiebschFAlbertinC 2007 Rapid screening of glomerular slit diaphragm integrity in larval zebrafish. Am J Physiol Renal Physiol 293 F1746 F1750
21. Neumann-HaefelinEKramer-ZuckerASlanchevKHartlebenBNoutsouF 2010 A model organism approach: defining the role of Neph proteins as regulators of neuron and kidney morphogenesis. Hum Mol Genet 19 2347 2359
22. VallonVGrahammerFVolklHSanduCDRichterK 2005 KCNQ1-dependent transport in renal and gastrointestinal epithelia. Proc Natl Acad Sci U S A 102 17864 17869
23. UnokiHTakahashiAKawaguchiTHaraKHorikoshiM 2008 SNPs in KCNQ1 are associated with susceptibility to type 2 diabetes in East Asian and European populations. Nat Genet 40 1098 1102
24. HuCWangCZhangRMaXWangJ 2009 Variations in KCNQ1 are associated with type 2 diabetes and beta cell function in a Chinese population. Diabetologia 52 1322 1325
25. OhshigeTTanakaYArakiSBabazonoTToyodaM 2010 A single nucleotide polymorphism in KCNQ1 is associated with susceptibility to diabetic nephropathy in japanese subjects with type 2 diabetes. Diabetes Care 33 842 846
26. CrowderRJEnomotoHYangMJohnsonEMJrMilbrandtJ 2004 Dok-6, a Novel p62 Dok family member, promotes Ret-mediated neurite outgrowth. J Biol Chem 279 42072 42081
27. SchuchardtAD'AgatiVLarsson-BlombergLCostantiniFPachnisV 1994 Defects in the kidney and enteric nervous system of mice lacking the tyrosine kinase receptor Ret. Nature 367 380 383
28. HsuYHZillikensMCWilsonSGFarberCRDemissieS 2010 An integration of genome-wide association study and gene expression profiling to prioritize the discovery of novel susceptibility Loci for osteoporosis-related traits. PLoS Genet 6 e1000977 doi:10.1371/journal.pgen.1000977
29. SatoMCismowskiMJToyotaESmrckaAVLucchesiPA 2006 Identification of a receptor-independent activator of G protein signaling (AGS8) in ischemic heart and its interaction with Gbetagamma. Proc Natl Acad Sci U S A 103 797 802
30. SatoMJiaoQHondaTKurotaniRToyotaE 2009 Activator of G protein signaling 8 (AGS8) is required for hypoxia-induced apoptosis of cardiomyocytes: role of G betagamma and connexin 43 (CX43). J Biol Chem 284 31431 31440
31. Kramer-ZuckerAGWiessnerSJensenAMDrummondIA 2005 Organization of the pronephric filtration apparatus in zebrafish requires Nephrin, Podocin and the FERM domain protein Mosaic eyes. Dev Biol 285 316 329
32. DrummondIA 2005 Kidney development and disease in the zebrafish. J Am Soc Nephrol 16 299 304
33. HentschelDMParkKMCilentiLZervosASDrummondI 2005 Acute renal failure in zebrafish: a novel system to study a complex disease. Am J Physiol Renal Physiol 288 F923 F929
34. HyvarinenJParikkaMSormunenRRametMTryggvasonK 2010 Deficiency of a transmembrane prolyl 4-hydroxylase in the zebrafish leads to basement membrane defects and compromised kidney function. J Biol Chem
35. HinkesBWigginsRCGbadegesinRVlangosCNSeelowD 2006 Positional cloning uncovers mutations in PLCE1 responsible for a nephrotic syndrome variant that may be reversible. Nat Genet 38 1397 1405
36. CoreshJAstorBCMcQuillanGKusekJGreeneT 2002 Calibration and random variation of the serum creatinine assay as critical elements of using equations to estimate glomerular filtration rate. Am J Kidney Dis 39 920 929
37. FoxCSLarsonMGLeipEPCulletonBWilsonPW 2004 Predictors of new-onset kidney disease in a community-based population. JAMA 291 844 850
38. KlahrSLeveyASBeckGJCaggiulaAWHunsickerL 1994 The effects of dietary protein restriction and blood-pressure control on the progression of chronic renal disease. Modification of Diet in Renal Disease Study Group. N Engl J Med 330 877 884
39. HuangLLiYSingletonABHardyJAAbecasisG 2009 Genotype-imputation accuracy across worldwide human populations. Am J Hum Genet 84 235 250
40. PriceALPattersonNJPlengeRMWeinblattMEShadickNA 2006 Principal components analysis corrects for stratification in genome-wide association studies. Nat Genet 38 904 909
41. DrummondIAMajumdarAHentschelHElgerMSolnica-KrezelL 1998 Early development of the zebrafish pronephros and analysis of mutations affecting pronephric function. Development 125 4655 4667
42. WingertRASelleckRYuJSongHDChenZ 2007 The cdx genes and retinoic acid control the positioning and segmentation of the zebrafish pronephros. PLoS Genet 3 e189 doi:10.1371/journal.pgen.0030189
Štítky
Genetika Reprodukční medicína
Článek Produces a Long Noncoding RNA and Has General Functions in the Germline, Stem Cells, and BrainČlánek Inference of Relationships in Population Data Using Identity-by-Descent and Identity-by-StateČlánek A Genome-Wide Meta-Analysis of Six Type 1 Diabetes Cohorts Identifies Multiple Associated LociČlánek Retrotransposon-Induced Heterochromatin Spreading in the Mouse Revealed by Insertional PolymorphismsČlánek Essential Roles of BCCIP in Mouse Embryonic Development and Structural Stability of ChromosomesČlánek The Receptor Tyrosine Kinase Alk Controls Neurofibromin Functions in Drosophila Growth and LearningČlánek PCNA Ubiquitination Is Important, But Not Essential for Translesion DNA Synthesis in Mammalian CellsČlánek Genome-Wide Association Study Identifies Four Loci Associated with Eruption of Permanent Teeth
Článek vyšel v časopisePLOS Genetics
Nejčtenější tento týden
2011 Číslo 9
-
Všechny články tohoto čísla
- Temporal Trends in Results Availability from Genome-Wide Association Studies
- Association of eGFR-Related Loci Identified by GWAS with Incident CKD and ESRD
- Genetic Variants at Chromosomes 2q35, 5p12, 6q25.1, 10q26.13, and 16q12.1 Influence the Risk of Breast Cancer in Men
- Large-Scale Gene-Centric Analysis Identifies Novel Variants for Coronary Artery Disease
- Genetic Association for Renal Traits among Participants of African Ancestry Reveals New Loci for Renal Function
- Transcriptome Kinetics Is Governed by a Genome-Wide Coupling of mRNA Production and Degradation: A Role for RNA Pol II
- Conserved Regulation of p53 Network Dosage by MicroRNA–125b Occurs through Evolving miRNA–Target Gene Pairs
- Heterozygous Mutations of Are Associated with an Increased Risk of Isolated Metopic Craniosynostosis in Humans and Mice
- Study of FoxA Pioneer Factor at Silent Genes Reveals Rfx-Repressed Enhancer at and a Potential Indicator of Esophageal Adenocarcinoma Development
- Cholesterol Metabolism Is Required for Intracellular Hedgehog Signal Transduction
- Produces a Long Noncoding RNA and Has General Functions in the Germline, Stem Cells, and Brain
- Age-Dependent Recombination Rates in Human Pedigrees
- Sequence Conservation and Functional Constraint on Intergenic Spacers in Reduced Genomes of the Obligate Symbiont
- Sex Chromosome Mosaicism and Hybrid Speciation among Tiger Swallowtail Butterflies
- A Negative Feedback Loop That Limits the Ectopic Activation of a Cell Type–Specific Sporulation Sigma Factor of
- Phased Whole-Genome Genetic Risk in a Family Quartet Using a Major Allele Reference Sequence
- Mutations in or near the Transmembrane Domain Alter PMEL Amyloid Formation from Functional to Pathogenic
- Inactivation of Alters Melanosome Shape But Has Only a Subtle Effect on Visible Pigmentation
- Novel Interactions between Actin and the Proteasome Revealed by Complex Haploinsufficiency
- Germline Genetic Variants Disturbing the /LIN28 Double-Negative Feedback Loop Alter Breast Cancer Susceptibility
- Separation of Recombination and SOS Response in RecA Suggests LexA Interaction Sites
- Inference of Relationships in Population Data Using Identity-by-Descent and Identity-by-State
- Misregulation of Scm3p/HJURP Causes Chromosome Instability in and Human Cells
- A Noncoding Point Mutation of Causes Multiple Developmental Malformations and Obesity in Twirler Mice
- The Evolutionarily Conserved Longevity Determinants HCF-1 and SIR-2.1/SIRT1 Collaborate to Regulate DAF-16/FOXO
- A Genome-Wide Metabolic QTL Analysis in Europeans Implicates Two Loci Shaped by Recent Positive Selection
- Bacterial Communities of Diverse Species: Ecological Context of a Host–Microbe Model System
- A Genome-Wide Meta-Analysis of Six Type 1 Diabetes Cohorts Identifies Multiple Associated Loci
- Elongator Complex Influences Telomeric Gene Silencing and DNA Damage Response by Its Role in Wobble Uridine tRNA Modification
- Elevated Proteasome Capacity Extends Replicative Lifespan in
- Genome-Wide Analysis of Heteroduplex DNA in Mismatch Repair–Deficient Yeast Cells Reveals Novel Properties of Meiotic Recombination Pathways
- MicroRNA Predictors of Longevity in
- An Iterative Genetic and Dynamical Modelling Approach Identifies Novel Features of the Gene Regulatory Network Underlying Melanocyte Development
- Atypical AT Skew in Firmicute Genomes Results from Selection and Not from Mutation
- Retrotransposon-Induced Heterochromatin Spreading in the Mouse Revealed by Insertional Polymorphisms
- Genomic Analysis of QTLs and Genes Altering Natural Variation in Stochastic Noise
- The Abnormal Phenotypes of Cartilage and Bone in Calcium-Sensing Receptor Deficient Mice Are Dependent on the Actions of Calcium, Phosphorus, and PTH
- Cell Type–Specific Transcriptome Analysis Reveals a Major Role for and miR-200b in Mouse Inner Ear Morphogenesis
- Essential Roles of BCCIP in Mouse Embryonic Development and Structural Stability of Chromosomes
- IAP1-Mediated Ubiquitylation Controls Activation of the Initiator Caspase DRONC Independent of Protein Degradation
- VANG-1 and PRKL-1 Cooperate to Negatively Regulate Neurite Formation in
- The Receptor Tyrosine Kinase Alk Controls Neurofibromin Functions in Drosophila Growth and Learning
- Comparative and Functional Genomics of PD630 for Biofuels Development
- Identification of Type 1 Diabetes–Associated DNA Methylation Variable Positions That Precede Disease Diagnosis
- PCNA Ubiquitination Is Important, But Not Essential for Translesion DNA Synthesis in Mammalian Cells
- Genetic Effects at Pleiotropic Loci Are Context-Dependent with Consequences for the Maintenance of Genetic Variation in Populations
- Genome-Wide Association Study Identifies Four Loci Associated with Eruption of Permanent Teeth
- Bmp and Nodal Independently Regulate Expression to Maintain Unilateral Nodal Activity during Left-Right Axis Specification in Zebrafish
- Inter-Allelic Prion Propagation Reveals Conformational Relationships among a Multitude of [] Strains
- Emergence and Modular Evolution of a Novel Motility Machinery in Bacteria
- Histone Methyltransferase MET-2 Shields the Male X Chromosome from Checkpoint Machinery and Mediates Meiotic Sex Chromosome Inactivation
- PLOS Genetics
- Archiv čísel
- Aktuální číslo
- Informace o časopisu
Nejčtenější v tomto čísle- Retrotransposon-Induced Heterochromatin Spreading in the Mouse Revealed by Insertional Polymorphisms
- The Evolutionarily Conserved Longevity Determinants HCF-1 and SIR-2.1/SIRT1 Collaborate to Regulate DAF-16/FOXO
- Genome-Wide Analysis of Heteroduplex DNA in Mismatch Repair–Deficient Yeast Cells Reveals Novel Properties of Meiotic Recombination Pathways
- Association of eGFR-Related Loci Identified by GWAS with Incident CKD and ESRD
Kurzy
Zvyšte si kvalifikaci online z pohodlí domova
Současné možnosti léčby obezity
nový kurzAutoři: MUDr. Martin Hrubý
Všechny kurzyPřihlášení#ADS_BOTTOM_SCRIPTS#Zapomenuté hesloZadejte e-mailovou adresu, se kterou jste vytvářel(a) účet, budou Vám na ni zaslány informace k nastavení nového hesla.
- Vzdělávání


