-
Články
Top novinky
Reklama- Vzdělávání
- Časopisy
Top články
Nové číslo
- Témata
Top novinky
Reklama- Videa
- Podcasty
Nové podcasty
Reklama- Kariéra
Doporučené pozice
Reklama- Praxe
Top novinky
ReklamaGenome-Wide Association Meta-analysis of Neuropathologic Features of Alzheimer's Disease and Related Dementias
Alzheimer's disease (AD) and related dementias are a major public health challenge and present a therapeutic imperative for which we need additional insight into molecular pathogenesis. We performed a genome-wide association study (GWAS), as well as an analysis of known genetic risk loci for AD dementia, using data from 4,914 brain autopsies. Genome-wide significance was observed for 7 genes and pathologic features of AD and related diseases. Twelve of the 22 genetic risk loci for clinically-defined AD dementia were confirmed in our pathologic sample. Correlation of effect sizes for risk of AD dementia with effect size for hallmark pathologic features of AD were strongly positive and linear. Our study discovered new genetic associations with specific pathologic features and aligned known genetic risk for AD dementia with specific pathologic changes in a large brain autopsy study of AD and related dementias.
Published in the journal: . PLoS Genet 10(9): e32767. doi:10.1371/journal.pgen.1004606
Category: Research Article
doi: https://doi.org/10.1371/journal.pgen.1004606Summary
Alzheimer's disease (AD) and related dementias are a major public health challenge and present a therapeutic imperative for which we need additional insight into molecular pathogenesis. We performed a genome-wide association study (GWAS), as well as an analysis of known genetic risk loci for AD dementia, using data from 4,914 brain autopsies. Genome-wide significance was observed for 7 genes and pathologic features of AD and related diseases. Twelve of the 22 genetic risk loci for clinically-defined AD dementia were confirmed in our pathologic sample. Correlation of effect sizes for risk of AD dementia with effect size for hallmark pathologic features of AD were strongly positive and linear. Our study discovered new genetic associations with specific pathologic features and aligned known genetic risk for AD dementia with specific pathologic changes in a large brain autopsy study of AD and related dementias.
Introduction
Studies of brain aging with brain autopsy endpoint have repeatedly demonstrated that dementia in older individuals most often derives from three common diseases: Alzheimer's disease (AD), vascular brain injury (VBI) especially small vessel disease, and Lewy body (LB) disease (LBD) [1]. Importantly, while each of these diseases exclusively can cause dementia, they commonly co-exist in older patients with dementia [2]. These same brain autopsy studies also commonly observed pathologic changes of AD, LBD, and/or VBI in older individuals carefully demonstrated to be cognitively normal proximate to death. Indeed, it was these observations from cognitively intact “controls” that first led to the hypothesis of cognitive reserve, the idea of excess functional capacity that can mask clinical expression of disease. Biomarker and molecular neuroimaging studies also have observed abnormal changes in cognitively normal individuals that typically occur in patients with dementia, and have demonstrated with longitudinal observation that some of these changes are pathologic [3]. Thus, dementia in older individuals is a syndrome that derives most commonly from the idiosyncratic convergence of three chronic disease processes, AD, VBI, and/or LBD, that each appear to have prevalent latency prior to clinical expression.
The suffering to patients and loved ones and cost to health care systems from the global burden of dementia are staggering, and projected to increase markedly in the coming 20 years [4]. While interventions exist to mitigate some types of VBI, the major unmet medical needs are disease-modifying therapies for AD and LBD. Many efforts are underway to achieve this therapeutic imperative, although none yet has met with reproducible success in clinical trials. One response to these setbacks is to revise the approach to existing therapeutic targets, such as using existing experimental interventions in earlier stages of disease or in selected subgroups. Another approach is to increase the repertoire of therapeutic targets by expanding our knowledge of the molecular drivers of disease; this rationale animates the several recent genome-wide association studies (GWAS) for AD [5]–[11].
Given the pathologic complexity of AD and related dementias, and the prevalence of latent disease, we hypothesized that direct analysis of neuropathologic features might align known genetic risk loci with specific diseases processes as well as identify novel genetic variants associated with specific neuropathologic features. To test these hypotheses the Alzheimer's Disease Genetics Consortium (ADGC) assembled a set of 4,914 samples with genome-wide genotyping data and neuropathologic data, and performed genome-wide association tests of AD and related diseases. We performed both genome wide association and analyses focused on known AD dementia genetic risk loci while using three approaches to the neuropathologic data: a clinico-pathologic definition of AD dementia or controls, focus on the core neuropathologic features of AD, i.e., neurofibrillary tangles (NFTs) and neuritic plaques (NPs), in cases and controls combined, and inclusion of commonly co-morbid neuropathologic features observed in older individuals with dementia, i.e., cerebral amyloid angiopathy (CAA), LBD, hippocampal sclerosis in the elderly (HS), and VBI.
Results
Genome-wide association
First we performed a GWAS of clinico-pathologic AD dementia, that is, cases with clinical dementia confirmed to have moderate to high levels of core AD pathologic changes and controls without dementia and no or low levels of core AD pathologic changes (Table 1). Results and Quantile-Quantile plots are detailed in the supporting material (Tables S1, S2; Figures S1, S2). A number of variants in and around the apolipoprotein E gene (APOE) achieved genome-wide significance (rs6857, p-value = 2×10−62). One additional variant in the PHD Finger Protein 21B gene (PHF21B) achieved genome-wide significance (chr22 : 45354131, p-value = 1.9×10⁻⁸). However, the variant was only imputed in one dataset (albeit the largest set, ADC), had a low minor allele frequency (MAF) ( = 0.017), had a modest imputation info score ( = 0.428), and was not well-supported by association at other variants in the region (Figure S3). These are typically the signs of a false positive, but we do note that a recent meta-analysis of primarily clinic-based samples by the International Genomics of Alzheimer's Project (IGAP) [11] found nominal association at this locus (p-value = 0.00659), with the same direction of effect as we report. There is however some sample overlap between this and the Lambert et al study.
Tab. 1. Case-control criteria. 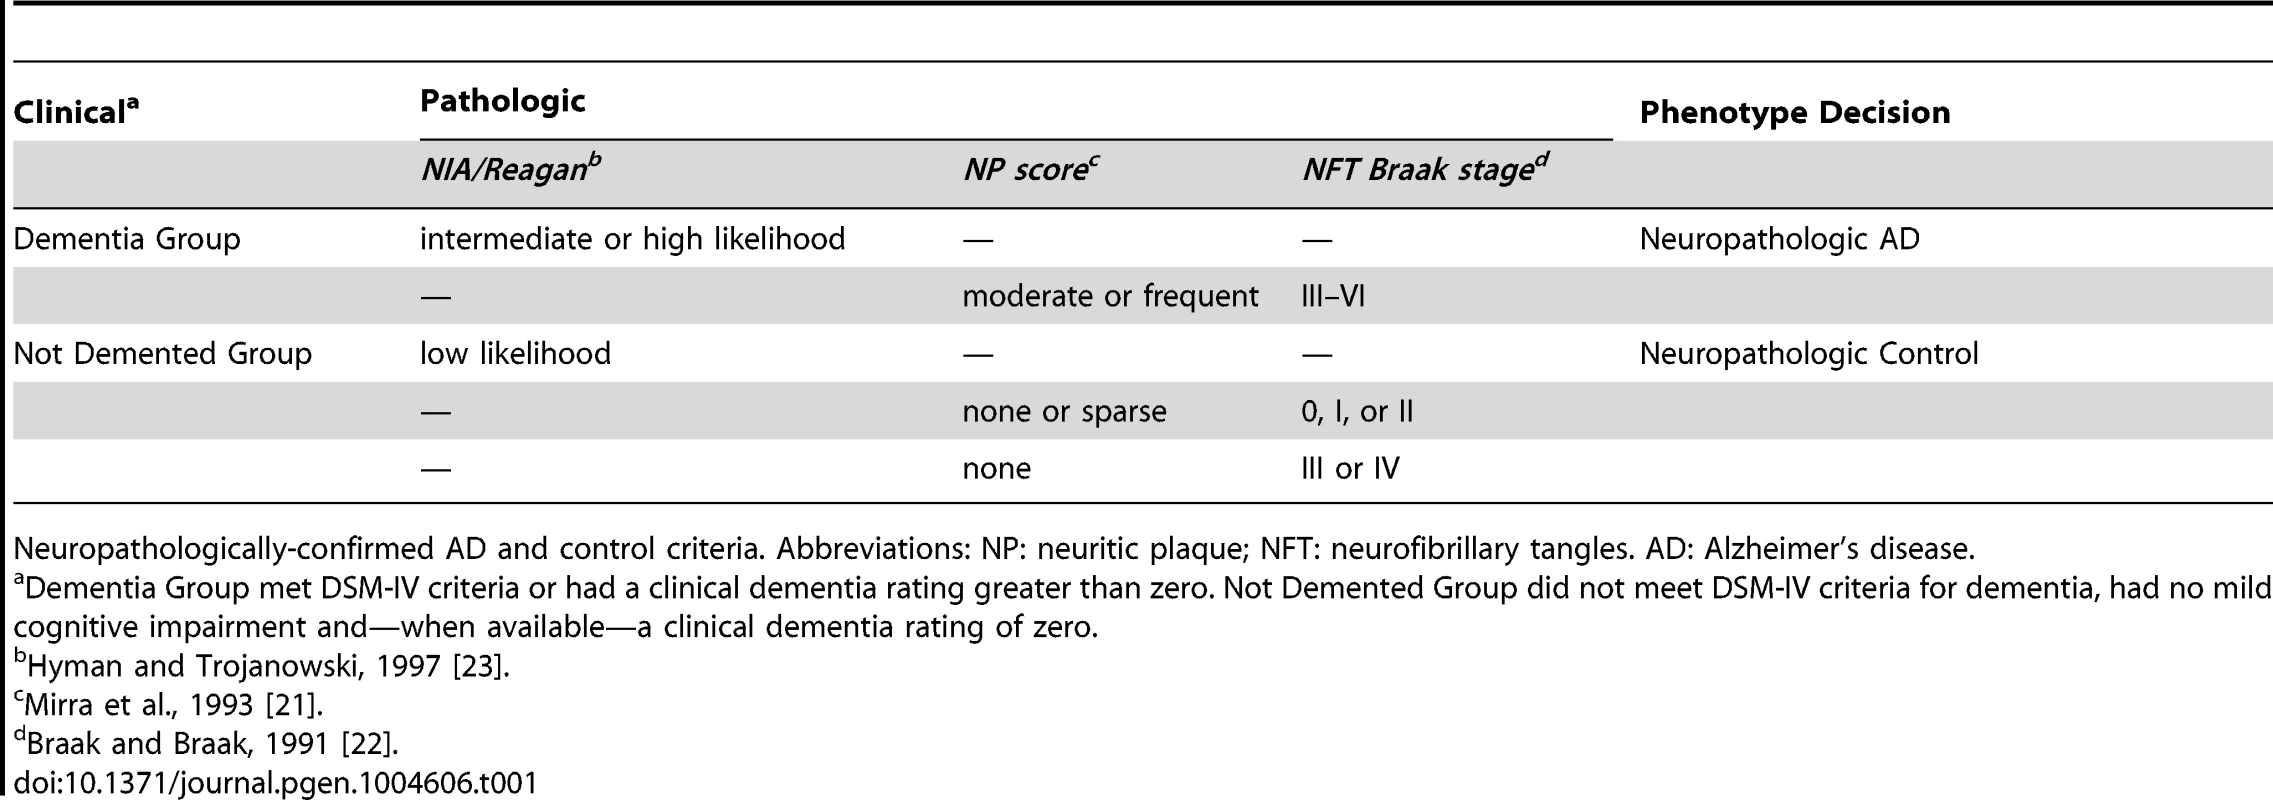
Neuropathologically-confirmed AD and control criteria. Abbreviations: NP: neuritic plaque; NFT: neurofibrillary tangles. AD: Alzheimer's disease. We also performed a GWAS of core AD pathologic changes; we performed two ordinal analyses for NFT and an “any vs. none” NP analysis (presence of NPs as one category and absence of NPs as another; see Methods). We found variants in the APOE region to be highly associated with both NPs (p-value<10−46 any-none; p-value<10−26 ordinal) and NFTs (p-value<10−46 ordinal with seven categories; p-value<10−43 ordinal with four categories) (Tables S3, S4, S5, S6, Figures S4, S5, S6, S7). Three additional loci were significantly associated with NPs in the “any vs. none” analysis: GalNAc transferase 7 (GALNT7; minimum p-value = 6.0×10⁻⁹; Figure 1), ATP-Binding Cassette, Sub-Family G (WHITE), Member 1 (ABCG1; minimum p-value = 8.0×10⁻⁹; Figure 2), and an intergenic region on chromosome 9 (minimum p-value = 4.3×10⁻⁸; Figure 3). Each of these three loci were tested in multiple datasets, and there was no evidence of heterogeneity of effect size (heterogeneity p-value>0.5 for each; Figures S8, S9, S10). These three additional loci were not significantly associated in the recent IGAP analysis (p-value>0.05). There were no additional genome-wide significant loci with the NP ordinal analysis or the NFT analyses (Tables S3, S4, S5, S6).
Fig. 1. Regional association plot for GALNT7 and the neuritic plaque (any vs. none) analysis. 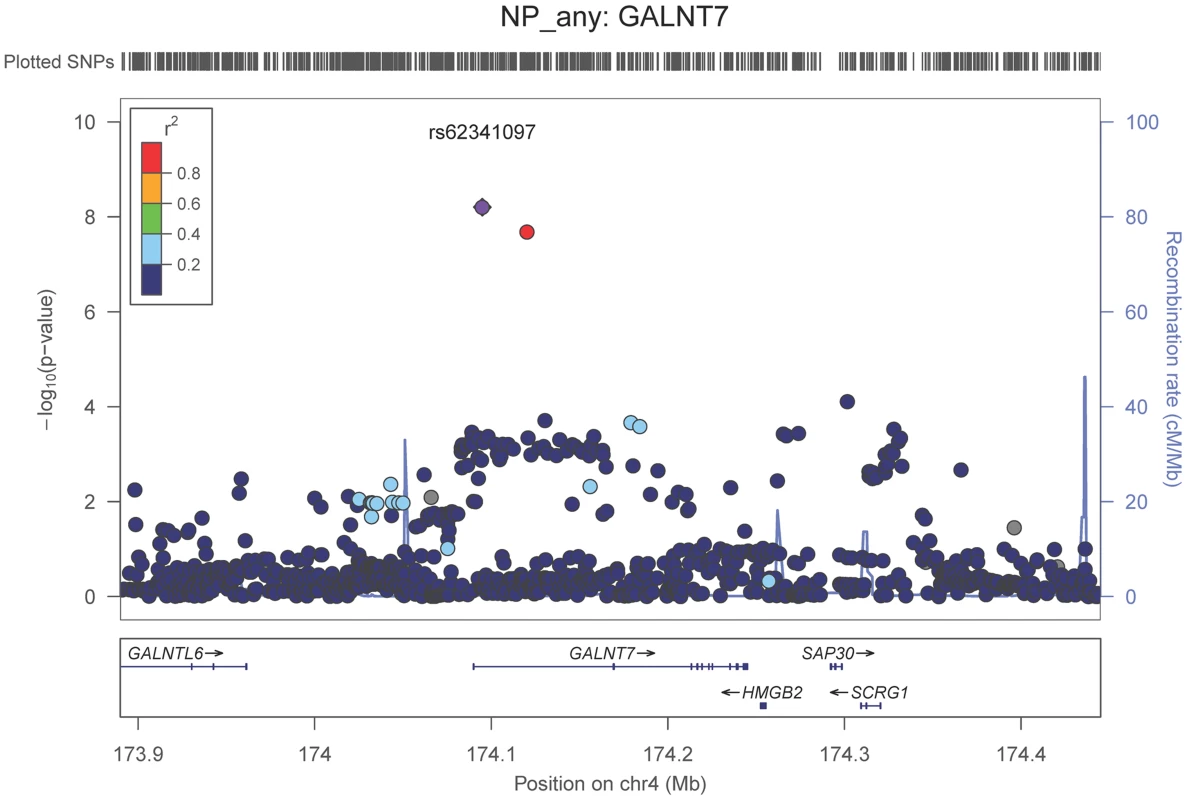
The purple dot indicates the most associated SNP in the region. The x-axis is basepair position, and y-axis is the −log(p-value), base 10. Fig. 2. Regional association plot for ABCG1 and the neuritic plaque (any vs. none) analysis. 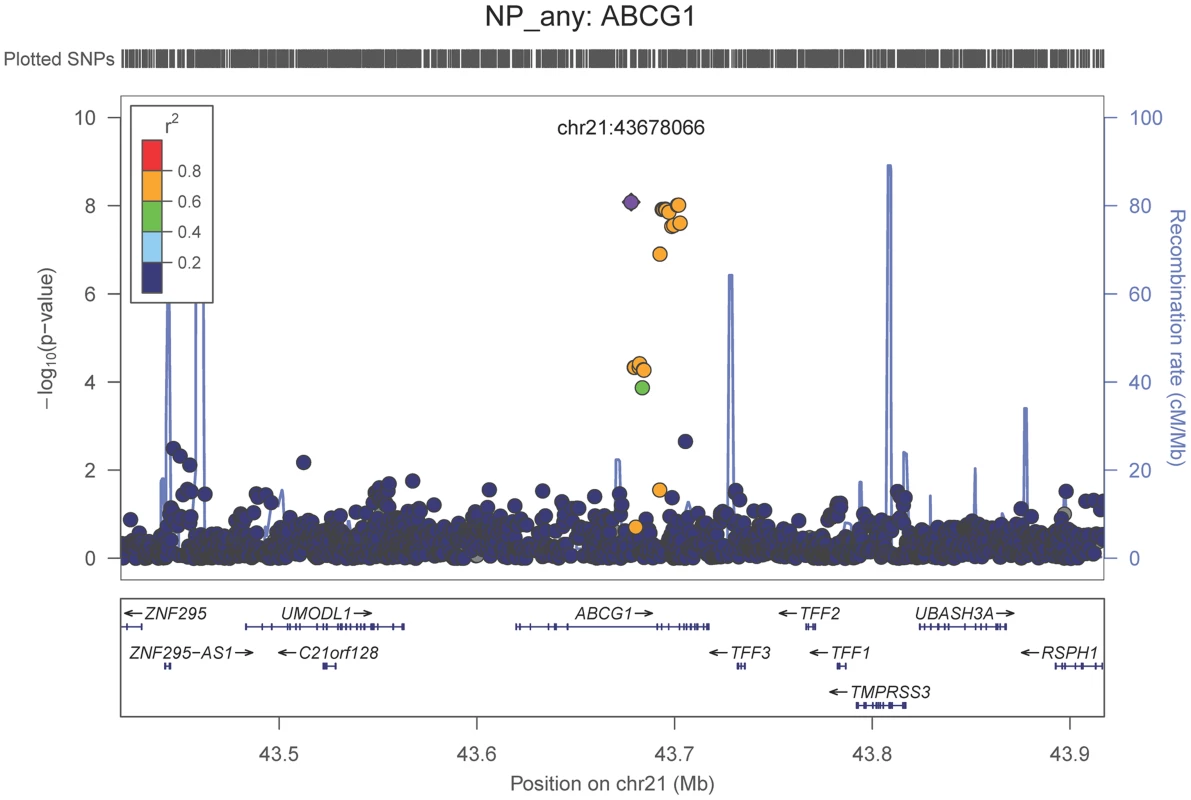
The purple dot indicates the most associated SNP in the region. The x-axis is basepair position, and y-axis is the −log(p-value), base 10. Fig. 3. Regional association plot for the chromosome 9:129,280,000–129,380,000 region and the neuritic plaque (any vs. none) analysis. 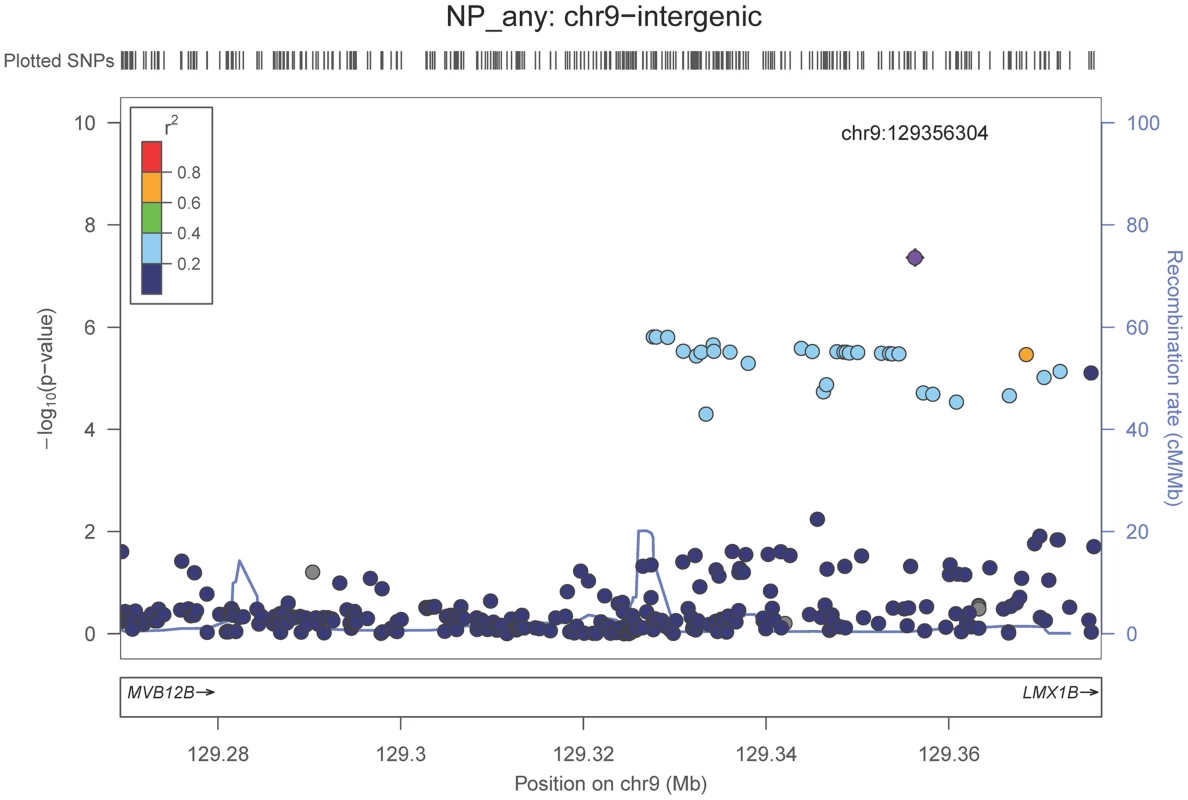
The purple dot indicates the most associated SNP in the region. The x-axis is basepair position, and y-axis is the −log(p-value), base 10. Our last GWAS was of co-morbid neuropathologic features. APOE showed significant genome wide association for both CAA (minimum p-value = 2.8×10⁻²³), and LBD (minimum p-value<1.1×10⁻¹²) but was not strongly associated with VBI or with HS (Tables S7, S8, S9, S10, S11, S12, S13; Figures S11, S12, S13, S14, S15, S16, S17). HS had significant genome-wide association with an intergenic region on chromosome 18 (minimum p-value = 4.6×10⁻⁸; Figure 4) and strong association at the Potassium Large Conductance Calcium-Activated Channel, Subfamily M, Beta Member 2 gene (KCNMB2) on chromosome 3 (minimum p-value = 7.1×10⁻⁸; Figure 5). The chromosome 18 locus was only tested in one dataset – the largest set, ADC, while the KCNMB2 locus was tested in multiple datasets and showed no evidence of heterogeneity of effect size (heterogeneity p-value>0.5; Figure S18). The chromosome 18 locus did show suggestive association with AD risk in the IGAP analysis (p-value = 0.0611) with an effect size in the same direction reported here. No other significant genome-wide association was discovered for CAA, LBD, or VBI (Table 2).
Fig. 4. Regional association plot for the chromosome 18:6,420,000–6,520,000 region and the hippocampal sclerosis (any vs. none) analysis. 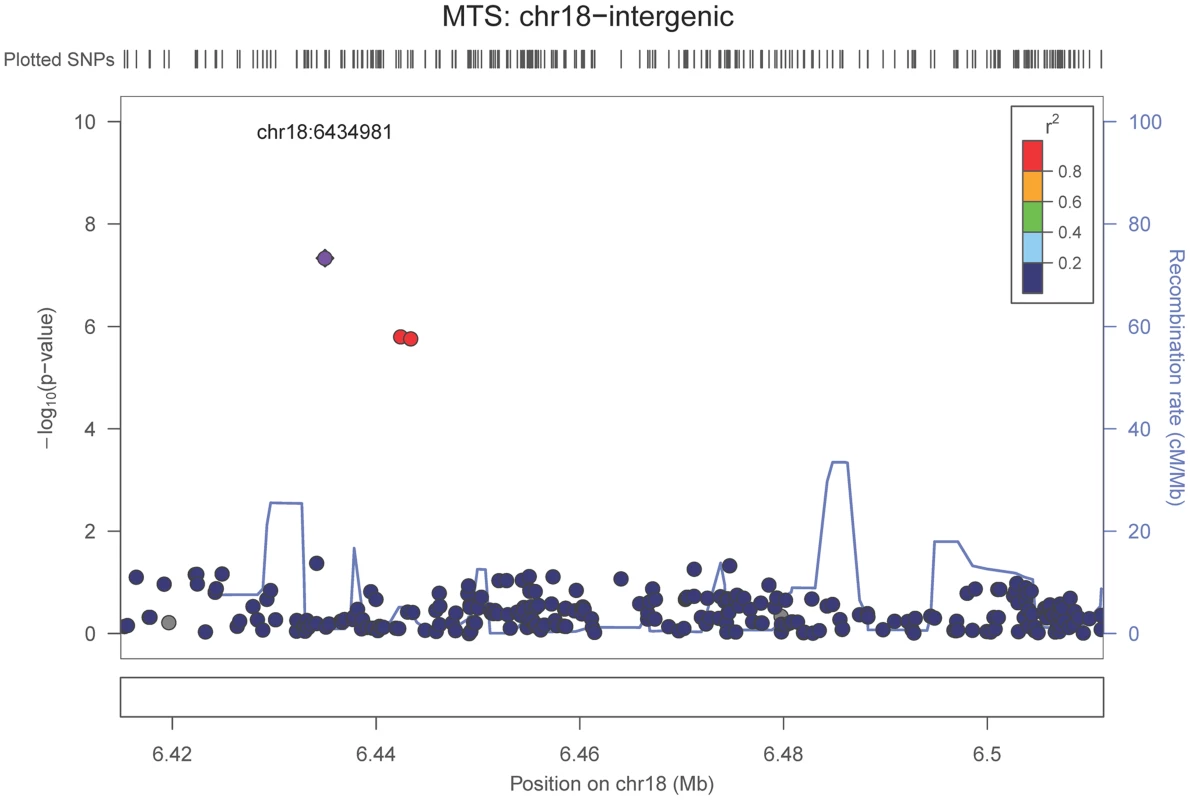
The purple dot indicates the most associated SNP in the region. The x-axis is basepair position and y-axis is the −log(p-value), base 10. Fig. 5. Regional association plot for KCNMB2 and the hippocampal sclerosis (any vs. none) analysis. 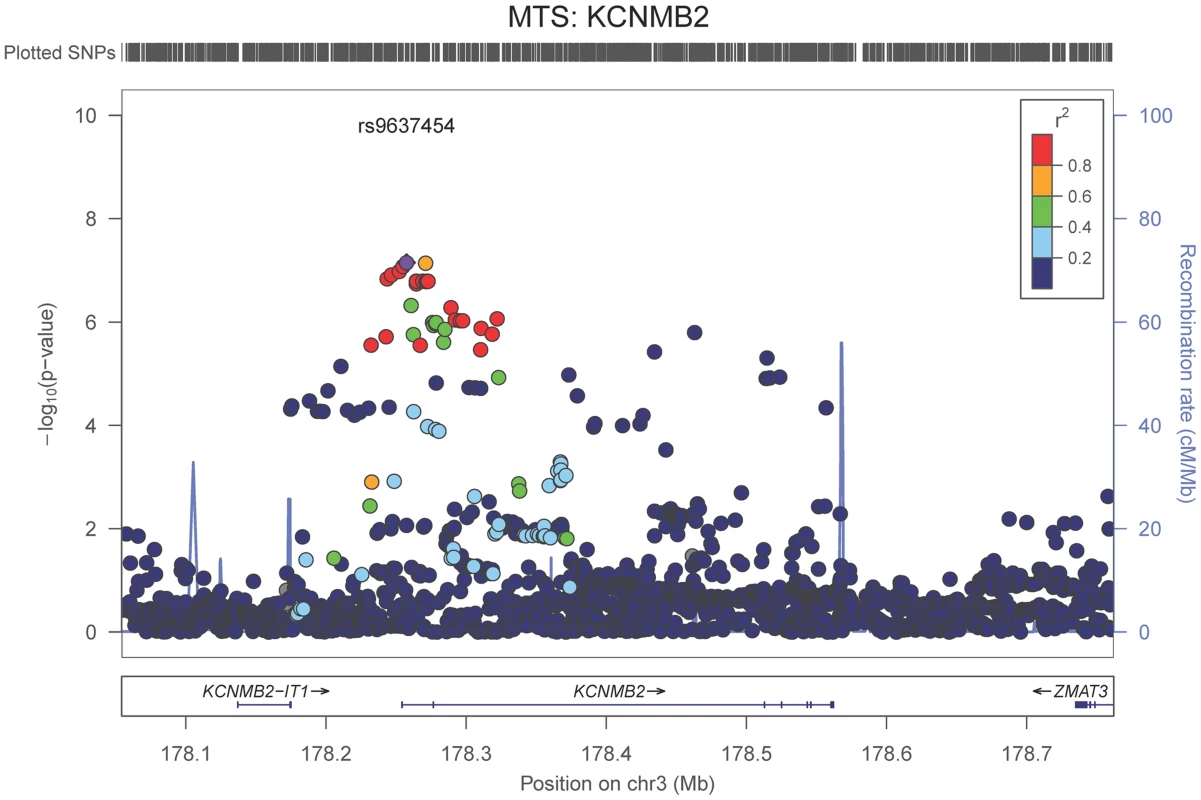
The purple dot indicates the most associated SNP in the region. The x-axis is basepair position, and y-axis is the −log(p-value), base 10. Tab. 2. Genome-wide significant results. 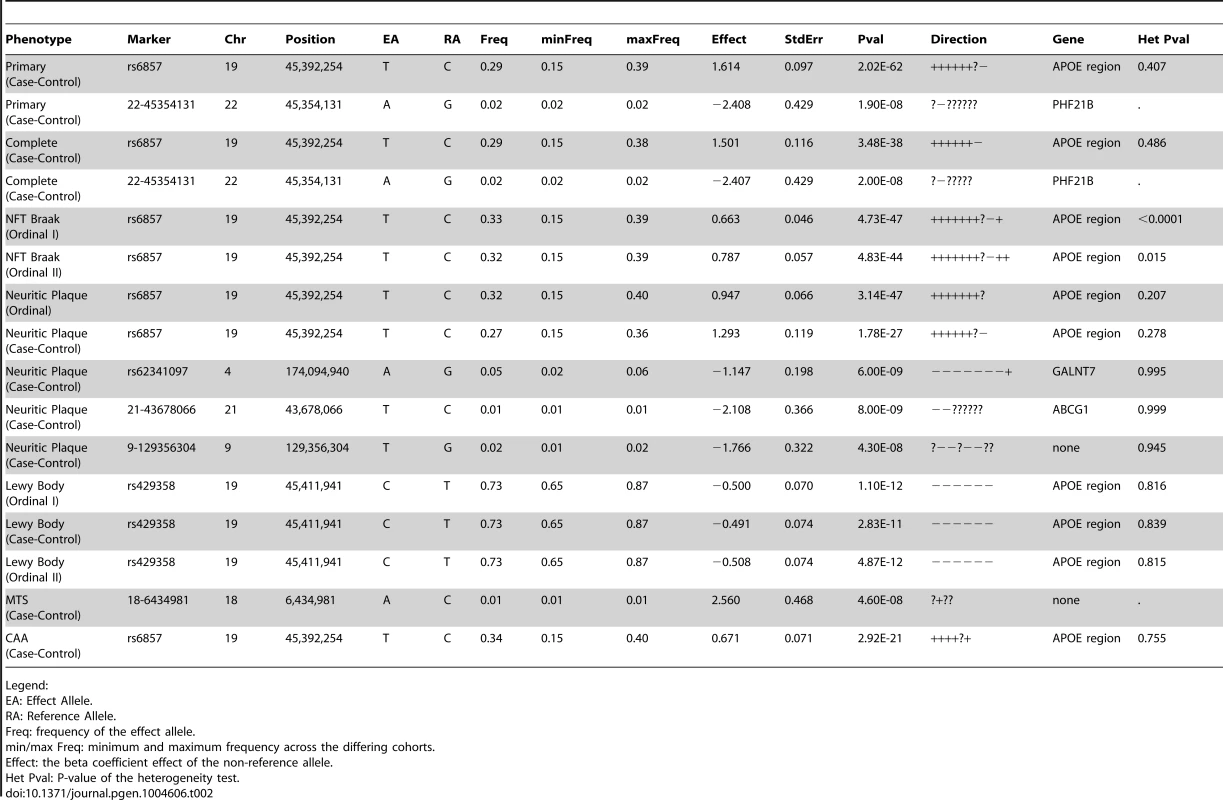
Legend: Analysis of known AD dementia genetic risk loci
The ADGC, together with international collaborators under the banner of IGAP (International Genomics of Alzheimer's Project) has to-date identified 21 common genetic loci associated with AD dementia using primarily clinically ascertained datasets [7], [8], [10], [11], in addition to confirming the APOE locus [12]. One of our goals in the study presented here was to test the hypothesis that pathologic confirmation of dementia or control status might reduce phenotypic heterogeneity and thereby enhance known genetic associations with AD dementia. We used two sets that met our clinico-pathologic criteria for case or control (Table 1): the “primary” dataset had 3887 cases and 1027 controls which allowed some incomplete documentation of pathologic features, and the “complete” dataset which had 3044 case and 658 controls with more stringent documentation standards. The primary clinico-pathologic analysis confirmed (p-value<0.05) association with 12 of the 21 previously identified [11] non-APOE loci: CR1, BIN1, CLU, MS4A6A, PICALM, ABCA7, CD33, PTK2B, SORL1, MEF2C, ZCWPW1, and CASS4; 9 of these also were confirmed in the “complete” analysis (Table 3). All loci but one (CELF1) had a consistent direction of effect with the odds ratio (OR) previously reported (Figure 6). Nine of the twelve loci confirmed in the clinico-pathologic datasets had stronger OR with AD dementia than was observed previously. This is more than would be expected at random (paired t-test p-value = 0.00029 among confirmed loci; p-value = 0.033 among all 21 non-APOE loci); OR for CLU and PTK2B were essentially unchanged from the previous report, and the OR for CR1 was reduced in our study. These results are consistent with less heterogeneity in our clinico-pathologic sample compared to studies with purely clinical ascertainment schemes. Rare variation in the recently discovered TREM2 and PLD3 genes [13], [14] was not imputed on our reference panel and as such was not assessed in this study. Some nominal association (p-value<0.05) was noted in these genes (e.g., with PLD3 and the MTS phenotype, marker 19-40373284 had a p-value = 0.006118; with TREM2 and the four category Braak phenotype, marker rs17328707 had a p-value = 0.001132, etc). However, given that over 240 markers were tested in each gene, even these minimum p-values would not withstand a gene-based multiple testing correction.
Fig. 6. Barplot of OR for known AD risk loci (all 21 loci). 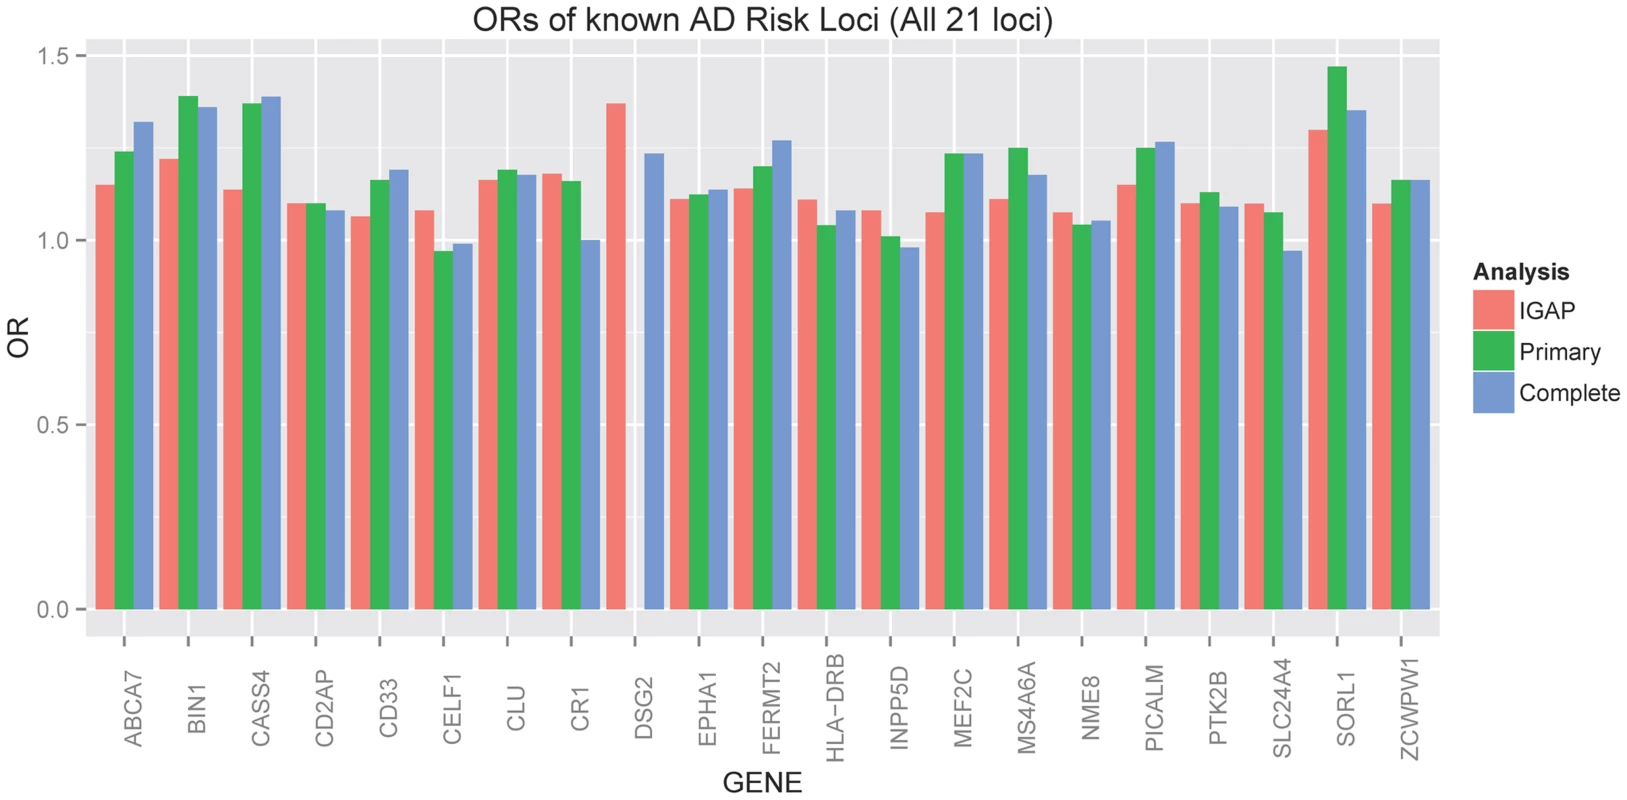
Red indicates the estimated OR previously reported through the IGAP consortium [11], green indicates the estimated OR from our primary clinico-neuropathologic case-control analysis, and blue indicates the estimated OR from a more restrictive analysis that required complete documentation of all relevant neuropathologic phenotypes. Tab. 3. Clinico-pathologic analysis of IGAP loci. 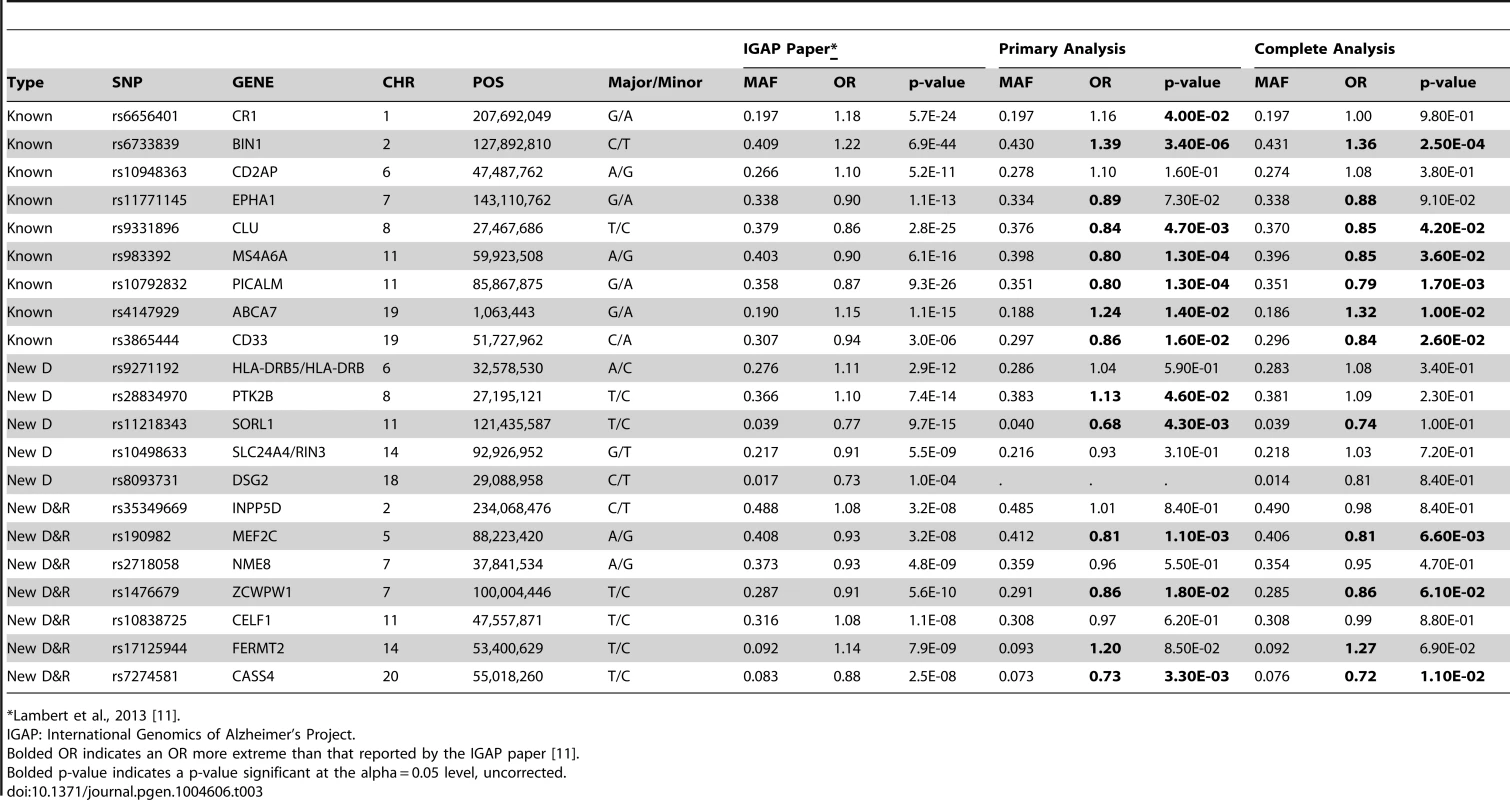
*Lambert et al., 2013 [11]. Next we tested the hypothesis that the 21 common AD loci are varyingly associated with the core AD neuropathologic features among all subjects, combining cases and controls (n = 4,914). The effect sizes for 12 of the 21 loci (11 of the 12 confirmed loci) were significantly associated with one or both of the core neuropathologic features of AD with a consistent direction of effect (). Though CR1 is associated with clinico-pathologic AD, we do not confirm the previously reported associations with NPs and CAA [15]; we do confirm the previous associations with CD2AP and ABCA7 and NPs [15]. To gain additional insight into the potential molecular drivers of specific neuropathologic features, we compared the effect sizes for risk of AD dementia (function) with the effect sizes for the two core AD neuropathologic features (structure) across these 21 loci in all subjects. Effect size estimates for both NFTs and NPs were strongly positively correlated to the previously reported effect sizes (p-value<10−6 for the NFT ordinal traits; p-value<10−6 for the NP ordinal analysis; p-value<10−4 for NP “any vs. none” analysis (Figure 7; Figure S19).
Fig. 7. Correlations of OR for known AD risk loci and the neuropathology phenotypes. 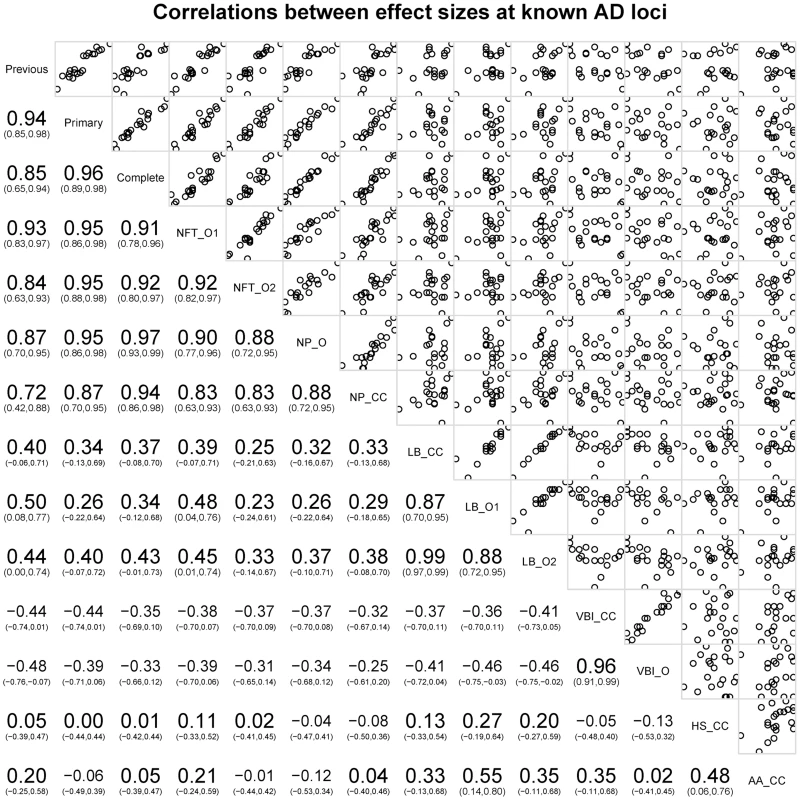
Bottom left indicates the magnitude, direction, and confidence interval of the correlation. Top right shows plots of the data points against each other. The diagonal box indicates the phenotypes; off-diagonal boxes indicate the correlations of the OR for the corresponding phenotypes. The co-incident neuropathologic features showed only nominal association with the known AD loci (Table S15). LBD (n = 3526) was nominally associated with MEF2C with effect sizes similar to both NFTs and NPs. LBD was also nominally associated with SORL1, with an effect size direction opposite that previously reported for AD dementia. HS (n = 2866) was nominally associated with PTK2B; VBI (n = 2940) showed nominal association at NME8; CAA (n = 2807) showed no association with any of the previously reported loci. We next compared the co-morbid neuropathologic features effect size estimates to the known AD risk effects (Figure 7). While the core AD feature effect sizes showed strong, positive correlations with the previously reported effect sizes, the picture at co-morbid features was more complicated. LBD effect sizes showed weak moderate positive correlations with the previously reported effect sizes (Figure S20; slope p-value = 0.035), while VBI showed a moderate negative correlation with the previously reported AD dementia effect sizes (Figure S21; slope p-value = 0.0292). To test if these correlations had to do with the study ascertainment scheme, we repeated the analysis but using cases only; in the case-only set LBD effect sizes were no longer correlated with the previously reported effect sizes (p-value = 0.86), while the correlation of the VBI effect sizes with those previously reported was stronger (p-value = 4.22×10⁻⁴) (Figures S20, S21).
Finally, we compared NP effect sizes against the effect sizes for NFTs and CAA at each of these loci; we observed a strong, positive, and linear association between effect sizes of NPs and NFTs, but no correlation between NPs and CAA (Figure 7).
Discussion
Cognitive impairment among older individuals is a complex convergent trait that often occurs with mixed pathology: AD, LBD, and VBI, which each have prevalent prodromal and latent stages in addition to full clinical expression as dementia. Indeed, approximately 95% of subjects without dementia in this age group have some pathologic evidence of at least one of these three diseases. These facts as first discovered in neuropathologic studies of brain aging and subsequently validated in part by neuroimaging and biomarker studies present serious challenges to diagnose accurately and comprehensively the diseases that cause an individual's dementia based exclusively on clinical data, and clearly demonstrate that age-matched control populations are variably, and potentially extensively, “contaminated” with latent disease. Virtually all previous GWAS of AD have been based on cases and controls defined exclusively by clinical criteria. To address this limitation, we undertook a GWAS of dementia that focused on neuropathologic data (i) to test the hypothesis that clinico-pathologic characterization of cases and controls could be used to strengthen previous genetic associations with AD made by clinical criteria, (ii) to test the hypothesis that genetic associations for AD dementia will selectively align with specific neuropathologic features, and (iii) to discover new genetic associations with neuropathologic features of AD and related dementias.
Although we assembled a large brain autopsy cohort, it is still a relatively modest number of samples for GWAS compared to the larger IGAP GWAS where subjects were primarily clinically diagnosed cases and controls. The reduction in statistical power due to a smaller sample must be balanced against improved phenotypic homogeneity. With this balance in mind, our study confirmed 12 of the 21 previously reported loci as significantly associated with AD dementia. Our association with clinico-pathologic AD dementia was strengthened for 9 of these 12 loci (ABCA7, BIN1, CASS4, CD33, MEF2C, MS4A6A, PICALM, SORL1, and ZCWPW1), essentially unchanged for CLU and PYK2B, and diminished for CR1 to unity with increasingly stringent pathologic criteria. CR1 also is the only locus that we confirmed as associated with AD dementia that was not significantly associated with a specific neuropathologic feature. One possible explanation is that previous associations of CR1 with AD dementia may be related more to clinical expression of disease rather than to the accumulation of NPs and NFTs; it is of note though that CR1 has been associated with NPs and CAA previously [15]. The same may be true for the other 9 loci that were not confirmed in our clinico-pathologic case-control analysis; however, lack of confirmation also may be the result of limitations of smaller sample size outweighing the potential advantages of reduced phenotypic heterogeneity or perhaps even spurious associations in previous studies.
Clinical expression of dementia encompasses at least several processes that include disease mechanisms that produce stress and injury, response to injury, physiologic compensation, and cognitive reserve. Our second major goal was to determine the alignment between AD dementia genetic risk loci and specific neuropathologic features that are core to (NPs and NFTs) or co-morbid with (LBD, VBI, HS, CAA) AD in an attempt to clarify the relevant molecular mechanisms that underlie these characteristic lesions that are related to injury and response to injury. Association tests for NFTs and NPs were significant for five of the previously reported loci that were validated in our clinico-pathologic GWAS (ABCA7, BIN1, CASS4, MEF2C, and PICALM); NFTs were specifically associated with CLU, SORL1, and ZCWPW1, and NPs were specifically associated with MS4A6A and CD33. In all instances the effect sizes for NPs or NFTs were in the same direction as the previously reported effects for AD dementia. Effects sizes for LBD were increased with SORL1 and decreased with MEF2C, and HS was associated with PTK2B; no significant association was observed between previously reported AD dementia loci and VBI or CAA. Association of LBD with SORL1 locus is novel and, interestingly, the effect size was in the direction opposite to its association with NFTs. The SORL1 locus has not been identified in previous studies of Parkinson's disease (PD), another LBD, but these were investigations of PD defined by its movement disorder rather than LBD in the context of AD dementia as we have done here; this unexpected association will require replication and further investigation. We analyzed NPs and NFTs as binary (any vs. none) and finer graded (ordinal) phenotypes; stronger associations were observed with binary analyses perhaps because of variation in assigning histopathologic stages to these characteristic AD lesions.
We observed a linear correlation between the previously reported AD dementia effect sizes and the effect sizes for NPs and NFTs determined in our cohort whether we included all 21 IGAP loci or limited our analysis to the 12 loci confirmed in our clinico-pathologic investigation. We do not think this is a foregone conclusion. Indeed, the literature is replete with commentary that one or both of the core AD lesions are a product of brain aging rather than AD. Our results strongly support the view that the molecular drivers underlying the accumulation of NPs and NFTs in brain are largely shared with the molecular drivers of severely impaired cognitive function. Interestingly, there was not a significant correlation with CAA, suggesting that this other form of amyloidosis has a different genetic risk profile than NP accumulation. Using the same approach, correlation of effect sizes for IGAP loci with effect sizes for LBD was at best weakly positive, and for VBI was negative. This last observation was unexpected and, if validated, might indicate that the genetic risk architecture for AD and VBI are inversely related, an intriguing possibility that stimulates speculation over why this may be. It also suggests a possible approach to genetic stratification of risk for two of the most common causes of cognitive impairment and dementia in older individuals.
Our third goal was genome-wide discovery of associations with the six neuropathologic features to gain additional insights into the molecular drivers of these characteristic lesions. As expected, there was a very strong association of the APOE locus with our clinico-pathologically defined AD dementia. We observed a strong association between the APOE locus and NFTs, NPs, CAA, and LBD, but not with HS or VBI. While the association of APOE with both core features and a secondary neuropathologic feature of AD is expected from ascertainment bias, the association with LBD may not be so simple. Indeed, an association between APOE and Dementia with Lewy bodies (DLB) has been varyingly supported or refuted in several smaller studies that did not include pathologic evaluation to exclude contribution from unknown and likely varying amounts of AD. However, in a recent large study of DLB and PD dementia that included pathologic evaluation, we demonstrated that inheritance of APOE ε4 allele is a significant risk factor for DLB even in the absence of AD [16]. In addition, our GWAS showed a genome-wide significant association between NPs and ABCG1, a locus previously implicated in AD [17]. The association of NPs with GALNT7 is novel and potentially reinforces existing genetic associations with other genes that encode for members of this family of transferases. Indeed, alteration in the O-glycosylation pattern of amyloid beta peptides and NPs has been reported in AD [18]–[20]. Finally, we made a novel association of HS with a variant of KCMNB2, which encodes a subunit of a Ca++-gated K+ channel that is key to neuronal excitability and is highly expressed by hippocampal pyramidal neurons in sector CA1. Although this discovery requires validation, it may have significance beyond AD dementia since HS also occurs frequently in some forms of fronto-temporal dementia. While additional replication datasets are ideal for these novel loci, we do note that the meta-analysis approach here is a type of replication, and that all of the novel variants with support from multiple datasets had no signs of heterogeneity of effect size.
In summary, this genetic association study of autopsy brain enhanced some and diminished other known genetic risk loci for AD dementia, highlighted a subset of the loci previously associated with AD dementia as potential molecular drivers of specific neuropathologic features of AD, and discovered new genetic loci associated with specific neuropathologic features. These novel results provide new insights into new candidate therapeutic targets for AD and related dementias that will require validation and functional investigation.
Methods
Sample selection
Samples were contributed by the National Institute on Aging (NIA) Alzheimer's Disease Centers (ADCs) and ADGC-collaborating studies. The ADC dataset includes samples ascertained and evaluated by the Clinical and Neuropathology Cores of the 29 NIA-funded ADCs. The National Alzheimer's Coordinating Center (NACC) organizes a collection of phenotype data from the ADCs, organizes its database, coordinates implementation of definitions of AD cases and controls, and oversees collection and distribution of samples.
The ADGC collaborating studies include the Adult Changes in Thought study (ACT; Eric B. Larson, PI), the Mayo Clinic Alzheimer's Disease Research Center (MAYO; Steven G. Younkin, PI), the University of Miami Brain Endowment Bank (MBB; Deborah Mash, PI), the National Institute on Aging Late-Onset Alzheimer's Disease Family Study (NIA-LOAD; Richard Mayeux, PI), the Oregon Health & Science University Alzheimer's Disease Center (OHSU; Patricia Kramer, PI), the Religious Orders Study and Memory and Aging Project (ROSMAP; David Bennett, PI), the Translational Genomics Research Institute (TGEN; Eric Reiman, PI), the University of Pittsburgh Alzheimer's Disease Research Center (UP; Kamboh, PI), the University of Miami Hussman Institute for Human Genomics (UM; Pericak-Vance, PI), the Vanderbilt University Center for Human Genetics Research (VU; Jonathan Haines, PI), and the Mount Sinai School of Medicine (MSSM; Joseph Buxbaum PI) (see Table S16 for details; descriptive statistics found in Table S17).
All samples had thorough neuropathologic examination according to consensus criteria that existed at the time that our study was initiated. Prior to analysis, neuropathologic data were reviewed and harmonized by a single neuropathologist (TJM) to ensure consistency across assessment sites.
Neuropathology methods and eligibility criteria
Samples were evaluated at each site. Assessment of NPs and NFTs followed the protocols of CERAD [21], and Braak and Braak [22], respectively, at all sites. Criteria for assessment of co-morbid features were reviewed with each site and only those using comparable methods, i.e., immunohistochemistry for alpha-synuclein to detect LBs, and similar sampling protocols were included in our analyses. For inclusion as a case, the subject must have been diagnosed with dementia (DSM-IV criteria or clinical dementia rating greater than zero) and the subject's autopsy must have either NIA/Reagan classification of intermediate or high likelihood of AD [23], or have an NP score of moderate/frequent and NFT Braak stage of III–VI. For inclusion as a neuropathologically-confirmed control, each subject must not have had a clinical diagnosis of dementia or MCI within two years of death (does not meet DSM-IV criteria for dementia, no mild cognitive impairment, and—when available—clinical dementia rating of zero), no diagnosis of other neurologic disease by clinical or neuropathologic evaluation, and must have had low likelihood of AD by NIA/Reagan criteria, or none/sparse NPs and NFT Braak stage of 0, I, or II. If no NPs were identified, then an NFT Braak stage III or IV was accepted in the control group (Table 2). In total 5,981 samples were eligible for inclusion in our analyses.
Core AD neuropathologic phenotypes
The core AD neuropathologic phenotypes analyzed were NFTs and NPs. NFTs were analyzed in two well-established ordinal rankings (seven Braak stages: none, I, II, III, IV, V, and VI; and four Braak groups: none, transentorhinal, limbic, isocortical). NPs were analyzed with one ordinal ranking (four CERAD scores: none, sparse, moderate, frequent) and a presence vs. absence (any NPs vs. no NPs) analysis. Sample sizes by cohort are described in Table S18.
Co-morbid neuropathologic phenotypes
There were four co-morbid neuropathologic phenotypes analyzed: LBD, VBI, HS, CAA. LBD was analyzed with two ordinal rankings (five categories: none, brainstem-predominant, limbic, neocortical, and other regions or not specified; three categories: none, brainstem-predominant, and all other regions or not specified) and a presence vs. absence (any LBD vs. no LBD) analysis. VBI was analyzed in an ordinal ranking (three categories: none, any microinfarcts, any lacunar or territorial infarcts) and in a presence vs. absence (any VBI vs. no VBI) analysis. HS and CAA were both analyzed using presence vs. absence analyses. Sample sizes by cohort are described in Table S18.
Clinico-pathologic AD dementia phenotypes
Additionally, we performed a case/control analysis of clinico-pathologic AD dementia. That is, cases had clinical dementia with core AD neuropathologic changes, and controls were not clinically demented and had none or minimal AD neuropathologic changes. Two “case-control” datasets were considered. For the “primary” dataset, all cases and controls were included, regardless of the documentation from the primary neuropathologist. The secondary dataset (“complete” dataset) required more thorough documentation of the neuropathologic assessment, including documentation of the NIA/Reagan assessment or complete documentation of both the NFT Braak stage and the NP score. Sample sizes by cohort are described in Table S18.
Genotyping and quality control (QC)
Genotyping for the ADC samples was performed at the Children's Hospital of Pennsylvania on the Illumina 660k beadchip. Genotyping of ADGC collaborating centers was performed on a variety of genotyping platforms and is described in Naj et al 2011 [8]. QC and statistical analyses are summarized in Figure S22. Preliminary QC includes checks for sample relatedness, sex inconsistency, sample missingness, and principal components analysis of genotype data to confirm the sample's race, and is described by Naj and colleagues [8], [24], [25]. The top principal components were further used as covariates in the association analysis (see below).
Genotype imputation and final QC
To infer genotypes at loci not on the genotyping chips, we used IMPUTE v2 software [26] in all datasets, using the 1,000 Genomes Project data as a reference [27]. Imputation and imputation QC were performed independently across the different datasets, but with all using the December 2010 release of the 1,000 Genomes Data. For inclusion in the statistical analysis, variants must have high quality imputation (IMPUTE info score greater than 0.40 and a dosage variance greater than 0.0198 (the estimated variance of a 1% MAF SNP). We also required an MAF>1% (estimated based on dosage data) as the study is not well-powered for low frequency variants.
Statistical analysis
See Supporting Material for an overview of analyses. For binary traits, logistic regression was used, with principal components 1–3 included as covariates to account for population substructure; the analysis was performed using PLINK genetic analysis software [24]. For ordinal traits, we used polytomous logistic regression with principal components 1–3 included as covariates to account for population substructure; the analysis was performed with the polr function (part of the MASS package [28]) in the R statistical analysis software (http://www.r-project.org/). Polytomous logistic regression is an extension of logistic regression that allows for analysis of categorical data. As these data were either binary or ordinal, we used the proportional odds assumption to obtain a single effect-size estimate for each SNP for each of the ordinal traits.
Association analysis was performed within each cohort separately, and results were meta-analyzed across cohorts. Because some datasets had small sample size or had incomplete phenotyping, we only considered a set for a particular analysis if that set had at least two categories with at least five individuals in each category. That is, for binary traits the set had to include both cases and controls. For categorical traits, the set had to have at least two categories on which analysis could be performed. The sets included (and categories used) in the particular analyses are described in Table S8. After the within dataset association analysis, we used METAL [29], to meta-analyze result across datasets, weighting each effect size by the inverse of the variance estimated from the logistic or polytomous logistic regression analyses, and to calculate heterogeneity statistics for each meta-analysis. QQ-plots for each trait are included (see supporting material).
To compare effect sizes at previously identified AD loci, we performed linear regression and correlation analyses of the estimated effect sizes (and OR) at the loci. Regression was performed using the R statistical software with the “glm” function [30], and the “corrgrams” package [31]. As linear regression in small datasets can be heavily influenced by outliers, we removed the outliers (plus or minus 3 standard deviations from the mean) prior to regression and correlation analyses.
Supporting Information
Zdroje
1. SonnenJA, LarsonEB, CranePK, HaneuseS, LiG, et al. (2007) Pathological correlates of dementia in a longitudinal, population-based sample of aging. Ann Neurol 62 : 406–413.
2. SonnenJA, Santa CruzK, HemmyLS, WoltjerR, LeverenzJB, et al. (2011) Ecology of the aging human brain. Arch Neurol 68 : 1049–1056.
3. JackCRJr, KnopmanDS, JagustWJ, ShawLM, AisenPS, et al. (2010) Hypothetical model of dynamic biomarkers of the Alzheimer's pathological cascade. Lancet Neurol 9 : 119–128.
4. HurdMD, MartorellP, DelavandeA, MullenKJ, LangaKM (2013) Monetary costs of dementia in the United States. N Engl J Med 368 : 1326–1334.
5. JunG, NajAC, BeechamGW, WangLS, BurosJ, et al. (2010) Meta-analysis confirms CR1, CLU, and PICALM as alzheimer disease risk loci and reveals interactions with APOE genotypes. Arch Neurol 67 : 1473–1484.
6. NajAC, BeechamGW, MartinER, GallinsPJ, PowellEH, et al. (2010) Dementia revealed: novel chromosome 6 locus for late-onset Alzheimer disease provides genetic evidence for folate-pathway abnormalities. PLoS Genet 6: e1001130.
7. HollingworthP, HaroldD, SimsR, GerrishA, LambertJC, et al. (2011) Common variants at ABCA7, MS4A6A/MS4A4E, EPHA1, CD33 and CD2AP are associated with Alzheimer's disease. Nat Genet 43 : 429–435.
8. NajAC, JunG, BeechamGW, WangLS, VardarajanBN, et al. (2011) Common variants at MS4A4/MS4A6E, CD2AP, CD33 and EPHA1 are associated with late-onset Alzheimer's disease. Nat Genet 43 : 436–441.
9. JunG, VardarajanBN, BurosJ, YuCE, HawkMV, et al. (2012) Comprehensive search for Alzheimer disease susceptibility loci in the APOE region. Arch Neurol 69 : 1270–1279.
10. MiyashitaA, KoikeA, JunG, WangLS, TakahashiS, et al. (2013) SORL1 is genetically associated with late-onset Alzheimer's disease in Japanese, Koreans and Caucasians. PLoS One 8: e58618.
11. LambertJC, Ibrahim-VerbaasCA, HaroldD, NajAC, SimsR, et al. (2013) Meta-analysis of 74,046 individuals identifies 11 new susceptibility loci for Alzheimer's disease. Nat Genet 45 : 1452–1458.
12. CorderEH, SaundersAM, StrittmatterWJ, SchmechelDE, GaskellPC, et al. (1993) Gene dose of apolipoprotein E type 4 allele and the risk of Alzheimer's disease in late onset families. Science 261 : 921–923.
13. BenitezBA, JinSC, GuerreiroR, GrahamR, LordJ, et al. (2014) Missense variant in TREML2 protects against Alzheimer's disease. Neurobiol Aging 35 : 1510.e1519–1526.
14. CruchagaC, KarchCM, JinSC, BenitezBA, CaiY, et al. (2014) Rare coding variants in the phospholipase D3 gene confer risk for Alzheimer's disease. Nature 505 : 550–554.
15. ShulmanJM, ChenK, KeenanBT, ChibnikLB, FleisherA, et al. (2013) Genetic susceptibility for Alzheimer disease neuritic plaque pathology. JAMA Neurol 70 : 1150–1157.
16. TsuangD, LeverenzJB, LopezOL, HamiltonRL, BennettDA, et al. (2013) APOE epsilon4 increases risk for dementia in pure synucleinopathies. JAMA Neurol 70 : 223–228.
17. WollmerMA, SleegersK, IngelssonM, ZekanowskiC, BrouwersN, et al. (2007) Association study of cholesterol-related genes in Alzheimer's disease. Neurogenetics 8 : 179–188.
18. EspinosaB, GuevaraJ, HernandezP, SlomiannyMC, GuzmanA, et al. (2003) Characterization of an O-glycosylated plaque-associated protein from Alzheimer disease brain. J Neuropathol Exp Neurol 62 : 34–41.
19. ArigaT, KobayashiK, HasegawaA, KisoM, IshidaH, et al. (2001) Characterization of high-affinity binding between gangliosides and amyloid beta-protein. Arch Biochem Biophys 388 : 225–230.
20. GraebertKS, PoppGM, KehleT, HerzogV (1995) Regulated O-glycosylation of the Alzheimer beta-A4 amyloid precursor protein in thyrocytes. Eur J Cell Biol 66 : 39–46.
21. MirraSS, HartMN, TerryRD (1993) Making the diagnosis of Alzheimer's disease. A primer for practicing pathologists. Arch Pathol Lab Med 117 : 132–144.
22. BraakH, BraakE (1991) Neuropathological stageing of Alzheimer-related changes. Acta Neuropathol 82 : 239–259.
23. HymanBT, TrojanowskiJQ (1997) Consensus recommendations for the postmortem diagnosis of Alzheimer disease from the National Institute on Aging and the Reagan Institute Working Group on diagnostic criteria for the neuropathological assessment of Alzheimer disease. J Neuropathol Exp Neurol 56 : 1095–1097.
24. PurcellS, NealeB, Todd-BrownK, ThomasL, FerreiraMA, et al. (2007) PLINK: a tool set for whole-genome association and population-based linkage analyses. Am J Hum Genet 81 : 559–575.
25. PriceAL, PattersonNJ, PlengeRM, WeinblattME, ShadickNA, et al. (2006) Principal components analysis corrects for stratification in genome-wide association studies. Nat Genet 38 : 904–909.
26. MarchiniJ, HowieB, MyersS, McVeanG, DonnellyP (2007) A new multipoint method for genome-wide association studies by imputation of genotypes. Nat Genet 39 : 906–913.
27. AbecasisGR, AutonA, BrooksLD, DePristoMA, DurbinRM, et al. (2012) An integrated map of genetic variation from 1,092 human genomes. Nature 491 : 56–65.
28. Venables W, Ripley D (2003) Modern Applied Statistics with S. New York: Springer. 497 p.
29. WillerCJ, LiY, AbecasisGR (2010) METAL: fast and efficient meta-analysis of genomewide association scans. Bioinformatics 26 : 2190–2191.
30. Hastie T, Pregibon D (1992) Generalized linear models. In: Chambers J, Hastie T, editors. Statistical Models in S. Pacific Grove, CA: Wadsworth & Brooks/Cole. pp. 195–246.
31. FriendlyM (2002) Corrgrams: Exploratory displays for correlation matrices. American Statistician 56 : 316–324.
Štítky
Genetika Reprodukční medicína
Článek An Evolutionarily Conserved Role for the Aryl Hydrocarbon Receptor in the Regulation of MovementČlánek Requirement for Drosophila SNMP1 for Rapid Activation and Termination of Pheromone-Induced ActivityČlánek Co-regulated Transcripts Associated to Cooperating eSNPs Define Bi-fan Motifs in Human Gene NetworksČlánek Identification of a Regulatory Variant That Binds FOXA1 and FOXA2 at the Type 2 Diabetes GWAS LocusČlánek tRNA Modifying Enzymes, NSUN2 and METTL1, Determine Sensitivity to 5-Fluorouracil in HeLa CellsČlánek Derlin-1 Regulates Mutant VCP-Linked Pathogenesis and Endoplasmic Reticulum Stress-Induced ApoptosisČlánek A Genetic Assay for Transcription Errors Reveals Multilayer Control of RNA Polymerase II FidelityČlánek The Proprotein Convertase KPC-1/Furin Controls Branching and Self-avoidance of Sensory Dendrites inČlánek Regulation of p53 and Rb Links the Alternative NF-κB Pathway to EZH2 Expression and Cell SenescenceČlánek BMPs Regulate Gene Expression in the Dorsal Neuroectoderm of and Vertebrates by Distinct MechanismsČlánek Unkempt Is Negatively Regulated by mTOR and Uncouples Neuronal Differentiation from Growth Control
Článek vyšel v časopisePLOS Genetics
Nejčtenější tento týden
2014 Číslo 9
-
Všechny články tohoto čísla
- Translational Regulation of the Post-Translational Circadian Mechanism
- An Evolutionarily Conserved Role for the Aryl Hydrocarbon Receptor in the Regulation of Movement
- Eliminating Both Canonical and Short-Patch Mismatch Repair in Suggests a New Meiotic Recombination Model
- Requirement for Drosophila SNMP1 for Rapid Activation and Termination of Pheromone-Induced Activity
- Co-regulated Transcripts Associated to Cooperating eSNPs Define Bi-fan Motifs in Human Gene Networks
- Targeted H3R26 Deimination Specifically Facilitates Estrogen Receptor Binding by Modifying Nucleosome Structure
- Role for Circadian Clock Genes in Seasonal Timing: Testing the Bünning Hypothesis
- The Tandem Repeats Enabling Reversible Switching between the Two Phases of β-Lactamase Substrate Spectrum
- The Association of the Vanin-1 N131S Variant with Blood Pressure Is Mediated by Endoplasmic Reticulum-Associated Degradation and Loss of Function
- Identification of a Regulatory Variant That Binds FOXA1 and FOXA2 at the Type 2 Diabetes GWAS Locus
- Regulation of Flowering by the Histone Mark Readers MRG1/2 via Interaction with CONSTANS to Modulate Expression
- The Actomyosin Machinery Is Required for Retinal Lumen Formation
- Plays a Conserved Role in Assembly of the Ciliary Motile Apparatus
- Hidden Diversity in Honey Bee Gut Symbionts Detected by Single-Cell Genomics
- Ribosome Rescue and Translation Termination at Non-Standard Stop Codons by ICT1 in Mammalian Mitochondria
- tRNA Modifying Enzymes, NSUN2 and METTL1, Determine Sensitivity to 5-Fluorouracil in HeLa Cells
- Causal Variation in Yeast Sporulation Tends to Reside in a Pathway Bottleneck
- Tissue-Specific RNA Expression Marks Distant-Acting Developmental Enhancers
- WC-1 Recruits SWI/SNF to Remodel and Initiate a Circadian Cycle
- Clonal Expansion of Early to Mid-Life Mitochondrial DNA Point Mutations Drives Mitochondrial Dysfunction during Human Ageing
- Methylation QTLs Are Associated with Coordinated Changes in Transcription Factor Binding, Histone Modifications, and Gene Expression Levels
- Differential Management of the Replication Terminus Regions of the Two Chromosomes during Cell Division
- Obesity-Linked Homologues and Establish Meal Frequency in
- Derlin-1 Regulates Mutant VCP-Linked Pathogenesis and Endoplasmic Reticulum Stress-Induced Apoptosis
- Stress-Induced Nuclear RNA Degradation Pathways Regulate Yeast Bromodomain Factor 2 to Promote Cell Survival
- The MAPK p38c Regulates Oxidative Stress and Lipid Homeostasis in the Intestine
- Widespread Genome Reorganization of an Obligate Virus Mutualist
- Trans-kingdom Cross-Talk: Small RNAs on the Move
- The Vip1 Inositol Polyphosphate Kinase Family Regulates Polarized Growth and Modulates the Microtubule Cytoskeleton in Fungi
- Myosin Vb Mediated Plasma Membrane Homeostasis Regulates Peridermal Cell Size and Maintains Tissue Homeostasis in the Zebrafish Epidermis
- GLD-4-Mediated Translational Activation Regulates the Size of the Proliferative Germ Cell Pool in the Adult Germ Line
- Genome Wide Association Studies Using a New Nonparametric Model Reveal the Genetic Architecture of 17 Agronomic Traits in an Enlarged Maize Association Panel
- Translational Regulation of the DOUBLETIME/CKIδ/ε Kinase by LARK Contributes to Circadian Period Modulation
- Positive Selection and Multiple Losses of the LINE-1-Derived Gene in Mammals Suggest a Dual Role in Genome Defense and Pluripotency
- Out of Balance: R-loops in Human Disease
- A Genetic Assay for Transcription Errors Reveals Multilayer Control of RNA Polymerase II Fidelity
- Altered Behavioral Performance and Live Imaging of Circuit-Specific Neural Deficiencies in a Zebrafish Model for Psychomotor Retardation
- Nipbl and Mediator Cooperatively Regulate Gene Expression to Control Limb Development
- Meta-analysis of Mutations in Autism Spectrum Disorders: A Gradient of Severity in Cognitive Impairments
- The Proprotein Convertase KPC-1/Furin Controls Branching and Self-avoidance of Sensory Dendrites in
- Hydroxymethylated Cytosines Are Associated with Elevated C to G Transversion Rates
- Memory and Fitness Optimization of Bacteria under Fluctuating Environments
- Regulation of p53 and Rb Links the Alternative NF-κB Pathway to EZH2 Expression and Cell Senescence
- Interspecific Tests of Allelism Reveal the Evolutionary Timing and Pattern of Accumulation of Reproductive Isolation Mutations
- PRO40 Is a Scaffold Protein of the Cell Wall Integrity Pathway, Linking the MAP Kinase Module to the Upstream Activator Protein Kinase C
- Low Levels of p53 Protein and Chromatin Silencing of p53 Target Genes Repress Apoptosis in Endocycling Cells
- SPDEF Inhibits Prostate Carcinogenesis by Disrupting a Positive Feedback Loop in Regulation of the Foxm1 Oncogene
- RRP6L1 and RRP6L2 Function in Silencing Regulation of Antisense RNA Synthesis
- BMPs Regulate Gene Expression in the Dorsal Neuroectoderm of and Vertebrates by Distinct Mechanisms
- Unkempt Is Negatively Regulated by mTOR and Uncouples Neuronal Differentiation from Growth Control
- Atkinesin-13A Modulates Cell-Wall Synthesis and Cell Expansion in via the THESEUS1 Pathway
- Dopamine Signaling Leads to Loss of Polycomb Repression and Aberrant Gene Activation in Experimental Parkinsonism
- Histone Methyltransferase MMSET/NSD2 Alters EZH2 Binding and Reprograms the Myeloma Epigenome through Global and Focal Changes in H3K36 and H3K27 Methylation
- Bipartite Recognition of DNA by TCF/Pangolin Is Remarkably Flexible and Contributes to Transcriptional Responsiveness and Tissue Specificity of Wingless Signaling
- The Olfactory Transcriptomes of Mice
- Muscular Dystrophy-Associated and Variants Disrupt Nuclear-Cytoskeletal Connections and Myonuclear Organization
- Interplay of dFOXO and Two ETS-Family Transcription Factors Determines Lifespan in
- Evidence for Widespread Positive and Negative Selection in Coding and Conserved Noncoding Regions of
- Genome-Wide Association Meta-analysis of Neuropathologic Features of Alzheimer's Disease and Related Dementias
- Rejuvenation of Meiotic Cohesion in Oocytes during Prophase I Is Required for Chiasma Maintenance and Accurate Chromosome Segregation
- Admixture in Latin America: Geographic Structure, Phenotypic Diversity and Self-Perception of Ancestry Based on 7,342 Individuals
- Local Effect of Enhancer of Zeste-Like Reveals Cooperation of Epigenetic and -Acting Determinants for Zygotic Genome Rearrangements
- Differential Responses to Wnt and PCP Disruption Predict Expression and Developmental Function of Conserved and Novel Genes in a Cnidarian
- PLOS Genetics
- Archiv čísel
- Aktuální číslo
- Informace o časopisu
Nejčtenější v tomto čísle- Admixture in Latin America: Geographic Structure, Phenotypic Diversity and Self-Perception of Ancestry Based on 7,342 Individuals
- Nipbl and Mediator Cooperatively Regulate Gene Expression to Control Limb Development
- Genome Wide Association Studies Using a New Nonparametric Model Reveal the Genetic Architecture of 17 Agronomic Traits in an Enlarged Maize Association Panel
- Histone Methyltransferase MMSET/NSD2 Alters EZH2 Binding and Reprograms the Myeloma Epigenome through Global and Focal Changes in H3K36 and H3K27 Methylation
Kurzy
Zvyšte si kvalifikaci online z pohodlí domova
Současné možnosti léčby obezity
nový kurzAutoři: MUDr. Martin Hrubý
Všechny kurzyPřihlášení#ADS_BOTTOM_SCRIPTS#Zapomenuté hesloZadejte e-mailovou adresu, se kterou jste vytvářel(a) účet, budou Vám na ni zaslány informace k nastavení nového hesla.
- Vzdělávání


