-
Články
Top novinky
Reklama- Vzdělávání
- Časopisy
Top články
Nové číslo
- Témata
Top novinky
Reklama- Videa
- Podcasty
Nové podcasty
Reklama- Kariéra
Doporučené pozice
Reklama- Praxe
Top novinky
ReklamaGenetic assessment of age-associated Alzheimer disease risk: Development and validation of a polygenic hazard score
Rahul Desikan and colleagues use genetic and epidemiological data from several large cohorts to derive a score for predicting the age-specific risk for developing Alzheimer's disease.
Published in the journal: . PLoS Med 14(3): e32767. doi:10.1371/journal.pmed.1002258
Category: Research Article
doi: https://doi.org/10.1371/journal.pmed.1002258Summary
Rahul Desikan and colleagues use genetic and epidemiological data from several large cohorts to derive a score for predicting the age-specific risk for developing Alzheimer's disease.
Introduction
Late-onset Alzheimer disease (AD), the most common form of dementia, places a large emotional and economic burden on patients and society. With increasing health care expenditures among cognitively impaired elderly individuals [1], identifying individuals at risk for developing AD is of utmost importance for potential preventative and therapeutic strategies. Inheritance of the ε4 allele of apolipoprotein E (APOE) on Chromosome 19q13 is the most significant risk factor for developing late-onset AD [2]. APOE ε4 has a dose-dependent effect on age of onset, increases AD risk 3-fold in heterozygotes and 15-fold in homozygotes, and is implicated in 20%–25% of AD cases [3].
In addition to the single nucleotide polymorphism (SNP) in APOE, recent genome-wide association studies (GWASs) have identified numerous AD-associated SNPs, most of which have a small effect on disease risk [4,5]. Although no single polymorphism may be informative clinically, a combination of APOE and non-APOE SNPs may help identify older individuals at increased risk for AD. Despite their detection of novel AD-associated genes, GWAS findings have not yet been incorporated into a genetic epidemiology framework for individualized risk prediction.
Building on a prior approach evaluating GWAS-detected genetic variants for disease prediction [6] and using a survival analysis framework, we tested the feasibility of combining AD-associated SNPs and APOE status into a continuous-measure polygenic hazard score (PHS) for predicting the age-specific risk for developing AD. We assessed replication of the PHS using several independent cohorts.
Methods
Participant samples
International genomics of Alzheimer’s project
To select AD-associated SNPs, we evaluated publicly available AD GWAS summary statistic data (p-values and odds ratios) from the International Genomics of Alzheimer’s Project (IGAP) (Stage 1; for additional details see S1 Appendix and [4]). For selecting AD-associated SNPs, we used IGAP Stage 1 data, from 17,008 AD cases and 37,154 controls drawn from four different consortia across North America and Europe (including the United States of America, England, France, Holland, and Iceland) with genotyped or imputed data at 7,055,881 SNPs (for a description of the AD cases and controls within the IGAP Stage 1 sub-studies, please see Table 1 and [4]).
Tab. 1. Demographic data for AD patients and older controls. 
ADGC, Alzheimer’s Disease Genetics Consortium; IGAP, International Genomics of Alzheimer’s Project; SD, standard deviation. Alzheimer’s disease genetics consortium
To develop the survival model for the PHS, we first evaluated age of onset and raw genotype data from 6,409 patients with clinically diagnosed AD and 9,386 cognitively normal older individuals provided by the Alzheimer’s Disease Genetics Consortium (ADGC) (Phase 1, a subset of the IGAP dataset), excluding individuals from the National Institute of Aging Alzheimer’s Disease Center (NIA ADC) and Alzheimer’s Disease Neuroimaging Initiative (ADNI) samples. To evaluate replication of the PHS, we used an independent sample of 6,984 AD patients and 10,972 cognitively normal older individuals from the ADGC Phase 2 cohort (Table 1). The genotype and phenotype data within the ADGC datasets has been described in detail elsewhere [7,8]. Briefly, the ADGC Phase 1 and 2 datasets (enrollment from 1984 to 2012) consist of case–control, prospective, and family-based sub-studies of white participants with AD occurrence after age 60 y derived from the general community and Alzheimer’s Disease Centers across the US. Participants with autosomal dominant (APP, PSEN1, and PSEN2) mutations were excluded. All participants were genotyped using commercially available high-density SNP microarrays from Illumina or Affymetrix. Clinical diagnosis of AD within the ADGC sub-studies was established using NINCDS-ADRDA criteria for definite, probable, and possible AD [9]. For most participants, age of AD onset was obtained from medical records and defined as the age when AD symptoms manifested, as reported by the participant or an informant. For participants lacking age of onset, age at ascertainment was used. Patients with an age at onset or age at death less than 60 y and individuals of non-European ancestry were excluded from the analyses. All ADGC Phase 1 and 2 control participants were defined within individual sub-studies as cognitively normal older adults at time of clinical assessment. The institutional review boards of all participating institutions approved the procedures for all ADGC sub-studies. Written informed consent was obtained from all participants or surrogates. For additional details regarding the ADGC datasets, please see [7,8].
National institute of aging Alzheimer’s disease centers
To assess longitudinal prediction, we evaluated an ADGC-independent sample of 2,724 cognitively normal elderly individuals. Briefly, all participants were US based, evaluated at National Institute of Aging–funded Alzheimer’s Disease Centers (data collection coordinated by the National Alzheimer’s Coordinating Center [NACC]) and clinically followed for at least two years (enrollment from 1984 to 2012, evaluation years were 2005 to 2016) [10]. Here, we focused on older individuals defined at baseline as having an overall Clinical Dementia Rating score of 0.0. To assess the relationship between polygenic risk and neuropathology, we assessed 2,960 participants from the NIA ADC samples with genotype and neuropathological evaluations. For the neuropathological variables, we examined the Braak stage for neurofibrillary tangles (NFTs) (0, none; I–II, entorhinal; III–IV, limbic; and V–VI, isocortical) [11] and the Consortium to Establish a Registry for Alzheimer’s Disease (CERAD) score for neuritic plaques (none/sparse, moderate, or frequent) [12]. Finally, as an additional independent replication sample, we evaluated all NIA ADC AD cases with genetic data who were classified at autopsy as having a high level of AD neuropathological change (n = 361), based on the revised National Institute of Aging–Alzheimer’s Association AD neuropathology criteria [13]. The institutional review boards of all participating institutions approved the procedures for all NIA ADC sub-studies. Written informed consent was obtained from all participants or surrogates.
Alzheimer’s disease neuroimaging initiative
To assess the relationship between polygenic risk and in vivo biomarkers, we evaluated an ADGC-independent sample of 692 older controls and participants with mild cognitive impairment or AD from the ADNI (see S1 Appendix). Briefly, the ADNI is a multicenter, multisite longitudinal study assessing clinical, imaging, genetic, and biospecimen biomarkers from US-based participants through the process of normal aging to early mild cognitive impairment, to late mild cognitive impairment, to dementia or AD (see S1 Appendix). Here, we focused specifically on participants from ADNI 1 with cognitive, imaging, and cerebrospinal fluid (CSF) assessments from 2003 to 2010. In a subset of ADNI 1 participants with available genotype data, we evaluated baseline CSF level of Aβ1–42 and total tau, as well as longitudinal Clinical Dementia Rating Sum of Boxes (CDR-SB) scores. In ADNI 1 participants with available genotype and quality-assured baseline and follow-up MRI scans, we also assessed longitudinal subregional change in medial temporal lobe volume (atrophy) on 2,471 serial T1-weighted MRI scans (for additional details see S1 Appendix).
Statistical analysis
We followed three steps to derive the PHS for predicting age of AD onset: (1) we defined the set of associated SNPs, (2) we estimated hazard ratios for polygenic profiles, and (3) we calculated individualized absolute hazards (see S1 Appendix for a detailed description of these steps).
Using the IGAP Stage 1 sample, we first identified a list of SNPs associated with increased risk for AD, using a significance threshold of p < 10−5. Next, we evaluated all IGAP-detected AD-associated SNPs within the ADGC Phase 1 case–control dataset. Using a stepwise procedure in survival analysis, we delineated the “final” list of SNPs for constructing the PHS [14,15]. Specifically, using Cox proportional hazard models, we identified the top AD-associated SNPs within the ADGC Phase 1 cohort (excluding NIA ADC and ADNI samples), while controlling for the effects of gender, APOE variants, and the top five genetic principal components (to control for the effects of population stratification). We utilized age of AD onset and age of last clinical visit to estimate age-specific risks [16] and derived a PHS for each participant. In each step of the stepwise procedure, the algorithm selected the one SNP from the pool that most improved model prediction (i.e., minimizing the Martingale residuals); additional SNP inclusion that did not further minimize the residuals resulted in halting of the SNP selection process. To prevent overfitting in this training step, we used 1,000× bootstrapping for model averaging and estimating the hazard ratios for each selected SNP. We assessed the proportional hazard assumption in the final model using graphical comparisons.
To assess for replication, we first examined whether the predicted PHSs derived from the ADGC Phase 1 cohort could stratify individuals into different risk strata within the ADGC Phase 2 cohort. We next evaluated the relationship between predicted age of AD onset and the empirical (actual) age of AD onset using cases from ADGC Phase 2. We binned risk strata into percentile bins and calculated the mean of actual age of AD onset in that percentile as the empirical age of AD onset. In a similar fashion, we additionally tested replication within the NIA ADC subset classified at autopsy as having a high level of AD neuropathological change [13].
Because case–control samples cannot provide the proper baseline hazard [17], we used previously reported annualized incidence rates by age estimated from the general US population [18]. For each participant, by combining the overall population-derived incidence rates [18] and the genotype-derived PHS, we calculated the individual’s “instantaneous risk” for developing AD, based on their genotype and age (for additional details see S1 Appendix). To independently assess the predicted instantaneous risk, we evaluated longitudinal follow-up data from 2,724 cognitively normal older individuals from the NIA ADC with at least 2 y of clinical follow-up. We assessed the number of cognitively normal individuals progressing to AD as a function of the predicted PHS risk strata and examined whether the predicted PHS-derived incidence rate reflected the empirical progression rate using a Cochran–Armitage trend test.
We examined the association between our PHS and established in vivo and pathological markers of AD neurodegeneration. Using linear models, we assessed whether the PHS associated with Braak stage for NFTs and CERAD score for neuritic plaques, as well as CSF Aβ1–42 and CSF total tau. Using linear mixed effects models, we also investigated whether the PHS was associated with longitudinal CDR-SB score and volume loss within the entorhinal cortex and hippocampus. In all analyses, we co-varied for the effects of age and sex.
Results
Polygenic hazard score: Model development, relationship to APOE, and independent replication
From the IGAP cohort, we found 1,854 SNPs associated with increased risk for AD at p < 10−5. Of these, using the Cox stepwise regression framework, we identified 31 SNPs, in addition to two APOE variants, within the ADGC cohort for constructing the polygenic model (Table 2). Fig 1 illustrates the relative risk for developing AD using the ADGC Phase 1 case–control cohort. The graphical comparisons among Kaplan–Meier estimations and Cox proportional hazard models indicate that the proportional hazard assumption holds for the final model (Fig 1).
Tab. 2. The selected 31 SNPs, their closest genes, their log hazard ratio estimates, and their conditional <i>p-</i>values in the final joint model, after controlling for effects of gender and <i>APOE</i> variants. 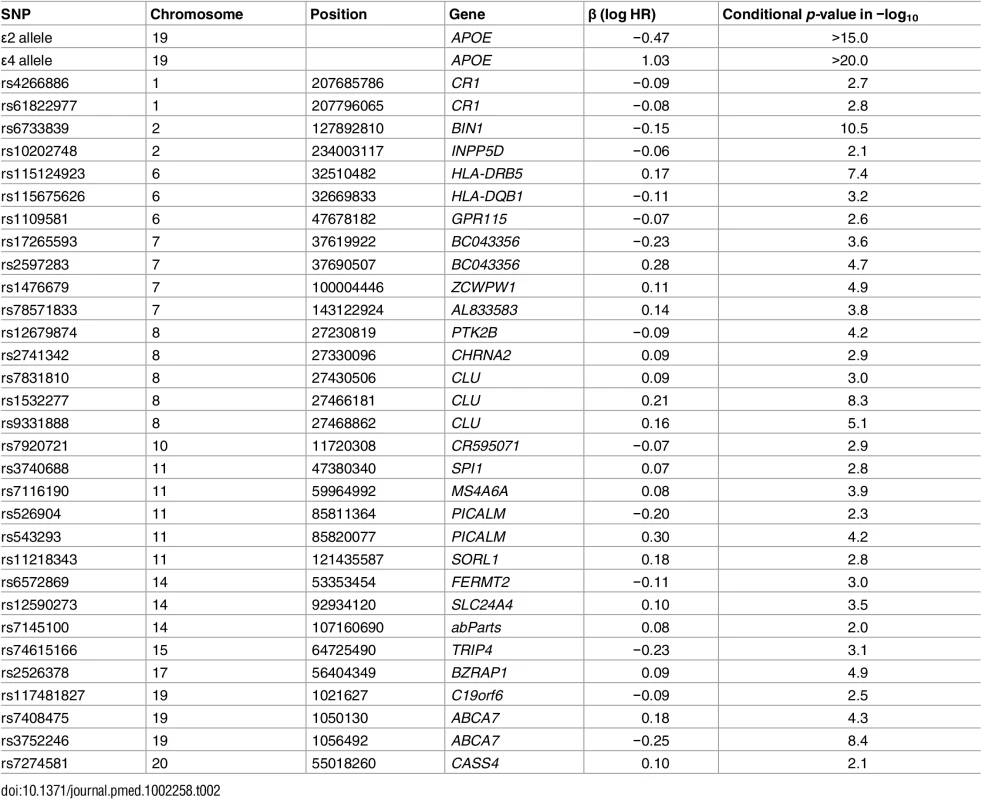
Fig. 1. Kaplan–Meier estimates and Cox proportional hazard model fits from the ADGC Phase 1 case–control dataset, excluding NIA ADC and ADNI samples. 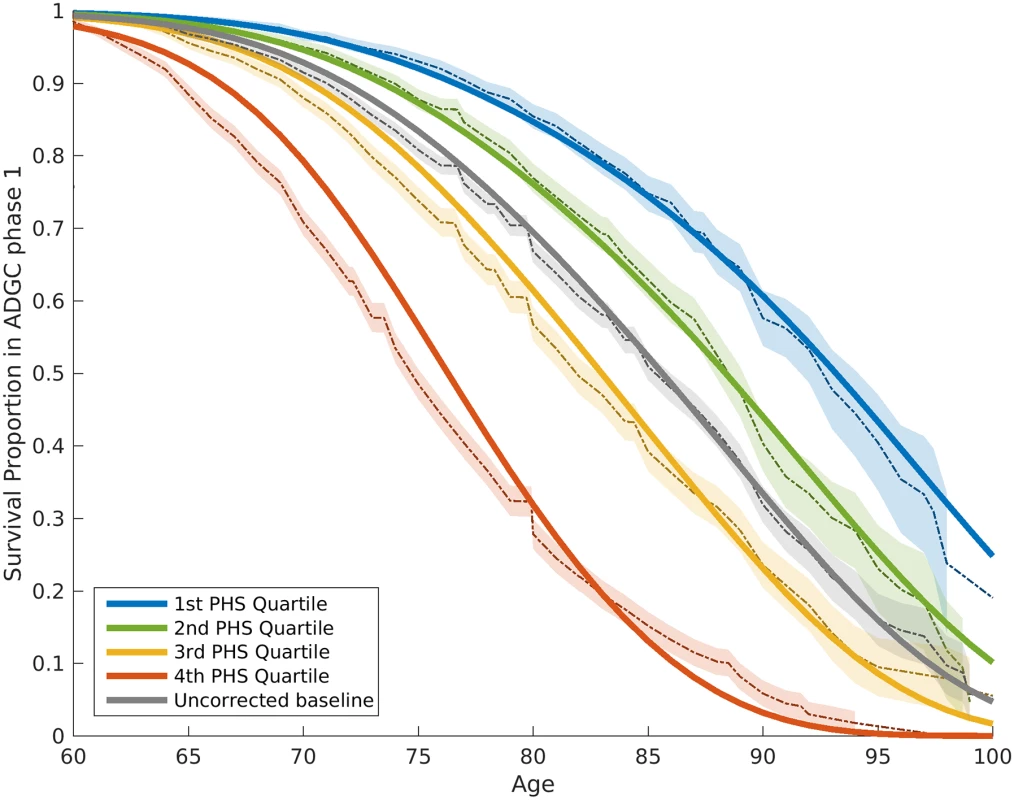
The proportional hazard assumptions were checked based on graphical comparisons between Kaplan–Meier estimations (dashed lines) and Cox proportional hazard models (solid lines). The 95% confidence intervals of Kaplan–Meier estimations are also demonstrated (shaded with corresponding colors). The baseline hazard (gray line) in this model is based on the mean of ADGC data. ADGC, Alzheimer’s Disease Genetics Consortium; ADNI, Alzheimer’s Disease Neuroimaging Initiative; NIA ADC, National Institute on Aging Alzheimer’s Disease Center; PHS, polygenic hazard score. To quantify the additional prediction provided by polygenic information beyond APOE, we evaluated how the PHS modulates age of AD onset in APOE ε3/3 individuals. Among these individuals, we found that age of AD onset can vary by more than 10 y, depending on polygenic risk. For example, for an APOE ε3/3 individual in the tenth decile (top 10%) of the PHS, at 50% risk for meeting clinical criteria for AD diagnosis, the expected age of developing AD is approximately 84 y (Fig 2); however, for an APOE ε3/3 individual in the first decile (bottom 10%) of the PHS, the expected age of developing AD is approximately 95 y (Fig 2). The hazard ratio comparing the tenth decile to the first decile is 3.34 (95% CI 2.62–4.24, log rank test p = 1.0 × 10⁻²²). Similarly, we also evaluated the relationship between the PHS and the different APOE alleles (ε2/3/4) (first figure in S1 Appendix). These findings show that, beyond APOE, the polygenic architecture plays an integral role in affecting AD risk.
Fig. 2. Kaplan–Meier estimates and Cox proportional hazard model fits among APOE ε3/3 individuals in the ADGC Phase 1 dataset, excluding NIA ADC and ADNI samples. 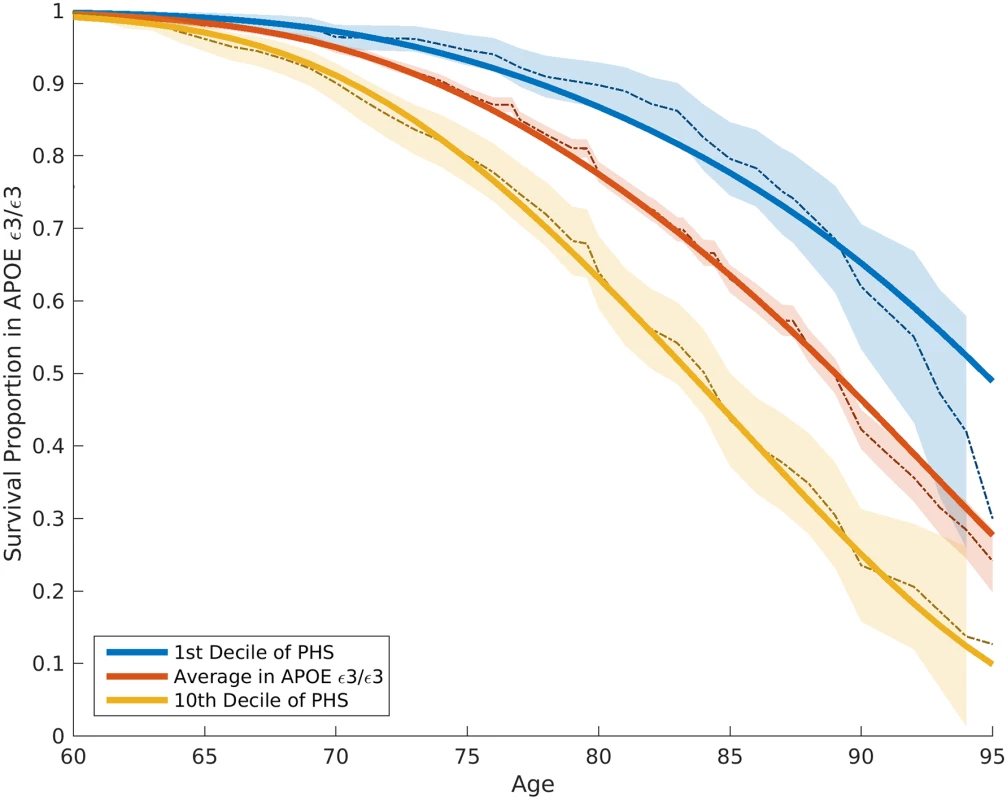
The solid lines represent the Cox fit, whereas the dashed lines and shaded regions represent the Kaplan–Meier estimations with 95% confidence intervals. ADGC, Alzheimer’s Disease Genetics Consortium; ADNI, Alzheimer’s Disease Neuroimaging Initiative; NIA ADC, National Institute on Aging Alzheimer’s Disease Center; PHS, polygenic hazard score. To assess replication, we applied the ADGC Phase 1–trained model to independent samples from ADGC Phase 2. Using the empirical distributions, we found that the PHS successfully stratified individuals from independent cohorts into different risk strata (Fig 3A). Among AD cases in the ADGC Phase 2 cohort, we found that the predicted age of onset was strongly associated with the empirical (actual) age of onset (binned in percentiles, r = 0.90, p = 1.1 × 10⁻²⁶; Fig 3B). Similarly, within the NIA ADC subset with a high level of AD neuropathological change, we found that the PHS strongly predicted time to progression to neuropathologically defined AD (Cox proportional hazard model, z = 11.8723, p = 2.8 × 10⁻³²).
Fig. 3. Polygenic hazard score validation in ADGC Phase 2 cohort. 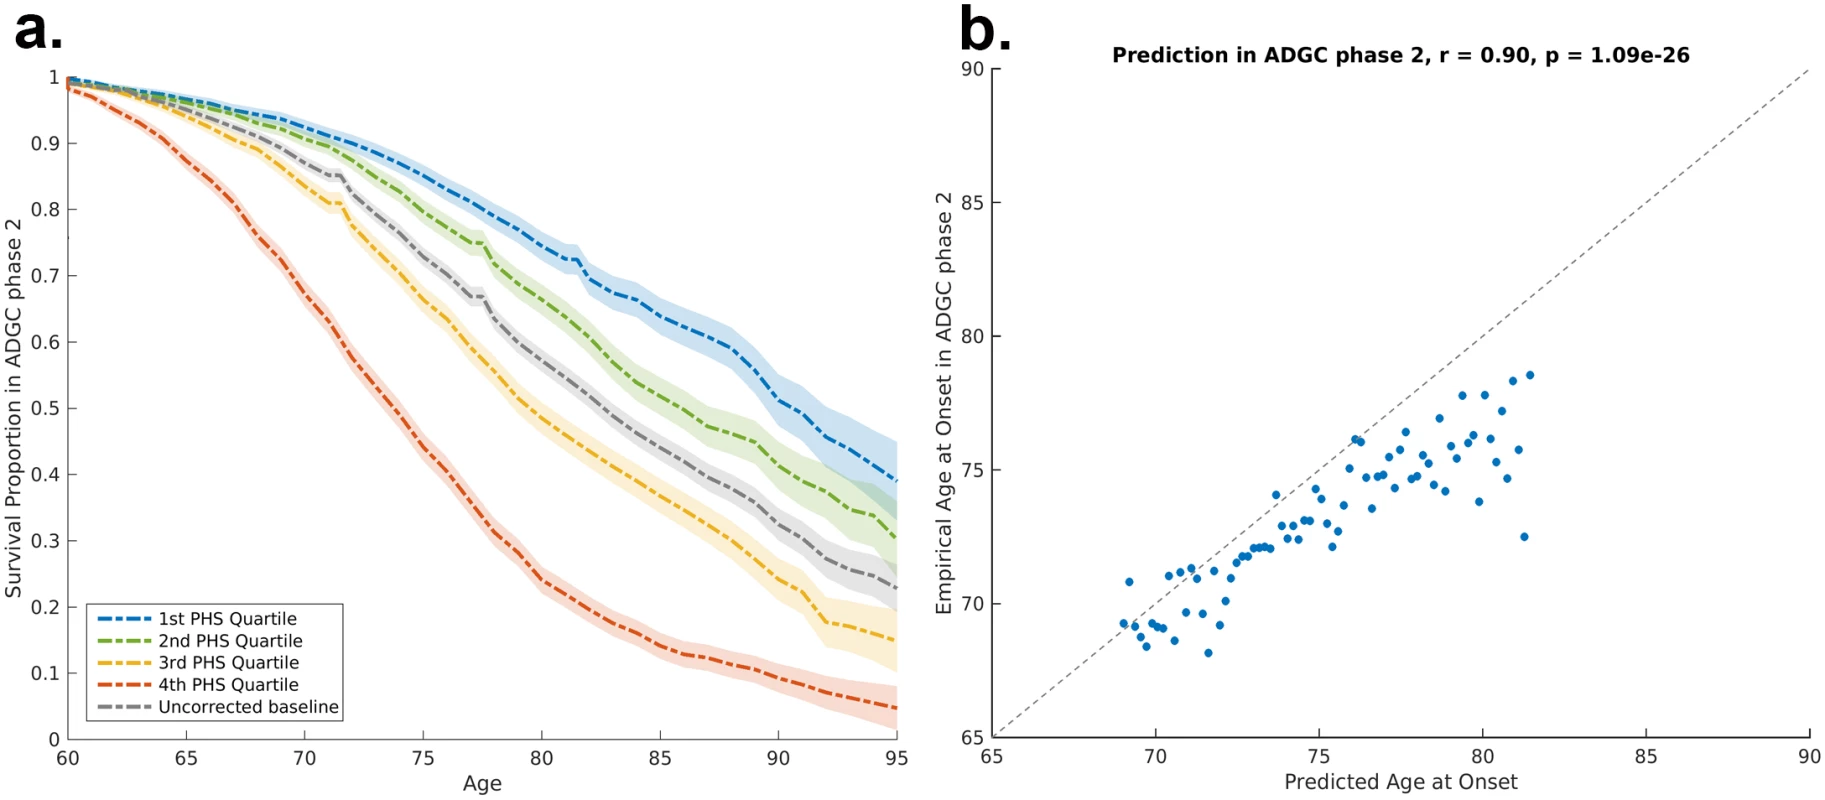
(A) Risk stratification in ADGC Phase 2 cohort, using PHSs derived from ADGC Phase 1 dataset. The dashed lines and shaded regions represent Kaplan–Meier estimations with 95% confidence intervals. (B) Predicted age of AD onset as a function of empirical age of AD onset among cases in ADGC Phase 2 cohort. Prediction is based on the final survival model trained in the ADGC Phase 1 dataset. AD, Alzheimer disease; ADGC, Alzheimer’s Disease Genetics Consortium; PHS, polygenic hazard score. Predicting population risk of Alzheimer disease onset
To evaluate the risk for developing AD, combining the estimated hazard ratios from the ADGC cohort, allele frequencies for each of the AD-associated SNPs from the 1000 Genomes Project, and the disease incidence in the general US population [18], we generated population baseline-corrected survival curves given an individual’s genetic profile and age (panels A and B of second figure in S1 Appendix). We found that PHS status modifies both the risk for developing AD and the distribution of age of onset (panels A and B of second figure in S1 Appendix).
Given an individual’s genetic profile and age, the corrected survival proportion can be translated directly into incidence rates (Fig 4; Tables 3 and S1). As previously reported in a meta-analysis summarizing four studies from the US general population [18], the annualized incidence rate represents the proportion (in percent) of individuals in a given risk stratum and age who have not yet developed AD but will develop AD in the following year; thus, the annualized incidence rate represents the instantaneous risk for developing AD conditional on having survived up to that point in time. For example, for a cognitively normal 65-y-old individual in the 80th percentile of the PHS, the incidence rate (per 100 person-years) would be 0.29 at age 65 y, 1.22 at age 75 y, 5.03 at age 85 y, and 20.82 at age 95 y (Fig 4; Table 3); in contrast, for a cognitively normal 65-y-old in the 20th percentile of the PHS, the incidence rate would be 0.10 at age 65 y, 0.43 at age 75 y, 1.80 at age 85 y, and 7.43 at age 95 y (Fig 4; Table 3). As independent validation, we examined whether the PHS-predicted incidence rate reflects the empirical progression rate (from normal control to clinical AD) (Fig 5). We found that the PHS-predicted incidence was strongly associated with empirical progression rates (Cochran–Armitage trend test, p = 1.5 × 10⁻¹⁰).
Fig. 4. Annualized incidence rates showing the instantaneous hazard as a function of polygenic hazard score percentile and age. 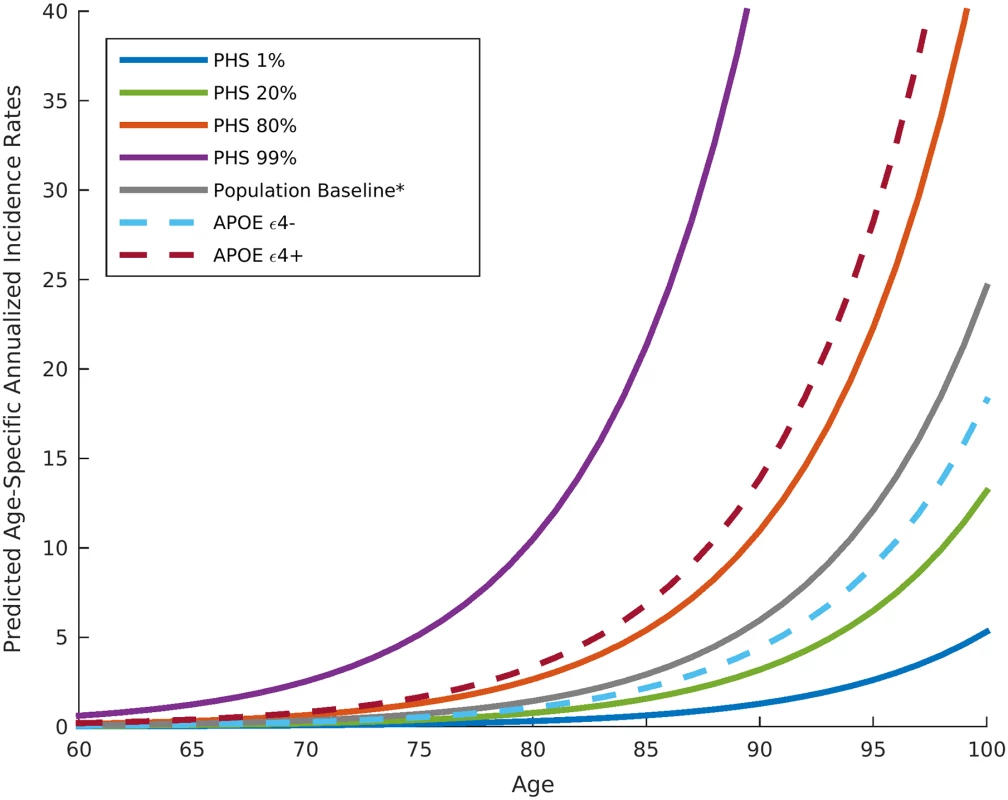
The gray line represents the population baseline estimate. Dashed lines represent incidence rates in APOE ε4 carriers (dark red dashed line) and non-carriers (light blue dashed line) not associated with a PHS percentile. The asterisk indicates that the baseline estimation is based on previously reported annualized incidence rates by age in the general US population [18]. PHS, polygenic hazard score. Fig. 5. Empirical progression rates observed in the NIA ADC longitudinal cohort as a function of predicted incidence. 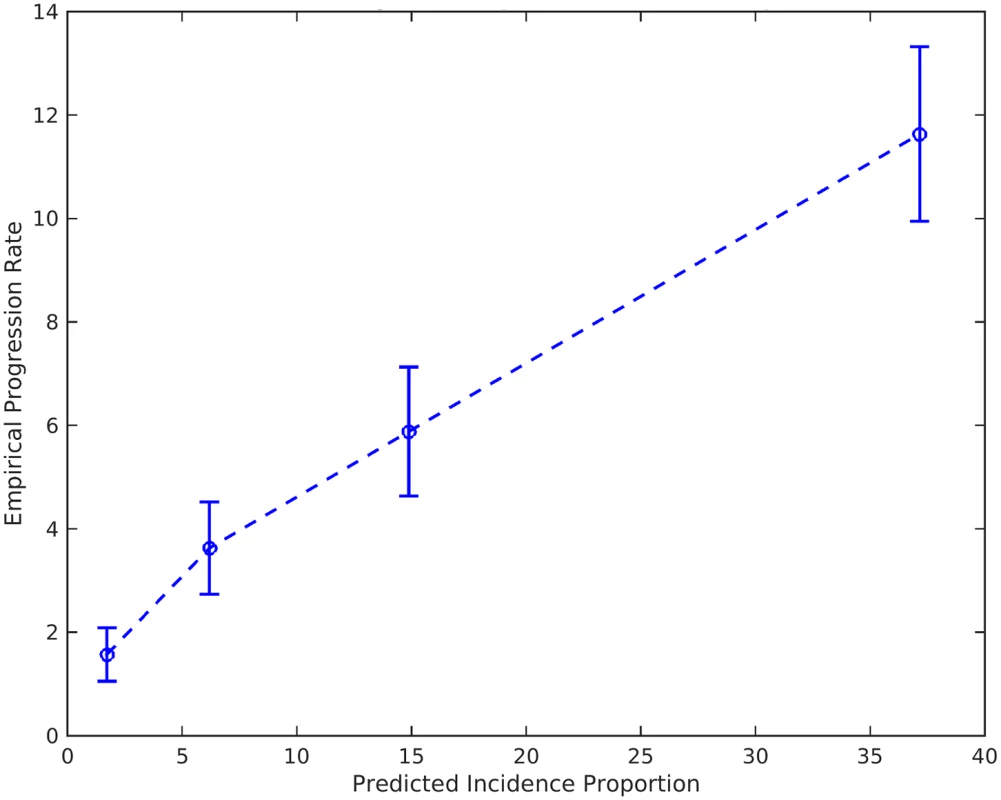
Bars show 95% confidence intervals. NIA ADC, National Institute on Aging Alzheimer’s Disease Center. Tab. 3. Predicted annualized incidence rate (per 100 person-years) by age using polygenic hazard score. 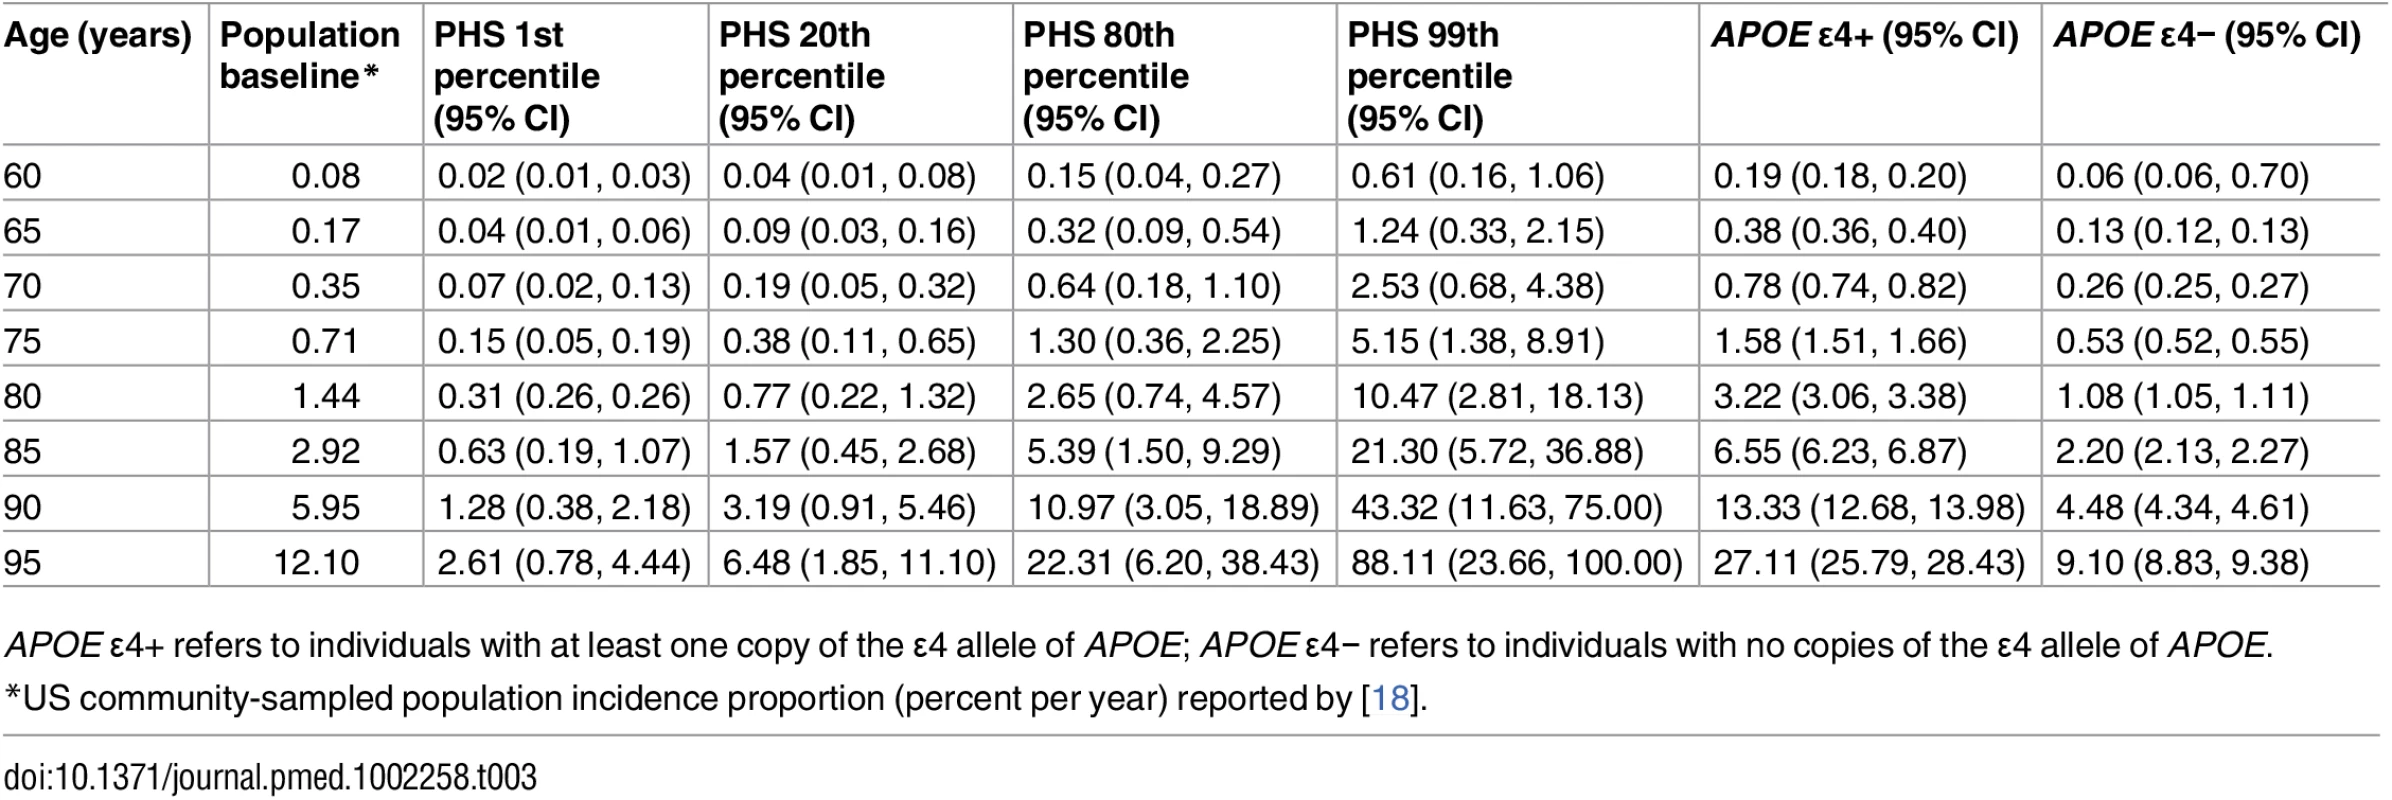
APOE ε4+ refers to individuals with at least one copy of the ε4 allele of APOE; APOE ε4− refers to individuals with no copies of the ε4 allele of APOE. Association of polygenic hazard score with known markers of Alzheimer disease pathology
We found that the PHS was significantly associated with Braak stage of NFTs (β-coefficient = 0.115, standard error [SE] = 0.024, p-value = 3.9 × 10⁻⁶) and CERAD score for neuritic plaques (β-coefficient = 0.105, SE = 0.023, p-value = 6.8 × 10⁻⁶). We additionally found that the PHS was associated with worsening CDR-SB score over time (β-coefficient = 2.49, SE = 0.38, p-value = 1.1 × 10⁻¹⁰), decreased CSF Aβ1–42 (reflecting increased intracranial Aβ plaque load) (β-coefficient = −0.07, SE = 0.01, p-value = 1.28 × 10⁻⁷), increased CSF total tau (β-coefficient = 0.03, SE = 0.01, p-value = 0.05), and greater volume loss within the entorhinal cortex (β-coefficient = −0.022, SE = 0.005, p-value = 6.30 × 10⁻⁶) and hippocampus (β-coefficient = −0.021, SE = 0.005, p-value = 7.86 × 10⁻⁵).
Discussion
In this study, by integrating AD-associated SNPs from recent GWASs and disease incidence estimates from the US population into a genetic epidemiology framework, we have developed a novel PHS for quantifying individual differences in risk for developing AD, as a function of genotype and age. The PHS systematically modified age of AD onset, and was associated with known in vivo and pathological markers of AD neurodegeneration. In independent cohorts (including a neuropathologically confirmed dataset), the PHS successfully predicted empirical (actual) age of onset and longitudinal progression from normal aging to AD. Even among individuals who do not carry the ε4 allele of APOE (the majority of the US population), we found that polygenic information was useful for predicting age of AD onset.
Using a case–control design, prior work has combined GWAS-associated polymorphisms and disease prediction models to predict risk for AD [19–24]. Rather than representing a continuous process where non-demented individuals progress to AD over time, the case–control approach implicitly assumes that normal controls do not develop dementia and treats the disease process as a dichotomous variable where the goal is maximal discrimination between diseased “cases” and healthy “controls.” Given the striking age dependence of AD, this approach is clinically suboptimal for estimating the risk of AD. Building on prior genetic estimates from the general population [2,25], we employed a survival analysis framework to integrate AD-associated common variants with established population-based incidence [18] to derive a continuous measure, the PHS. We note that the PHS can estimate individual differences in AD risk across a lifetime and can quantify the yearly incidence rate for developing AD.
These findings indicate that the lifetime risk of age of AD onset varies by polygenic profile. For example, the annualized incidence rate (risk for developing AD in a given year) is considerably lower for an 80-y-old individual in the 20th percentile of the PHS than for an 80-y-old in the 99th percentile of the PHS (Fig 4; Table 3). Across the lifespan (panel B of second figure in S1 Appendix), our results indicate that even individuals with low genetic risk (low PHS) develop AD, but at a later peak age of onset. Certain loci (including APOE ε2) may “protect” against AD by delaying, rather than preventing, disease onset.
Our polygenic results provide important predictive information beyond APOE. Among APOE ε3/3 individuals, who constitute 70%–75% of all individuals diagnosed with late-onset AD, age of onset varies by more than 10 y, depending on polygenic risk profile (Fig 2). At 60% AD risk, APOE ε3/3 individuals in the first decile of the PHS have an expected age of onset of 85 y, whereas for individuals in the tenth decile of the PHS, the expected age of onset is greater than 95 y. These findings are directly relevant to the general population, where APOE ε4 accounts for only a fraction of AD risk [3], and are consistent with prior work [26] indicating that AD is a polygenic disease where non-APOE genetic variants contribute significantly to disease etiology.
We found that the PHS strongly predicted age of AD onset within the ADGC Phase 2 dataset and the NIA ADC neuropathology-confirmed subset, demonstrating independent replication of our polygenic score. Within the NIA ADC sample, the PHS robustly predicted longitudinal progression from normal aging to AD, illustrating that polygenic information can be used to identify the cognitively normal older individuals at highest risk for developing AD (preclinical AD). We found a strong relationship between the PHS and increased tau-associated NFTs and amyloid plaques, suggesting that elevated genetic risk may make individuals more susceptible to underlying AD pathology. Consistent with recent studies showing correlations between AD polygenic risk scores and markers of AD neurodegeneration [22,23], our PHS also demonstrated robust associations with CSF Aβ1–42 levels, longitudinal MRI measures of medial temporal lobe volume loss, and longitudinal CDR-SB scores, illustrating that increased genetic risk may increase the likelihood of clinical progression and developing neurodegeneration measured in vivo.
From a clinical perspective, our genetic risk score may serve as a “risk factor” for accurately identifying older individuals at greatest risk for developing AD, at a given age. Conceptually similar to other polygenic risk scores (for a review of this topic see [27]) for assessing coronary artery disease risk [28] and breast cancer risk [29], our PHS may help in predicting which individuals will test “positive” for clinical, CSF, or imaging markers of AD pathology. Importantly, a continuous polygenic measure of AD genetic risk may provide an enrichment strategy for prevention and therapeutic trials and could also be useful for predicting which individuals may respond to therapy. From a disease management perspective, by providing an accurate probabilistic assessment regarding the likelihood of AD neurodegeneration, determining a “genomic profile” of AD may help initiate a dialogue on future planning. Finally, a similar genetic epidemiology framework may be useful for quantifying the risk associated with numerous other common diseases.
There are several limitations to our study. We primarily focused on individuals of European descent. Given that AD incidence [30], genetic risk [25,31], and likely linkage disequilibrium in African-American and Latino individuals is different from in white individuals, additional work will be needed to develop a polygenic risk model in non-white (and non-US) populations. The majority of the participants evaluated in our study were recruited from specialized memory clinics or AD research centers and may not be representative of the general US population. In order to be clinically useful, we note that our PHS needs to be prospectively validated in large community-based cohorts, preferably consisting of individuals from a range of ethnicities. The previously reported population annualized incidence rates were not separately provided for males and females [18]. Therefore, we could not report PHS annualized incidence rates stratified by sex. We note that we primarily focused on genetic markers and thus did not evaluate how other variables, such as environmental or lifestyle factors, in combination with genetics impact age of AD onset. Another limitation is that our PHS may not be able to distinguish pure AD from a “mixed dementia” presentation since cerebral small vessel ischemic/hypertensive pathology often presents concomitantly with AD neurodegeneration, and additional work will be needed on cohorts with mixed dementia to determine the specificity of our polygenic score. Finally, we focused on APOE and GWAS-detected polymorphisms for disease prediction. Given the flexibility of our genetic epidemiology framework, it can be used to investigate whether a combination of common and rare genetic variants along with clinical, cognitive, and imaging biomarkers may prove useful for refining the prediction of age of AD onset.
In conclusion, by integrating population-based incidence proportion and genome-wide data into a genetic epidemiology framework, we have developed a PHS for quantifying the age-associated risk for developing AD. Measures of polygenic variation may prove useful for stratifying AD risk and as an enrichment strategy in clinical trials.
Supporting Information
Zdroje
1. Kelley AS, McGarry K, Gorges R, Skinner JS. The burden of health care costs for patients with dementia in the last 5 years of life. Ann Intern Med. 2015;163 : 729–736. doi: 10.7326/M15-0381 26502320
2. Farrer LA, Cupples LA, Haines JL, Hyman B, Kukull WA, Mayeux R, et al. Effects of age, sex, and ethnicity on the association between apolipoprotein E genotype and Alzheimer disease. A meta-analysis. APOE and Alzheimer Disease Meta Analysis Consortium. JAMA. 1997;278(16):1349–56. 9343467
3. Karch CM, Cruchaga C, Goate AM. Alzheimer’s disease genetics: from the bench to the clinic. Neuron. 2014;83 : 11–26. doi: 10.1016/j.neuron.2014.05.041 24991952
4. Lambert JC, Ibrahim-Verbaas CA, Harold D, Naj AC, Sims R, Bellenguez C, et al. Meta-analysis of 74,046 individuals identifies 11 new susceptibility loci for Alzheimer’s disease. Nat Genet. 2013;45 : 1452–8. doi: 10.1038/ng.2802 24162737
5. Desikan RS, Schork AJ, Wang Y, Thompson WK, Dehghan A, Ridker PM, et al. Polygenic overlap between C-reactive protein, plasma lipids, and Alzheimer disease. Circulation. 2015;131 : 2061–9. doi: 10.1161/CIRCULATIONAHA.115.015489 25862742
6. Wray NR, Goddard ME, Visscher PM. Prediction of individual genetic risk to disease from genome-wide association studies. Genome Res. 2007;17 : 1520–8. doi: 10.1101/gr.6665407 17785532
7. Naj AC, Jun G, Beecham GW, Wang LS, Vardarajan BN, Buros J, et al. Common variants at MS4A4/MS4A6E, CD2AP, CD33 and EPHA1 are associated with late-onset Alzheimer’s disease. Nat Genet. 2011;43 : 436–41. doi: 10.1038/ng.801 21460841
8. Jun G, Ibrahim-Verbaas CA, Vronskaya M, Lambert JC, Chung J, Naj AC, et al. A novel Alzheimer disease locus located near the gene encoding tau protein. Mol Psychiatry. 2016;21 : 108–17. doi: 10.1038/mp.2015.23 25778476
9. McKhann G, Drachman D, Folstein M, Hyman BT, Jack CR Jr, Kawas CH, et al. Clinical diagnosis of Alzheimer’s disease: report of the NINCDS-ADRDA Work Group under the auspices of Department of Health and Human Services Task Force on Alzheimer’s Disease. Neurology. 1984;34 : 939–44. 6610841
10. Beekly DL, Ramos EM, Lee WW, Deitrich WD, Jacka ME, Wu J, et al. The National Alzheimer’s Coordinating Center (NACC) database: the Uniform Data Set. Alzheimer Dis Assoc Disord. 2007;21 : 249–58. doi: 10.1097/WAD.0b013e318142774e 17804958
11. Braak H, Braak E. Neuropathological stageing of Alzheimer-related changes. Acta Neuropathol. 1991;82 : 239–59. 1759558
12. Mirra SS, Heyman A, McKeel D, Sumi SM, Crain BJ, Brownlee LM, et al. The Consortium to Establish a Registry for Alzheimer’s Disease (CERAD). Part II. Standardization of the neuropathologic assessment of Alzheimer’s disease. Neurology. 1991;41 : 479–86. 2011243
13. Hyman BT, Phelps CH, Beach TG, Bigio EH, Cairns NJ, Carrillo MC, et al. National Institute on Aging-Alzheimer’s Association guidelines for the neuropathologic assessment of Alzheimer’s disease. Alzheimers Dement. 2012;8(1):1–13. doi: 10.1016/j.jalz.2011.10.007 22265587
14. Yang J, Ferreira T, Morris AP, Medland SE, Genetic Investigation of ANthropometric Traits (GIANT) Consortium, DIAbetes Genetics Replication And Meta-analysis (DIAGRAM) Consortium, et al. Conditional and joint multiple-SNP analysis of GWAS summary statistics identifies additional variants influencing complex traits. Nat Genet. 2012;44 : 369–75. doi: 10.1038/ng.2213 22426310
15. Dudbridge F. Power and predictive accuracy of polygenic risk scores. PLoS Genet. 2013;9(3):e1003348. doi: 10.1371/journal.pgen.1003348 23555274
16. Klein JP, Houwelingen HC, Ibrahim JG, Scheike TH, editors. Handbook of survival analysis. London: Chapman and Hall/CRC; 2013.
17. Rothman KJ, Greenland S, Lash TL. Modern epidemiology. 3rd ed. Philadelphia: Lippincott Williams & Wilkins; 2008.
18. Brookmeyer R, Gray S, Kawas C. Projections of Alzheimer’s disease in the United States and the public health impact of delaying disease onset. Am J Public Health. 1998;88 : 1337–42. 9736873
19. Escott-Price V, Sims R, Bannister C, Harold D, Vronskaya M, Majounie E, et al. Common polygenic variation enhances risk prediction for Alzheimer’s disease. Brain. 2015;138(Pt 12):3673–84. doi: 10.1093/brain/awv268 26490334
20. Yokoyama JS, Bonham LW, Sears RL, Klein E, Karydas A, Kramer JH, et al. Decision tree analysis of genetic risk for clinically heterogeneous Alzheimer’s disease. BMC Neurol. 2015;15 : 47. doi: 10.1186/s12883-015-0304-6 25880661
21. Mormino EC, Sperling RA, Holmes AJ, Buckner RL, De Jager PL, Smoller JW, et al. Polygenic risk of Alzheimer disease is associated with early - and late-life processes. Neurology. 2016;87(5):481–8. doi: 10.1212/WNL.0000000000002922 27385740
22. Martiskainen H, Helisalmi S, Viswanathan J, Kurki M, Hall A, Herukka SK, et al. Effects of Alzheimer’s disease-associated risk loci on cerebrospinal fluid biomarkers and disease progression: a polygenic risk score approach. J Alzheimers Dis. 2015;43(2):565–73. doi: 10.3233/JAD-140777 25096612
23. Lacour A, Espinosa A, Louwersheimer E, Heilmann S, Hernández I, Wolfsgruber S, et al. Genome-wide significant risk factors for Alzheimer’s disease: role in progression to dementia due to Alzheimer’s disease among subjects with mild cognitive impairment. Mol Psychiatry. 2017;22(1):153–160. doi: 10.1038/mp.2016.18 26976043
24. Chouraki V, Reitz C, Maury F, Bis JC, Bellenguez C, Yu L, et al. Evaluation of a genetic risk score to improve risk prediction for Alzheimer’s disease. J Alzheimers Dis. 2016;53(3):921–32. doi: 10.3233/JAD-150749 27340842
25. Tang MX, Stern Y, Marder K, Bell K, Gurland B, Lantigua R, et al. The APOE-epsilon4 allele and the risk of Alzheimer disease among African Americans, whites, and Hispanics. JAMA. 1998;279 : 751–5. 9508150
26. Sims R, Williams J. Defining the genetic architecture of Alzheimer’s disease: where next. Neurodegener Dis. 2016;16(1–2):6–11. doi: 10.1159/000440841 26550988
27. Chatterjee N, Shi J, García-Closas M. Developing and evaluating polygenic risk prediction models for stratified disease prevention. Nat Rev Genet. 2016;17(7):392–406. doi: 10.1038/nrg.2016.27 27140283
28. Khera AV, Emdin CA, Drake I, Natarajan P, Bick AG, Cook NR, et al. Genetic risk, adherence to a healthy lifestyle, and coronary disease. N Engl J Med. 2016;375(24):2349–58. doi: 10.1056/NEJMoa1605086 27959714
29. Mavaddat N, Pharoah PD, Michailidou K, Tyrer J, Brook MN, Bolla MK, et al. Prediction of breast cancer risk based on profiling with common genetic variants. J Natl Cancer Inst. 2015;107(5):djv036. doi: 10.1093/jnci/djv036 25855707
30. Tang MX, Cross P, Andrews H, Jacobs DM, Jacobs DM, Small S, et al. Incidence of AD in African-Americans, Caribbean Hispanics, and Caucasians in northern Manhattan. Neurology. 2001;56 : 49–56. 11148235
31. Reitz C, Jun G, Naj A, Rajbhandary R, Vardarajan BN, Wang LS, et al. Variants in the ATP-binding cassette transporter (ABCA7), apolipoprotein E ϵ4, and the risk of late-onset Alzheimer disease in African Americans. JAMA. 2013;309 : 1483–92. doi: 10.1001/jama.2013.2973 23571587
Štítky
Interní lékařství
Článek vyšel v časopisePLOS Medicine
Nejčtenější tento týden
2017 Číslo 3- Berberin: přírodní hypolipidemikum se slibnými výsledky
- Léčba bolesti u seniorů
- Příznivý vliv Armolipidu Plus na hladinu cholesterolu a zánětlivé parametry u pacientů s chronickým subklinickým zánětem
- Červená fermentovaná rýže účinně snižuje hladinu LDL cholesterolu jako vhodná alternativa ke statinové terapii
- Jak postupovat při výběru betablokátoru − doporučení z kardiologické praxe
-
Všechny články tohoto čísla
- 2016 Reviewer and Editorial Board Thank You
- , , and mutations in early-onset Alzheimer disease: A genetic screening study of familial and sporadic cases
- Differential associations of plasma lipids with incident dementia and dementia subtypes in the 3C Study: A longitudinal, population-based prospective cohort study
- Mixed pathologies and neural reserve: Implications of complexity for Alzheimer disease drug discovery
- -related risk of mild cognitive impairment and dementia for prevention trials: An analysis of four cohorts
- Neuropathological diagnoses and clinical correlates in older adults in Brazil: A cross-sectional study
- Early diagnosis of mild cognitive impairment and mild dementia through basic and instrumental activities of daily living: Development of a new evaluation tool
- Potentially modifiable lifestyle factors, cognitive reserve, and cognitive function in later life: A cross-sectional study
- Association between fatty acid metabolism in the brain and Alzheimer disease neuropathology and cognitive performance: A nontargeted metabolomic study
- Fine-mapping of the human leukocyte antigen locus as a risk factor for Alzheimer disease: A case–control study
- What’s the “Take Home” from Research on Dementia Trends?
- Cultural representations of dementia
- Dementia and aging populations—A global priority for contextualized research and health policy
- Dementia in the oldest old: Beyond Alzheimer disease
- Rehabilitation for people living with dementia: A practical framework of positive support
- Dementia in low-income and middle-income countries: Different realities mandate tailored solutions
- Challenges and opportunities in understanding dementia and delirium in the acute hospital
- Dementia incidence trend over 1992-2014 in the Netherlands: Analysis of primary care data
- Association between delirium superimposed on dementia and mortality in hospitalized older adults: A prospective cohort study
- Development of an adaptive, personalized, and scalable dementia care program: Early findings from the Care Ecosystem
- Genetic assessment of age-associated Alzheimer disease risk: Development and validation of a polygenic hazard score
- Age-related cognitive decline and associations with sex, education and apolipoprotein E genotype across ethnocultural groups and geographic regions: a collaborative cohort study
- The impact of individual Cognitive Stimulation Therapy (iCST) on cognition, quality of life, caregiver health, and family relationships in dementia: A randomised controlled trial
- Effectiveness of an intervention to facilitate prompt referral to memory clinics in the United Kingdom: Cluster randomised controlled trial
- Subjective and objective cognitive function among older adults with a history of traumatic brain injury: A population-based cohort study
- Association of lifelong exposure to cognitive reserve-enhancing factors with dementia risk: A community-based cohort study
- Multimorbidity and healthcare utilization among home care clients with dementia in Ontario, Canada: A retrospective analysis of a population-based cohort
- PLOS Medicine
- Archiv čísel
- Aktuální číslo
- Informace o časopisu
Nejčtenější v tomto čísle- Effectiveness of an intervention to facilitate prompt referral to memory clinics in the United Kingdom: Cluster randomised controlled trial
- , , and mutations in early-onset Alzheimer disease: A genetic screening study of familial and sporadic cases
- Challenges and opportunities in understanding dementia and delirium in the acute hospital
- Early diagnosis of mild cognitive impairment and mild dementia through basic and instrumental activities of daily living: Development of a new evaluation tool
Kurzy
Zvyšte si kvalifikaci online z pohodlí domova
Současné možnosti léčby obezity
nový kurzAutoři: MUDr. Martin Hrubý
Všechny kurzyPřihlášení#ADS_BOTTOM_SCRIPTS#Zapomenuté hesloZadejte e-mailovou adresu, se kterou jste vytvářel(a) účet, budou Vám na ni zaslány informace k nastavení nového hesla.
- Vzdělávání


