-
Články
Top novinky
Reklama- Vzdělávání
- Časopisy
Top články
Nové číslo
- Témata
Top novinky
Reklama- Videa
- Podcasty
Nové podcasty
Reklama- Kariéra
Doporučené pozice
Reklama- Praxe
Top novinky
ReklamaChildhood adiposity and risk of type 1 diabetes: A Mendelian randomization study
Tove Fall and colleagues, using a Mendelian randomization study, show support for the link between childhood adiposity and increased risk of type 1 diabetes.
Published in the journal: . PLoS Med 14(8): e32767. doi:10.1371/journal.pmed.1002362
Category: Research Article
doi: https://doi.org/10.1371/journal.pmed.1002362Summary
Tove Fall and colleagues, using a Mendelian randomization study, show support for the link between childhood adiposity and increased risk of type 1 diabetes.
Introduction
The incidence of type 1 diabetes (T1D) in children is rising globally, with reports of annual increases over the last decades of up to 3%–4% in Europe [1,2] and 5% in North America [1]. The reasons for this rapid increase in T1D remain obscure [3]. Years before overt T1D develops, autoantibodies against pancreatic islet cells can be detected [4], and the presence of at least 2 types of autoantibodies is diagnostic of early T1D [5]. The etiology of T1D is generally thought to be autoimmune, where a chronic T lymphocyte-mediated autoimmune reaction is presumed to destroy the insulin-producing beta cells in the pancreas following a trigger event such as an infection [5–7]. This concept, however, has been challenged by recent observations [8,9]. The heritability of T1D is estimated to be 69% [10], but genetic variation alone cannot explain the recent rapid increase. Several environmental risk factors and potential triggers of the autoimmunity have been investigated, including intake of cow's milk, breastfeeding practices, socioeconomic status, and enteroviral infections, but causal effects have not been proven [3].
In 1975, Baum et al. [11] suggested that increased weight gain in infancy is linked to the development of T1D. Later theories, including the “accelerator hypothesis” [12] and the “overload hypothesis” [13] suggest that increased insulin resistance and insulin demand, as seen in, for example, obese individuals, cause beta cell stress and apoptosis and thereby induce autoimmunity. Both theories argue that this would cause T1D to present at a younger age [12,13]. In support of this hypothesis, the insulin sensitivity-increasing genetic variant Pro12Ala in PPARG was found to be associated with a lower risk of T1D [14]. For the past decades, the prevalence of childhood obesity has increased by approximately 0.5% annually in the United States and 1% per year in England, Scotland, and Wales [15]. Currently, an estimated 6.6% of all children under the age of 5 years are obese worldwide [16]. Given increasing global rates of childhood obesity, an effect of adiposity on the rising incidence of T1D has been suggested [15,17]. In some countries, like the United Kingdom, the increase in childhood obesity has started to plateau [18]—as has the incidence of T1D [2]. However, several observational studies have failed to find a link between childhood adiposity and T1D risk [19] or age of onset [20–22]. One problem with studying the association of adiposity and T1D is that weight loss is a common symptom in T1D, and prospective studies are therefore needed. Another problem is that T1D is an infrequent disease, whilst large sample sizes are needed for robust inference in prospective designs. Verbeeten et al. [23] performed a meta-analysis of studies measuring body mass index (BMI) before T1D diagnosis. The study found an increased risk of T1D in obese children estimated to an odds ratio (OR) of 2.03 (95% confidence interval [CI] 1.46–2.80) and evidence of a dose-response relationship with an OR of 1.25 (95% CI 1.04–1.51) per unit increase in age - and sex-specific standard deviation score of childhood body mass index (SDS-BMI). Another meta-analysis showed positive correlations between higher birth weight as well as rapid weight gain in infants and T1D risk [24]. Further, a recent study in 1,117 autoantibody-positive children found that elevated BMI over time was associated with higher risk of progression to T1D in youth [25].
Common issues with observational studies such as confounding and reverse causation can be avoided by using instrumental variable (IV) analysis, in which an IV is used as a nonconfounded proxy for the exposure of interest (here adiposity) [26]. In Mendelian randomization (MR) analysis, genetic variants are used as IVs. Since allelic variants are randomly allocated at conception, their lifelong effects precede the outcome (T1D) and minimize bias from reverse causation and confounding. This "quasirandomization" before birth has been reported able to predict the results of clinical trials [27,28]. However, the robustness of MR relies heavily on the validity of the genetic variants used as IVs. One assumption is the absence pleiotropic effects: the IV should not affect the outcome through factors other than the exposure. This assumption cannot be tested completely, but recently developed sensitivity analyses can indicate and correct for violations [29].
Our aim was to use the largest available samples with genetic association results to test the hypothesis of a role for childhood adiposity in childhood T1D etiology. We applied a comprehensive 2-sample MR framework to investigate the effect of childhood adiposity on T1D diagnosis before age 17 and found evidence in line with a role in T1D development.
Methods
Ethical approval
Cohorts participating in the genome-wide association studies (GWASs) used in the present study received ethics approval from local institutional review boards and informed written consent from all participants.
Genetic instrument
To construct a genetic IV for childhood adiposity, we used data from the largest meta-analysis of GWASs of childhood adiposity to date (by Felix et al. [30]), in which adiposity was measured as SDS-BMI at the oldest age of available measurement in children of European descent between 2–10 years of age. The design included up to 35,668 children from 20 studies in the discovery phase and up to 11,873 children from 13 studies in the replication phase. The study identified 15 loci associated with childhood BMI that explained 2.0% of the observed variance [30]. We used the following criteria to select variants as IVs: (1) genome-wide association (p < 5 × 10⁻⁸) with childhood SDS-BMI (15 single nucleotide polymorphisms [SNPs]); (2) suggestive association with childhood adiposity (p < 5 x 10⁻⁶ in both discovery and joint analysis) and association with adult BMI (Bonferroni-adjusted p < 0.0055) [31] with consistent effect direction in children and adults (7 SNPs); and (3) genome-wide significant association with adult BMI [31] and childhood BMI (Bonferroni-adjusted p < 5.2 x 10⁻⁴) with consistent effect direction (22 SNPs). There were substantial overlaps of the latter with the 2 former categories, and we kept 1 marker per genetic loci, with preference to the 2 former categories resulting in a total of 27 SNPs. However, the variant rs3888190 was not available in the T1D dataset described below and hence excluded, resulting in 26 SNPs. We conducted 2 analyses, using the combined IVs described above (23 SNP score after further exclusions, see below) and a restricted instrument of variants identified in category 1 (13 SNP score).
To reduce the risk of violating the IV assumptions, we investigated the IVs' associations with 3 biologically plausible confounders—birth weight, smoking, and years of education. Summary-level effect estimates and standard errors (SEs) for birth weight were obtained from the EGG (Early Growth Genetics) Consortium [32], for “ever smoker” from the Tobacco and Genetics Consortium [33], and for years of education from the Social Science Genetic Association Consortium [34]. All effects were aligned to the BMI-increasing allele.
Three SNPs were associated with a potential confounder at a Bonferroni-corrected p-value (p < 0.05 / 26; for 26 SNPs) and were excluded from the analysis (rs13387838, smoking; rs1808579, education; and rs13253111, birth weight), resulting in a final analytical set of 23 SNPs and 13 SNPs respectively.
Association with T1D
Summary-level association results for the final set of 23 SNPs were extracted from the largest publicly available T1D GWAS, which was conducted by Cooper et al. [35]. Cooper et al. reanalyzed the data from Barrett et al. [36] with imputation to the 1000 Genomes Project phase III panel in 5,913 samples from individuals with T1D and 8,828 reference samples from individuals of European ancestry. In brief, samples from individuals with T1D were derived from the Wellcome Trust Case Control Consortium, the 1958 Birth Cohort, and from the UK Genetic Resource for Investigating Diabetes (GRID) collection of the Juvenile Diabetes Research Foundation/Wellcome Trust Diabetes and Inflammation Laboratory project [37]. The average age at diagnosis of T1D was 7.8 years (SD 3.9) in the Wellcome Trust Case Control Consortium and 7.2 years (SD 3.8) in GRID. T1D criteria were diagnosis before age 17 and continuous insulin treatment since diagnosis for more than 6 months. Individuals with monogenic types of diabetes were excluded [37,38]. A population-based sample from the UK Blood Services, the 1958 Birth Cohort, and the Wellcome Trust Case Control Consortium was used as the control cohort and combined with a study of bipolar disease to maximize power (as implemented in the original analysis [36]). Table 1 summarizes the final dataset, with details on genotyping platform and baseline characteristics. The quality metrics “info score” from the imputation software IMPUTE2 was >0.6 for all variants in the T1D data. For 1 SNP (rs3829849) unavailable in the T1D data, we used the proxy (rs62578127) with an r2 of 1 based on SNiPA (http://snipa.helmholtz-muenchen.de/snipa3/). Data for the T1D GWAS are deposited in the Dryad repository: http://dx.doi.org/10.5061/dryad.ns8q3 [39].
Tab. 1. Description of sample sources for the T1D GWAS. 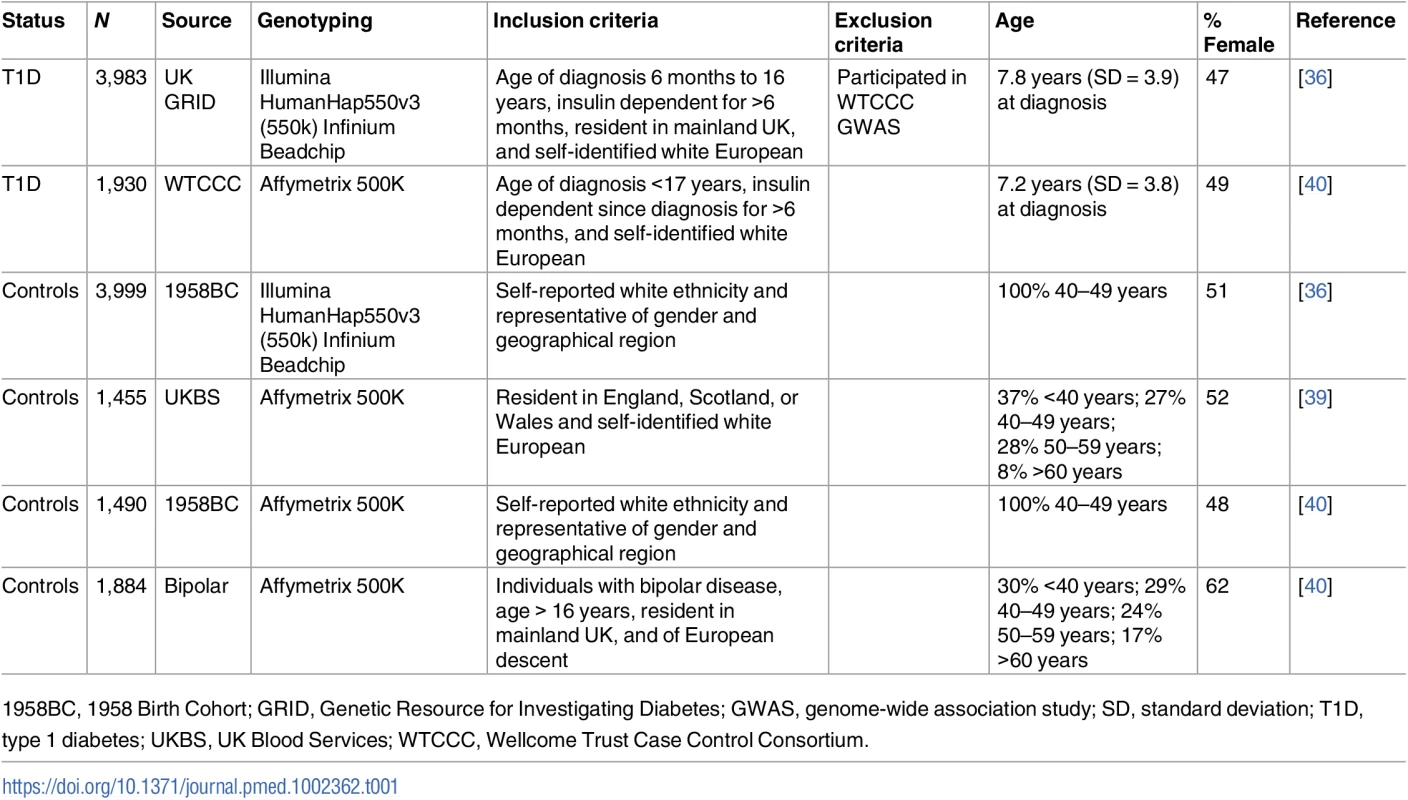
1958BC, 1958 Birth Cohort; GRID, Genetic Resource for Investigating Diabetes; GWAS, genome-wide association study; SD, standard deviation; T1D, type 1 diabetes; UKBS, UK Blood Services; WTCCC, Wellcome Trust Case Control Consortium. Main analysis
For all SNPs, we used the effect estimate and SE estimated in the childhood BMI GWAS (Table 2). For all outcomes and sensitivity analyses, effects were aligned to the BMI-increasing allele reported in [41]. Inverse-variance weighted (IVW) estimates for the effect of adiposity on T1D risk were calculated using the analysis code provided in [26].
Tab. 2. Association of adiposity-related genetic variants with childhood body mass index and type 1 diabetes. 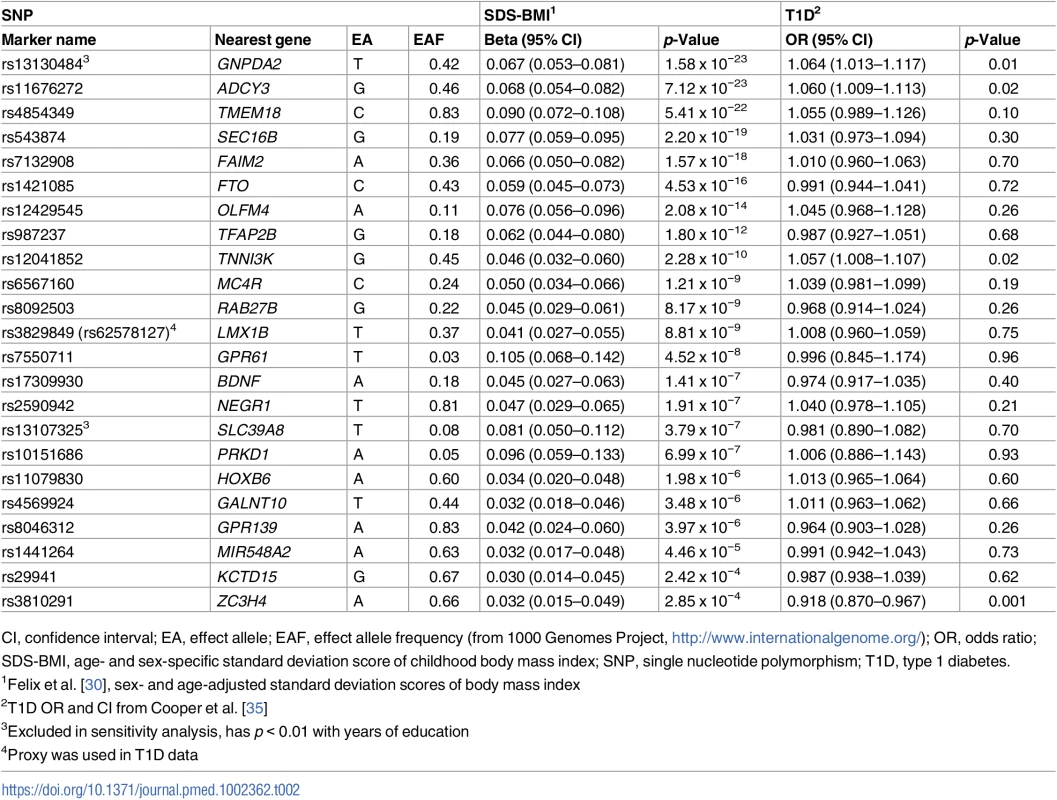
CI, confidence interval; EA, effect allele; EAF, effect allele frequency (from 1000 Genomes Project, http://www.internationalgenome.org/); OR, odds ratio; SDS-BMI, age- and sex-specific standard deviation score of childhood body mass index; SNP, single nucleotide polymorphism; T1D, type 1 diabetes. Sensitivity analysis
There is no one "gold standard" way of conducting an MR study. All available methods have advantages and shortcomings that balance power, precision, and adjustment for bias. We therefore carried out several sensitivity methods in addition to IVW MR to provide a comprehensive causal inference framework of the available evidence in an epidemiologic context. We compared results from the main analysis with those obtained in reanalysis with more robust methods, which are less powerful but rely on fewer assumptions than IVW MR. The following calculations and graphs were implemented using the software code provided in [26,29].
Assessment of the IV assumptions
We used visual assessment of heterogeneity and a formal heterogeneity test to assess the compatibility of IV estimates based on individual genetic variants. Heterogeneity among such estimates indicates that analysis based on different SNPs yields different estimates, which is indicative of pleiotropic effects. We further used funnel plots of IV precisions (1/SEIV) against the IV estimates, which should form a symmetrical funnel shape (i.e., more precise estimates are less variable). Asymmetries in this type of plot indicate directional pleiotropy. We formally tested this with the intercept test in MR Egger regression and further assessed the association of the 2 SNP sets with birth weight, education, and smoking in IVW MR.
Robust analysis methods
We first reanalyzed the data with a likelihood-based method [42], which in case of considerable imprecision in the estimates of the association of the genetic variants with the exposure gives appropriately sized CIs. We then obtained IVW estimates using random effects models, which provide a more appropriate model in the presence of heterogeneity. Third, we used MR Egger regression, allowing for asymptotically consistent estimates even if all the genetic instruments are invalid based on the assumption of the Instrument Strength Independent of Direct Effect (InSIDE) postulate (i.e., the potential pleiotropic effects are not related to instrument strength [43]). In addition, the simple and weighted median-based methods were applied. Median methods provide accurate estimates if 50% or more of the included variants are valid instruments. We also calculated the effect of childhood adiposity on birth weight, years of education, and smoking using similar MR methods as in the main analysis. For the statistical analyses, R version 3.2.3 [44] was used as well as packages “shape” [45], “meta” [46], “Hmisc” [47], and “MendelianRandomization.” For plots, packages “ggplot2,” “gridExtra,” and “grid” were used. We also reran the analysis excluding 2 SNPs (rs13130484 and rs13107325) associated with lower education at a nominal level (p < 0.01), as proposed in [26].
Multivariable Mendelian randomization
We further applied regression models of the association of adiposity SNPs with T1D correcting for the genetic association with potential confounders birth weight, smoking, and education, using the methods described in [48], in which the regression model is weighted by the inverse SE of the T1D estimate and the intercept is null.
Results
Main analysis
The IVW method provided evidence for a positive association between SDS-BMI and T1D, with an OR of 1.32 (95% CI 1.06–1.64; that is an average 32% increased risk of T1D per SD increase in BMI) for the larger SNP set (23 SNPs) and an OR of 1.55 (95% CI 1.21–1.99) for the smaller set of 13 SNPs.
Sensitivity analysis
Assessment of the IV assumptions
The heterogeneity test did not support heterogeneity in the data (p = 0.053 and 0.342, for the set of 23 SNPs and the set of 13 SNPs, respectively). However, scatter plots indicated that rs3810291 (nearest gene ZC3H4) might add heterogeneity (Fig 1, upper right panel). We checked phenotype associations of this SNP in PhenoScanner [49] but did not identify any reported significant (p < 0.01) effects on traits not related to adiposity and therefore kept this SNP in the analysis. The funnel plot shown in Fig 1 (lower right panel) implied directional pleiotropy biasing the results towards the null for the larger set of 23 SNPs, as confirmed by a nominally significant MR Egger regression intercept test (p = 0.036). For the smaller set of 13 SNPs, asymmetry was more difficult to judge but appeared less pronounced, as mirrored in an MR Egger regression intercept test (p = 0.615). We found that the larger set of 23 SNPs was associated with birth weight (0.07 SD increase in birth weight, 95% CI 0.04–0.10; per SD increase in childhood BMI) and with increased risk of smoking with an OR of 1.14 (95% CI 1.02–1.28) (Figs 2 and 3). The smaller set of 13 SNPs was associated with birth weight only (0.06 SD increase, 95% CI 0.02–0.10).
Fig. 1. Sensitivity analysis. 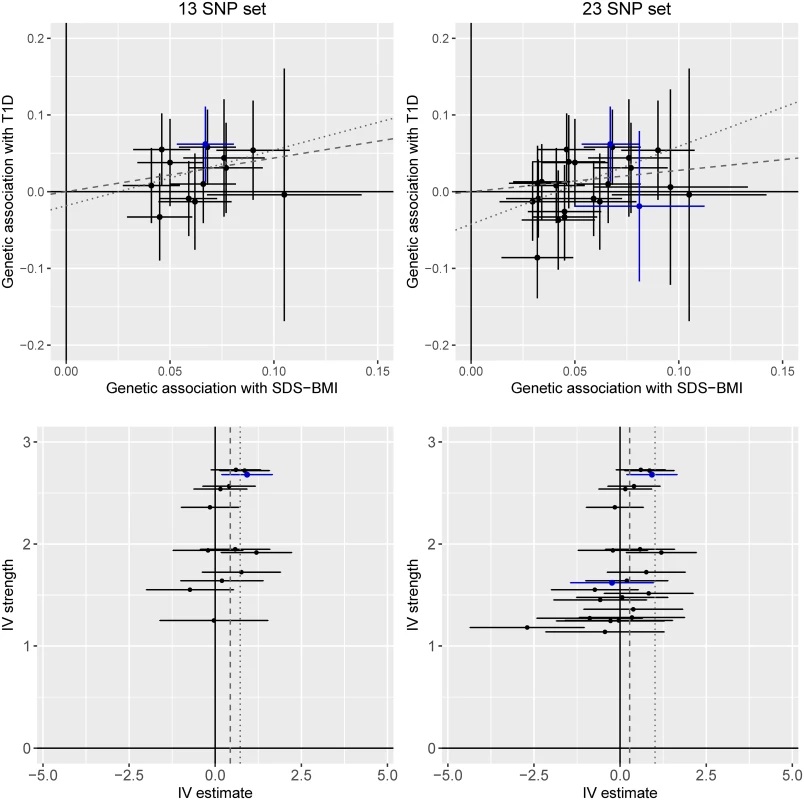
Upper panels show scatter plots of genetic association with type 1 diabetes over genetic associations with SDS-BMI. Lines represent 95% confidence intervals. The lower panels show funnel plots of instrumental variable precision against instrumental variable estimates for genetic associations between SDS-BMI and type 1 diabetes. In all panels, the dashed line represents slopes/estimates for inverse-variance-weighted analysis, and the dotted line represents the slope from MR Egger regression. rs13130484 and rs13107325 were nominally associated (p < 0.01) with education and marked with blue color. IV, instrumental variable; SDS-BMI, age- and sex-specific standard deviation score of childhood body mass index; SNP, single nucleotide polymorphism; T1D, type 1 diabetes. Fig. 2. Association of childhood adiposity-related genetic variants with birth weight. 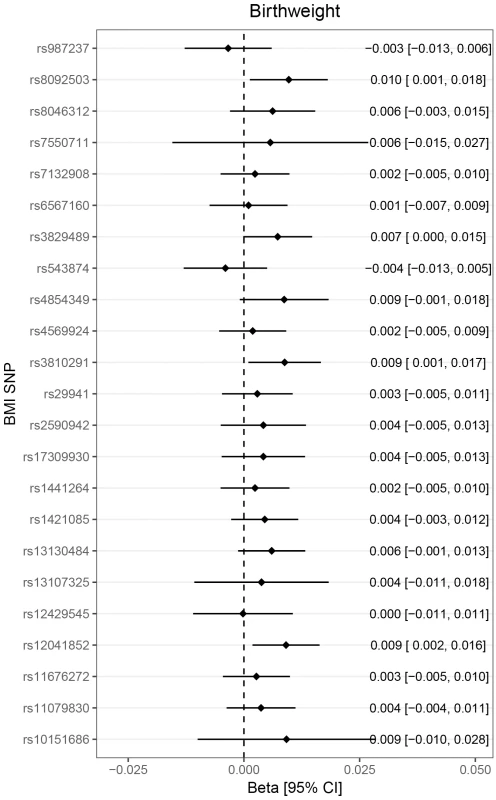
Lines represent 95% confidence intervals. Note that because of the large number of SNPs investigated, the threshold for nominal significance was set to p < 0.01. No SNP was alone associated with birthweight, but the combined score showed a positive association. BMI, body mass index; CI, confidence interval; SNP, single nucleotide polymorphism. Fig. 3. Association of childhood adiposity-related genetic variants with “ever smoker.” 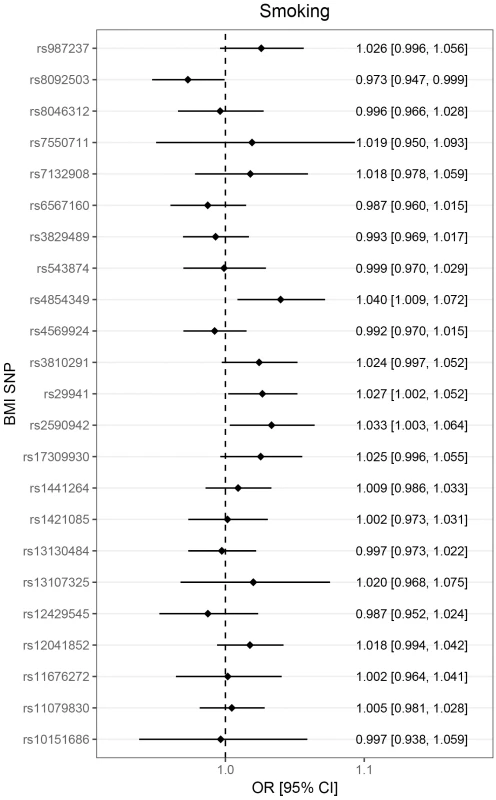
Lines represent 95% confidence intervals. Note that because of the large number of SNPs investigated, the threshold for nominal significance was set to p < 0.01. No SNP was alone associated with smoking, but the combined score showed a positive association. BMI, body mass index; CI, confidence interval; OR, odds ratio; SNP, single nucleotide polymorphism. Robust analysis methods
The likelihood-based method provided similar results as the main analysis with an OR of 1.33 (95% CI 1.07–1.66) for the larger SNP set of 23 SNPs and an OR of 1.55 (95% CI 1.21–2.00) for the smaller set of 13 SNPs, indicating that the genetic associations with the risk factor were precisely estimated. Identical results to the main analysis were achieved when SEs were calculated using the random-effects model, indicating that the variability of estimates was not less than would be expected by chance [29]. For the larger SNP set of 23 SNPs, MR Egger regression yielded an OR of 2.76 (95% CI 1.40–5.44 and 1.24–6.11, using fixed and random weights for calculating SEs, respectively). For the smaller SNP set of 13 SNPs, MR Egger regression yielded an OR of 2.06 (95% CI 0.68–6.23 and 0.61–6.95, using fixed and random weights for calculating SEs, respectively).
The simple median-based method and the weighted median estimate, only including the median 50% of the genetic instruments, resulted in similar estimates as the main analysis. Removing the 2 SNPs with nominal association to education (rs13130484 and rs13107325, Fig 4) slightly attenuated the IVW estimates to an OR of 1.26 (1.00–1.59) and an OR of 1.45 (1.11–1.90), respectively, for the larger and the smaller set of SNPs.
Fig. 4. Association of childhood adiposity-related genetic variants with years of education. 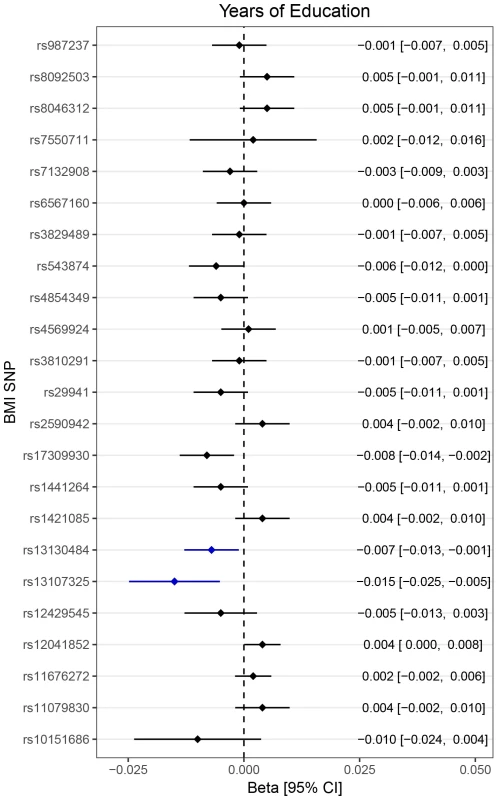
Lines represent 95% confidence intervals. Note that because of the large number of SNPs investigated, the threshold for nominal significance was set to p < 0.01. rs13130484 and rs13107325 were nominally associated with education and marked with blue color. BMI, body mass index; CI, confidence interval; SNP, single nucleotide polymorphism. Multivariable Mendelian randomization
In regression models of the association of the 23 adiposity SNPs with T1D adjusted for genetic effects on birth weight, smoking, and education, we estimated that adiposity increases T1D risk with an OR of 1.65 (95% CI, 1.08–2.53) per SDS-BMI increase.
Fig 5 summarizes results from the main and the sensitivity analyses.
Fig. 5. Summary of estimates from the different types of analysis. 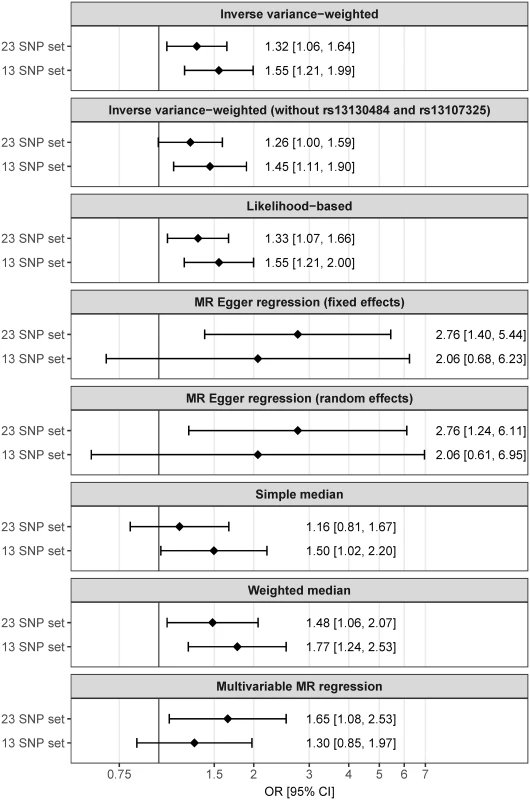
Lines represent 95% CIs. CI, confidence interval; MR, Mendelian randomization; OR, odds ratio; SNP, single nucleotide polymorphism. Discussion
The main finding of our study is that genetic variants predisposing to childhood adiposity may confer an increased risk of T1D, and we found evidence of a positive correlation between the effect on adiposity and T1D risk. Conditional on MR assumptions being satisfied, our study provides genetic support for a role of childhood adiposity in childhood T1D etiology. Our results support previous findings from observational studies and may indicate a link between the increase in global childhood obesity and T1D incidence in recent decades. We performed rigorous testing of MR assumptions and found evidence of (1) directional pleiotropy (biasing results towards the null) and (2) an association of the genetic score with smoking and birth weight. We therefore performed a series of methods robust to directional pleiotropy that confirmed the main results in favor of an effect of childhood adiposity on T1D independent of measured and unmeasured confounding effects.
Biological mechanisms
Previous studies investigating a relationship between childhood adiposity and T1D using observational techniques in case-control and cohort studies have been contradictory [19–22,24,50,51]. However, in the meta-analysis by Verbeeten et al. [23], the pooled OR estimate for T1D risk per SD increase in BMI was 1.25 (95% CI 1.04–1.51), which is overlapping to our estimates from IVW and MR Egger regression. Different theories as to how childhood adiposity could contribute to the pathogenesis of T1D have been suggested. Obese individuals have a higher expression of proinflammatory adipokines, such as interleukin-6 [52] and tumor necrosis factor alpha [53]. These have been suggested to contribute to chronic subclinical inflammation promoting autoimmunity [54]. Leptin, an adipokine that is increased in obese persons [55], has been shown to accelerate immune-modulated destruction of beta cells in mice [56], and obese individuals have lower concentrations of the adipokine adiponectin that was shown to protect beta cells from apoptosis [57] and autoimmunity in animals [58]. Together, these effects could contribute to autoimmunity and beta cell death [54,56,57]. In contrast, the “accelerator hypothesis” [12] and the “overload hypothesis” [13] suggest that obesity contributes to insulin resistance and increased insulin demand. This would lead to beta cell stress and apoptosis, which could induce autoimmunity and cause T1D to present at an earlier age. Even if adiposity by itself does not cause T1D but rather accelerates disease onset, any delay in disease progress achieved by reducing adiposity would greatly benefit children at risk of T1D, as the likelihood of complication increases over time [59].
Potential bias from pleiotropic effects
There are few established early-life risk factors for T1D. We chose to include 3 potential confounders in the present study where genetic data are available: birth weight, education level, and smoking. Genetic variants linked to increased birth weight are reported to be associated with higher risk of childhood obesity but lower risk of cardiometabolic disease in adulthood, including measures of insulin and glycemic traits [32]. The association of birth weight with T1D is unclear [60]. Further, some studies have pointed at an increased risk for T1D with higher socioeconomic class in Westernized countries [61]. A meta-analysis by Behl et al. [62] did not provide evidence for an association of parental smoking habits with T1D risk in their offspring. The average age of diagnosis in the present study was less than 8 years, and length of education and personal smoking habits may be irrelevant at this young age. However, parents share half of their genomes with their children, and we therefore explored these potential confounders. We removed 3 SNPs that were each associated with 1 of these confounders from the analysis. We also identified an overall association of the genetic instrument with increased birth weight and increased odds of smoking and therefore conducted an analysis adjusted for these variables, which supported our main results.
Our study includes a number of statistical analyses to detect bias from pleiotropy (i.e., effects of the genetic instrument not mediated by adiposity), and we detected that our main analysis may have been biased toward null results. In directional pleiotropy-robust MR Egger regression, we confirmed our main results.
These analyses did not reveal evidence of pleiotropic effects in any specific SNP, but we want to highlight a few interesting loci, although their associated genes have not been conclusively identified. The closest gene to rs13130484 with strong association with both childhood adiposity and T1D, GNPDA2, is involved in the hexosamine biosynthesis pathway, which is involved in cellular metabolic sensing and insulin resistance [63]. TMEM18 is the closest gene to the SNP rs4854349, which showed the largest effect size for both SDS-BMI and T1D. Although variants related to this gene have been associated with BMI and insulin concentrations, little is known of its function. A study in Drosophila melanogaster implicated TMEM18 in insulin/glucagon regulation [64]. The variant rs11676272 is among the SNPs most strongly associated with childhood adiposity and is also nominally associated with T1D. It is located in the gene ADCY3, which has roles in intracellular signaling, including the insulin secretion pathway [65]. Although ADCY3 has been associated with locomotor activity, food intake, and leptin sensitivity in mice [66], the exact mechanisms for its effect on obesity are unclear.
Despite the possible involvement of the GNDPA2, TMEM18, and ADCY3 loci in insulin resistance, insulin/glucagon regulation, and insulin secretion, respectively, we chose to retain them in the IV analysis. The prevailing paradigm puts autoimmunity at the core of the development of T1D, and impaired insulin secretion may likely occur secondary to the autoimmunity [5]. As insulin is a key regulator of lipogenesis, it is not surprising that genes involved in insulin secretion and signaling are amongst the important candidate genes for the obesity phenotype. None of the SNPs were identified as outliers in heterogeneity tests, although low power limits their interpretation.
Strengths and limitations
Strengths of our study include the IV analysis design, the large study sample, and the detailed investigation of possible violations of MR assumptions. Our study selected genetic instruments associated with childhood rather than adult adiposity to test for effects specific to early-life BMI in patients diagnosed with T1D before 17 years of age. The limited age range in the T1D analysis limits heterogeneity in the diabetes phenotype and also restricts the exposure period to childhood.
Limitations of the present study include those that apply to all MR studies; the IV assumptions are stringent, yet it is often impossible to ascertain that genetic instruments fulfill the criteria. For many of the instruments used in the present study, the underlying gene is unknown. Without knowledge of the biological mechanisms, it is difficult to ascertain bias from pleiotropy. Yet, if rigorous sensitivity analyses support the main findings (as in our study), a causal effect is plausible [29]. Some of the sensitivity methods add additional assumptions, such as that potential pleiotropic effects are not related to instrument strength (InSIDE) [43]. In general, all point estimates from the sensitivity analysis yielded consistent or more extreme estimates, but in some instances with larger CIs overlapping the null.
Whilst the T1D dataset we used was the largest publicly available GWAS to our knowledge, MR analyses require large samples to yield precise results, and our study would have benefited from increased sample size. Finally, our results need to be confirmed, preferably in a large, independent study to exclude a chance finding.
Conclusion
We have conducted an MR study investigating the relationship between childhood adiposity and T1D. Our results are in line with a role for adiposity in T1D etiology and show consistency in sensitivity analyses. As MR assumptions are not fully testable, our results, although confirmed in sensitivity tests, provide moderate but not conclusive evidence of causation. Given the worldwide increasing rates of childhood obesity and T1D, concerted global efforts to reduce excess body weight in early life to prevent adverse health consequences are strongly supported by our findings.
Zdroje
1. The Diamond Project Group. Incidence and trends of childhood Type 1 diabetes worldwide 1990–1999. Diabetic Medicine. 2006;23(8):857–66. doi: 10.1111/j.1464-5491.2006.01925.x 16911623
2. Patterson CC, Gyürüs E, Rosenbauer J, Cinek O, Neu A, Schober E, et al. Trends in childhood type 1 diabetes incidence in Europe during 1989–2008: evidence of non-uniformity over time in rates of increase. Diabetologia. 2012;55(8):2142–7. doi: 10.1007/s00125-012-2571-8 22638547
3. Christoffersson G, Rodriguez-Calvo T, von Herrath M. Recent advances in understanding Type 1 Diabetes. F1000Research. 2016;5:F1000 Faculty Rev-110. doi: 10.12688/f1000research.7356.1 26918165
4. Ziegler AG, Rewers M, Simell O, Simell T, Lempainen J, Steck A, et al. Seroconversion to multiple islet autoantibodies and risk of progression to diabetes in children. JAMA. 2013;309(23):2473–9. doi: 10.1001/jama.2013.6285 23780460.
5. Insel RA, Dunne JL, Atkinson MA, Chiang JL, Dabelea D, Gottlieb PA, et al. Staging Presymptomatic Type 1 Diabetes: A Scientific Statement of JDRF, the Endocrine Society, and the American Diabetes Association. Diabetes Care. 2015;38(10):1964–74. doi: 10.2337/dc15-1419 26404926
6. Nerup J, Andersen OO, Bendixen G, Egeberg J, Gunnarsson R, Kromann H, et al. Cell-mediated Immunity in Diabetes Mellitus. Proceedings of the Royal Society of Medicine. 1974;67(6 Pt 1):506–13. 4604192
7. Lieberman SM, DiLorenzo TP. A comprehensive guide to antibody and T-cell responses in type 1 diabetes. Tissue Antigens. 2003;62(5):359–77. doi: 10.1034/j.1399-0039.2003.00152.x 14617043
8. Atkinson MA, von Herrath M, Powers AC, Clare-Salzler M. Current concepts on the pathogenesis of type 1 diabetes—considerations for attempts to prevent and reverse the disease. Diabetes Care. 2015;38(6):979–88. doi: 10.2337/dc15-0144 25998290.
9. Skog O, Korsgren S, Melhus A, Korsgren O. Revisiting the notion of type 1 diabetes being a T-cell-mediated autoimmune disease. Curr Opin Endocrinol Diabetes Obes. 2013;20(2):118–23. doi: 10.1097/MED.0b013e32835edb89 23422243.
10. Condon JJ. A study of diabetes mellitus within a large sample of Australian twins. Twin research and human genetics. 11(1):28–40. doi: 10.1375/twin.11.1.28 18251672
11. Baum J, Ounsted M, Smith M. Letter: Weight gain in infancy and subsequent development of diabetes mellitus in childhood. The Lancet (British edition). 2(7940):866.
12. Wilkin TJ. The accelerator hypothesis: weight gain as the missing link between Type I and Type II diabetes. Diabetologia. 2001;44(7):914–22. doi: 10.1007/s001250100548 11508279
13. Dahlquist G. Can we slow the rising incidence of childhood-onset autoimmune diabetes? The overload hypothesis. Diabetologia. 2006;49(1):20–4. doi: 10.1007/s00125-005-0076-4 16362279
14. Raj SM, Howson JM, Walker NM, Cooper JD, Smyth DJ, Field SF, et al. No association of multiple type 2 diabetes loci with type 1 diabetes. Diabetologia. 2009;52(10):2109–16. doi: 10.1007/s00125-009-1391-y 19455305.
15. Lobstein T, Baur L, Uauy R. Obesity in children and young people: a crisis in public health. Obesity Reviews. 2004;5 : 4–85. doi: 10.1111/j.1467-789X.2004.00133.x 15096099
16. United Nations Children’s Fund, World Health Organization, The World Bank. UNICEF-WHO-World Bank Joint Child Malnutrition Estimates. UNICEF, New York; WHO, Geneva; The World Bank, Washington, DC. 2012.
17. Liston A, Todd JA, Lagou V. Beta-Cell Fragility As a Common Underlying Risk Factor in Type 1 and Type 2 Diabetes. Trends Mol Med. 2017;23(2):181–94. doi: 10.1016/j.molmed.2016.12.005 28117227.
18. Copley VR, Bray C. Changes in children’s body mass index in England between 2006/7 and 2014/15: National Child Measurement Programme. London: Public Health England. October 2016
19. Lamb MM, Yin X, Zerbe GO, Klingensmith GJ, Dabelea D, Fingerlin TE, et al. Height growth velocity, islet autoimmunity and type 1 diabetes development: the Diabetes Autoimmunity Study in the Young. Diabetologia. 2009;52(10):2064–71. doi: 10.1007/s00125-009-1428-2 19547949
20. O’Connell MA, Donath S, Cameron FJ. Major increase in Type 1 diabetes—no support for the Accelerator Hypothesis. Diabetic Medicine. 2007;24(8):920–3. doi: 10.1111/j.1464-5491.2007.02203.x 17535289
21. Giménez M, Aguilera E, Castell C, de Lara N, Nicolau J, Conget I. Relationship Between BMI and Age at Diagnosis of Type 1 Diabetes in a Mediterranean Area in the Period of 1990–2004. Diabetes Care. 2007;30(6):1593–5. doi: 10.2337/dc06-2578 17372154
22. Porter JR, Barrett TG. Braking the Accelerator Hypothesis? Diabetologia. 2004;47(2):352–3. doi: 10.1007/s00125-003-1291-5 14666370
23. Verbeeten KC, Elks CE, Daneman D, Ong KK. Association between childhood obesity and subsequent Type 1 diabetes: a systematic review and meta-analysis. Diabetic Medicine. 2011;28(1):10–8. doi: 10.1111/j.1464-5491.2010.03160.x 21166841
24. Harder T, Roepke K, Diller N, Stechling Y, Dudenhausen JW, Plagemann A. Birth Weight, Early Weight Gain, and Subsequent Risk of Type 1 Diabetes: Systematic Review and Meta-Analysis. American Journal of Epidemiology. 2009;169(12):1428–36. doi: 10.1093/aje/kwp065 19363100
25. Ferrara CT, Geyer SM, Liu YF, Evans-Molina C, Libman IM, Besser R, et al. Excess BMI in Childhood: A Modifiable Risk Factor for Type 1 Diabetes Development. Diabetes Care. 2017. doi: 10.2337/dc16-2331 28202550.
26. Burgess S, Scott RA, Timpson NJ, Davey Smith G, Thompson SG, Epic - InterAct Consortium. Using published data in Mendelian randomization: a blueprint for efficient identification of causal risk factors. European Journal of Epidemiology. 2015;30(7):543–52. doi: 10.1007/s10654-015-0011-z 25773750
27. Ference BA, Robinson JG, Brook RD, Catapano AL, Chapman MJ, Neff DR, et al. Variation in PCSK9 and HMGCR and Risk of Cardiovascular Disease and Diabetes. New England Journal of Medicine. 2016;375(22):2144–53. doi: 10.1056/NEJMoa1604304 27959767.
28. Voight BF, Peloso GM, Orho-Melander M, Frikke-Schmidt R, Barbalic M, Jensen MK, et al. Plasma HDL cholesterol and risk of myocardial infarction: a mendelian randomisation study. Lancet. 2012;380(9841):572–80. Epub 2012/05/23. doi: 10.1016/S0140-6736(12)60312-2 22607825.
29. Burgess S, Bowden J, Fall T, Ingelsson E, Thompson SG. Sensitivity analyses for robust causal inference from Mendelian randomization analyses with multiple genetic variants. Epidemiology. Published Online: September 26, 2016; Published Ahead of Print. doi: 10.1097/ede.0000000000000559 27749700
30. Felix JF, Bradfield JP, Monnereau C, van der Valk RJP, Stergiakouli E, Chesi A, et al. Genome-wide association analysis identifies three new susceptibility loci for childhood body mass index. Human Molecular Genetics. 2016;25(2):389–403. doi: 10.1093/hmg/ddv472 26604143
31. Locke AE, Kahali B, Berndt SI, Justice AE, Pers TH, Day FR, et al. Genetic studies of body mass index yield new insights for obesity biology. Nature. 2015;518(7538):197–206. doi: 10.1038/nature14177 25673413.
32. Horikoshi M, Beaumont RN, Day FR, Warrington NM, Kooijman MN, Fernandez-Tajes J, et al. Genome-wide associations for birth weight and correlations with adult disease. Nature. 2016;538(7624):248–52. doi: 10.1038/nature19806 27680694.
33. The Tobacco and Genetics Consortium. Genome-wide meta-analyses identify multiple loci associated with smoking behavior. Nature genetics. 2010;42(5):441–7. doi: 10.1038/ng.571 20418890
34. Okbay A, Beauchamp JP, Fontana MA, Lee JJ, Pers TH, Rietveld CA, et al. Genome-wide association study identifies 74 loci associated with educational attainment. Nature. 2016;533(7604):539–42. doi: 10.1038/nature17671 27225129.
35. Cooper NJ, Wallace C, Burren OS, Cutler A, Walker N, Todd JA. Type 1 diabetes genome-wide association analysis with imputation identifies five new risk regions. bioRxiv. 2017. doi: 10.1101/120022
36. Barrett JC, Clayton DG, Concannon P, Akolkar B, Cooper JD, Erlich HA, et al. Genome-wide association study and meta-analysis find that over 40 loci affect risk of type 1 diabetes. Nature genetics. 2009;41(6):703–7. doi: 10.1038/ng.381 19430480
37. Barrett JC, Clayton D, Concannon P, Akolkar B, Cooper JD, Erlich HA, et al. Genome-wide association study and meta-analysis finds over 40 loci affect risk of type 1 diabetes. Nature genetics. 2009;41(6):703–7. doi: 10.1038/ng.381 19430480
38. The Wellcome Trust Case Control Consortium. Genome-wide association study of 14,000 cases of seven common diseases and 3,000 shared controls. Nature. 2007;447(7145):661–78. doi: 10.1038/nature05911 17554300
39. Cooper N. Data from Type 1 diabetes genome-wide association analysis with imputation identifies five new risk regions. (2017) Dryad Digital Repository. Openly available via http://dx.doi.org/10.5061/dryad.ns8q3.
40. Wellcome Trust Case Control C. Genome-wide association study of 14,000 cases of seven common diseases and 3,000 shared controls. Nature. 2007;447(7145):661–78. doi: 10.1038/nature05911 17554300.
41. Felix JF, Bradfield JP, Monnereau C, van der Valk RJ, Stergiakouli E, Chesi A, et al. Genome-wide association analysis identifies three new susceptibility loci for childhood body mass index. Hum Mol Genet. 2016;25(2):389–403. doi: 10.1093/hmg/ddv472 26604143.
42. Burgess S, Scott RA, Timpson NJ, Davey Smith G, Thompson SG, Consortium E-I. Using published data in Mendelian randomization: a blueprint for efficient identification of causal risk factors. Eur J Epidemiol. 2015;30(7):543–52. doi: 10.1007/s10654-015-0011-z 25773750.
43. Bowden J, Davey Smith G, Burgess S. Mendelian randomization with invalid instruments: effect estimation and bias detection through Egger regression. International Journal of Epidemiology. 2015;44(2):512–25. doi: 10.1093/ije/dyv080 26050253
44. R Core Team. R: A Language and Environment for Statistical Computing. Vienna, Austria. 2015. https://www.R-project.org/.
45. Soetaert K. Shape: Functions for Plotting Graphical Shapes, Colors. R package version 1.4.2. 2014. https://CRAN.R-project.org/package=shape.
46. Schwarzer G. Meta: General Package for Meta-Analysis. R package version 4.3–2. 2015.https://CRAN.R-project.org/package=meta.
47. Harrell F, with contributions from Dupont C and many others. Hmisc: Harrell Miscellaneous. R package version 4.0–0. 2016. https://CRAN.R-project.org/package=Hmisc.
48. Burgess S, Dudbridge F, Thompson SG. Re: "Multivariable Mendelian randomization: the use of pleiotropic genetic variants to estimate causal effects". Am J Epidemiol. 2015;181(4):290–1. doi: 10.1093/aje/kwv017 25660081.
49. Staley JR, Blackshaw J, Kamat MA, Ellis S, Surendran P, Sun BB, et al. PhenoScanner: a database of human genotype-phenotype associations. Bioinformatics. 2016;32(20):3207–9. doi: 10.1093/bioinformatics/btw373 27318201.
50. Group ESS. Rapid early growth is associated with increased risk of childhood type 1 diabetes in various European populations. Diabetes Care. 2002;25(10):1755–60. 12351473.
51. Ljungkrantz M, Ludvigsson J, Samuelsson U. Type 1 diabetes: increased height and weight gains in early childhood. Pediatr Diabetes. 2008;9(3 Pt 2):50–6. doi: 10.1111/j.1399-5448.2007.00360.x 18540867.
52. Yeste D, Vendrell J, Tomasini R, Broch M, Gussinye M, Megia A, et al. Interleukin-6 in obese children and adolescents with and without glucose intolerance. Diabetes Care. 2007;30(7):1892–4. doi: 10.2337/dc06-2289 17416792.
53. Hotamisligil GS, Arner P, Caro JF, Atkinson RL, Spiegelman BM. Increased adipose tissue expression of tumor necrosis factor-alpha in human obesity and insulin resistance. Journal of Clinical Investigation. 1995;95(5):2409–15. doi: 10.1172/JCI117936 7738205
54. Versini M, Jeandel P-Y, Rosenthal E, Shoenfeld Y. Obesity in autoimmune diseases: Not a passive bystander. Autoimmunity Reviews. 2014;13(9):981–1000. doi: 10.1016/j.autrev.2014.07.001 25092612
55. Maffei M, Halaas J, Ravussin E, Pratley RE, Lee GH, Zhang Y, et al. Leptin levels in human and rodent: measurement of plasma leptin and ob RNA in obese and weight-reduced subjects. Nat Med. 1995;1(11):1155–61. 7584987.
56. Matarese G, Sanna V, Lechler RI, Sarvetnick N, Fontana S, Zappacosta S, et al. Leptin Accelerates Autoimmune Diabetes in Female NOD Mice. Diabetes. 2002;51(5):1356. 11978630
57. Wijesekara N, Krishnamurthy M, Bhattacharjee A, Suhail A, Sweeney G, Wheeler MB. Adiponectin-induced ERK and Akt Phosphorylation Protects against Pancreatic Beta Cell Apoptosis and Increases Insulin Gene Expression and Secretion. The Journal of Biological Chemistry. 2010;285(44):33623–31. doi: 10.1074/jbc.M109.085084 20709750
58. Pang TTL, Chimen M, Goble E, Dixon N, Benbow A, Eldershaw SE, et al. Inhibition of Islet Immunoreactivity by Adiponectin Is Attenuated in Human Type 1 Diabetes. The Journal of Clinical Endocrinology & Metabolism. 2013;98(3):E418–E28. doi: 10.1210/jc.2012-3516 23386639.
59. The Diabetes Control Complications Trial Research Group. The Effect of Intensive Treatment of Diabetes on the Development and Progression of Long-Term Complications in Insulin-Dependent Diabetes Mellitus. New England Journal of Medicine. 1993;329(14):977–86. doi: 10.1056/NEJM199309303291401 8366922.
60. Khashan AS, Kenny LC, Lundholm C, Kearney PM, Gong T, McNamee R, et al. Gestational Age and Birth Weight and the Risk of Childhood Type 1 Diabetes: A Population-Based Cohort and Sibling Design Study. Diabetes Care. 2015;38(12):2308–15. doi: 10.2337/dc15-0897 26519334.
61. Calixto O-J, Anaya J-M. Socioeconomic status. The relationship with health and autoimmune diseases. Autoimmunity Reviews. 2014;13(6):641–54. doi: 10.1016/j.autrev.2013.12.002 24418307
62. Behl M, Rao D, Aagaard K, Davidson TL, Levin ED, Slotkin TA, et al. Evaluation of the Association between Maternal Smoking, Childhood Obesity, and Metabolic Disorders: A National Toxicology Program Workshop Review. Environmental Health Perspectives. 2013;121(2):170–80. doi: 10.1289/ehp.1205404 23232494
63. Oikari S, Makkonen K, Deen AJ, Tyni I, Kärnä R, Tammi RH, et al. Hexosamine biosynthesis in keratinocytes: roles of GFAT and GNPDA enzymes in the maintenance of UDP-GlcNAc content and hyaluronan synthesis. Glycobiology. 2016;26(7):710–22. doi: 10.1093/glycob/cww019 26887390
64. Wiemerslage L, Gohel PA, Maestri G, Hilmarsson TG, Mickael M, Fredriksson R, et al. The Drosophila ortholog of TMEM18 regulates insulin and glucagon-like signaling. Journal of Endocrinology. 2016;229(3):233–43. doi: 10.1530/JOE-16-0040 27029472
65. Wu L, Shen C, Seed Ahmed M, Östenson CG, Gu HF. Adenylate cyclase 3: a new target for anti-obesity drug development. Obesity Reviews. 2016;17(9):907–14. doi: 10.1111/obr.12430 27256589
66. Wang Z, Li V, Chan GCK, Phan T, Nudelman AS, Xia Z, et al. Adult Type 3 Adenylyl Cyclase–Deficient Mice Are Obese. PLoS ONE. 2009;4(9):e6979. doi: 10.1371/journal.pone.0006979 19750222
Štítky
Interní lékařství
Článek vyšel v časopisePLOS Medicine
Nejčtenější tento týden
2017 Číslo 8- Berberin: přírodní hypolipidemikum se slibnými výsledky
- Léčba bolesti u seniorů
- Příznivý vliv Armolipidu Plus na hladinu cholesterolu a zánětlivé parametry u pacientů s chronickým subklinickým zánětem
- Jak postupovat při výběru betablokátoru − doporučení z kardiologické praxe
- Červená fermentovaná rýže účinně snižuje hladinu LDL cholesterolu jako vhodná alternativa ke statinové terapii
-
Všechny články tohoto čísla
- Harmonization of community health worker programs for HIV: A four-country qualitative study in Southern Africa
- Gestational diabetes mellitus and interpregnancy weight change: A population-based cohort study
- Association of pre-pregnancy body mass index with offspring metabolic profile: Analyses of 3 European prospective birth cohorts
- Pregnant and breastfeeding women: A priority population for HIV viral load monitoring
- Malaria, malnutrition, and birthweight: A meta-analysis using individual participant data
- Childhood adiposity and risk of type 1 diabetes: A Mendelian randomization study
- Unsupervised primaquine for the treatment of malaria relapses in southern Papua: A hospital-based cohort study
- Effectiveness of a brief behavioural intervention on psychological distress among women with a history of gender-based violence in urban Kenya: A randomised clinical trial
- Impact of fortified versus unfortified lipid-based supplements on morbidity and nutritional status: A randomised double-blind placebo-controlled trial in ill Gambian children
- Identification of factors associated with stillbirth in the Indian state of Bihar using verbal autopsy: A population-based study
- Counting stillbirths and achieving accountability: A global health priority
- Evaluating the impact of Affordable Care Act repeal on America's opioid epidemic
- Benefits and safety of gabapentinoids in chronic low back pain: A systematic review and meta-analysis of randomized controlled trials
- Evaluation of novel computerized tomography scoring systems in human traumatic brain injury: An observational, multicenter study
- Assessing the impact of healthcare research: A systematic review of methodological frameworks
- Lay worker-administered behavioral treatments for psychological distress in resource-limited settings: Time to move from evidence to practice?
- Antimicrobial resistance: The complex challenge of measurement to inform policy and the public
- PLOS Medicine
- Archiv čísel
- Aktuální číslo
- Informace o časopisu
Nejčtenější v tomto čísle- Childhood adiposity and risk of type 1 diabetes: A Mendelian randomization study
- Benefits and safety of gabapentinoids in chronic low back pain: A systematic review and meta-analysis of randomized controlled trials
- Lay worker-administered behavioral treatments for psychological distress in resource-limited settings: Time to move from evidence to practice?
- Evaluating the impact of Affordable Care Act repeal on America's opioid epidemic
Kurzy
Zvyšte si kvalifikaci online z pohodlí domova
Současné možnosti léčby obezity
nový kurzAutoři: MUDr. Martin Hrubý
Všechny kurzyPřihlášení#ADS_BOTTOM_SCRIPTS#Zapomenuté hesloZadejte e-mailovou adresu, se kterou jste vytvářel(a) účet, budou Vám na ni zaslány informace k nastavení nového hesla.
- Vzdělávání


