-
Články
Top novinky
Reklama- Vzdělávání
- Časopisy
Top články
Nové číslo
- Témata
Top novinky
Reklama- Videa
- Podcasty
Nové podcasty
Reklama- Kariéra
Doporučené pozice
Reklama- Praxe
Top novinky
ReklamaComparison of the Schwartz and CKD-EPI Equations for Estimating Glomerular Filtration Rate in Children, Adolescents, and Adults: A Retrospective Cross-Sectional Study
In this retrospective cross-sectional study, Luciano da Silva Selistre and colleagues compare Schwartz and CDK-EPI equations for estimating glomerular filtration rate in patients of different ages and degrees of renal impairment.
Published in the journal: . PLoS Med 13(3): e32767. doi:10.1371/journal.pmed.1001979
Category: Research Article
Summary
In this retrospective cross-sectional study, Luciano da Silva Selistre and colleagues compare Schwartz and CDK-EPI equations for estimating glomerular filtration rate in patients of different ages and degrees of renal impairment.
Introduction
In the past decade, kidney disease has been recognized as a major public health burden. The prevalence of chronic kidney disease (CKD) currently exceeds 10% of the general population [1,2]. The two major hallmarks of CKD—reduced glomerular filtration rate (GFR) and increased urinary albumin excretion—are strong and graded prognostic factors of morbidity and mortality regardless of patient age, sex, ethnicity, or comorbidities. As preventing or slowing the progression of CKD toward end-stage renal disease relies mainly on early detection, international recommendations have been proposed for the diagnosis and management of CKD in the general population [1,3,4].
The assessment of GFR is currently the accepted surrogate marker of nephron endowment and a surveillance tool to monitor the progression of renal disease. Ideally, GFR should be measured by renal clearance of an exogenous marker that is exclusively eliminated by glomerular filtration (inulin, iohexol, chromium-51 ethylenediaminetetraacetic acid, etc.). However, for practical reasons, GFR measurement cannot be performed in routine clinical practice. Instead, serum levels of endogenous filtration markers, such as plasma creatinine (PCr), have traditionally been used to estimate GFR, along with urinary measurements in some cases [2]. Effective renal plasma flow is also an important tool for monitoring renal function, especially during the management of CKD or glomerular hyperfiltration [2–4]. However, effective renal plasma flow was not widely available at the time of the present study.
Thus, despite some drawbacks, isotope dilution mass spectrometry (IDMS)–calibrated PCr determination is now widely used as a noninvasive method for GFR measurement [2,4–6]. Indeed, though PCr determination is easy to perform, its results vary considerably between laboratories. To reduce this variation, all major manufacturers offer IDMS-calibrated PCr measurement procedures. Moreover, PCr concentration varies considerably within and between individuals because it depends on age, sex, muscle mass, nutritional state, diet, etc. [1,2,4]. This led to the development of several PCr-based GFR estimating equations in children and adults. These equations help physicians estimate GFR according to the patient’s characteristics and limit the uncertainty of an isolated PCr determination.
Among several GFR estimating equations, the Chronic Kidney Disease Epidemiology Collaboration (CKD-EPI) equation has been recommended in adults, and the Schwartz equation in children [3,4,7,8] (Table 1). Various studies have investigated the reliability of these equations at different CKD severity levels, but they did not investigate their reliability at different ages, especially at the transition from childhood to adulthood [9–13]. Actually, most adult PCr-based equations were developed in middle-aged or older individuals with various pathological conditions, not in young adults or adolescents [11,12,14,15]. Moreover, pediatric equations, such as the adjusted Schwartz equation, were developed in a small number of adolescents and only in individuals with mild to severe CKD [7].
Tab. 1. Formulas used for the estimation of glomerular filtration rate (ml/min/1.73 m2). 
To convert PCr values in μmol/l to mg/dl, divide by 88.4. In clinical practice, equation use in middle-aged individuals is a daily issue, and priority should be given to easy-to-use equations. Thus, there is a need for a comprehensive examination of the reliability of the most recommended PCr-based equations according to age [9,10]. The objectives of our study were the following: (1) to assess the reliability of the two most commonly used IDMS-calibrated PCr-based equations (i.e., Schwartz and CKD-EPI) and (2) to assess and compare the performance of these two equations across various age and GFR ranges.
Methods
Study Population
The study considered a cross-sectional retrospective sample of 10,610 individuals. It included all eligible individuals 3 to 90 y old referred between 22 July 2003 and 7 July 2014 to a single university department (namely, the Renal and Metabolic Function Exploration Unit of Edouard Herriot Hospital, Lyon, France) to undergo GFR measurement for suspected or established renal dysfunction or renal risk, or before kidney donation.
The exclusion criteria were as follows: (1) treatment by dialysis at the time of the study; (2) taking cimetidine, trimethoprim, or intravenous injections of albumin or diuretics before GFR measurement; (3) GFR >160 ml/min/1.73 m2; (4) GFR measurement by iohexol clearance.
The data were extracted from a database that included urinary clearance of inulin as measurement of GFR. In addition, the data included the clinical indication for the test, demographic data from a standardized interview, and measurements of blood pressure, pulse, and body mass index (BMI). Other blood and urine laboratory results were available in the hospital laboratory database.
During the study period, some participants had several GFR measurements, but, for the present study, only the first GFR measurement in each participant was kept for analysis. (See the flow chart in Fig 1)
Fig. 1. Flow chart of the study. 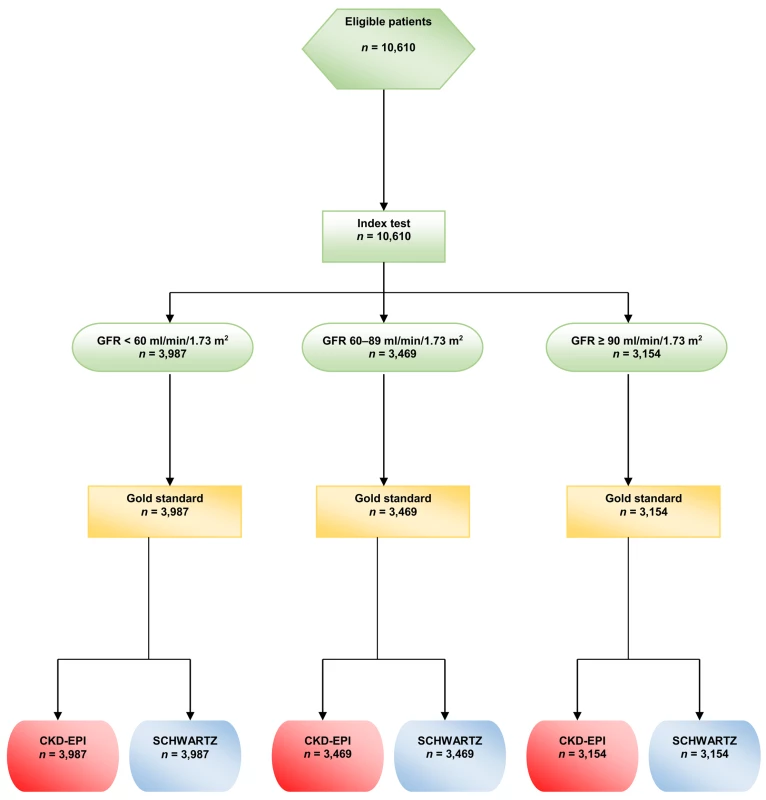
All the procedures were carried out in accordance with the ethical standards of institutional and/or national research committees and of the 1964 Helsinki Declaration and its later amendments or comparable ethical standards. Precisely, an appropriate written informed consent was obtained from all the participants or their legal representatives. The consent form contained information on the procedure itself as well as on the possibility of later use of the data for research purposes. According to current French law, an observational study that does not change the routine management of patients does not need to be declared or submitted to the opinion of a research ethics board ([16] and its subsequent amendments).
Data Collection
Reliability assessment and comparisons between the two GFR equations were carried out on different age classes and different categories of measured GFR (mGFR). Based on previous studies on kidney physiology [17,18], the study considered five age classes: 2–12, 13–17, 18–40, 41–64, and ≥65 y. Various studies have shown that GFR declines steadily with age, starting at age 30–40 y, with an apparent acceleration after age 65–70 y [19]. Because our population included very different numbers of participants per age class in terms of Kidney Disease Improving Global Outcomes (KDIGO) categories IIIa, IIIb, and IV, we considered only three categories of renal function: <60, 60–89, and ≥90 ml/min/1.73 m2 [2].
Age, height, and weight were recorded. In participants <18 y old, the BMI was expressed as z-score according to the height-for-age and height-for-sex growth charts in France [20,21].
Laboratory Assessments
Measurement of inulin clearance is still considered the gold standard for GFR measurement. Renal clearance of inulin was measured using a polyfructosan-based method (Inutest, Fresenius Kabi). A standard technique was used by a trained staff with a continuous infusion after a 30-mg/kg priming dose of polyfructosan. Water diuresis was induced by an initial oral administration of 5 ml/kg of water followed by 3 ml/kg every 30 min combined with an intravenous infusion of 0.9% sodium chloride. Three to four urine samples were collected, and a blood sample was drawn midway through each collection period. The clearance value, calculated by the usual UV/P formula, was the mean value of three to four clearance periods. The measurements of plasma and urine polyfructosan were performed using the same enzymatic method, which demonstrated very good specificity and reproducibility (within-run precision <1% and between-run precision <3.5%) [11]. The results were expressed per 1.73 m2 according to the Dubois formula: body surface area = height0.725 × weight0.425 × 0.007184.
All PCr measurements were performed with methods traceable to the National Institute of Standards and Technology creatinine standard reference (IDMS calibrated). From 10 October 2003 to 23 June 2010, PCr was measured by a kinetic, colorimetric, compensated Jaffé technique (Roche Modular); results were standardized by linear regression adjustment versus the concentrations obtained by liquid chromatography mass spectrometry. The calibration equation was as follows: standardized PCr = 0.9395 × Jaffé compensated serum creatinine (in μmol/l) + 4.6964. The coefficient of correlation was 0.97. From 24 June 2010, all PCr values were obtained by an enzymatic method traceable to the National Institute of Standards and Technology. According to KDIGO, the two techniques are considered similar [2]. PCr is expressed in μmol/l.
GFR estimation was carried out the same day inulin clearance was measured; estimated GFR (eGFR) was expressed in ml/min/1.73 m2 and was calculated with two PCr-based equations: CKD-EPI and Schwartz (Table 1) [2].
Albuminuria was expressed as the ratio of urine albumin to urine creatinine, and the participants were separated into three categories: (i) normal: <3 mg/mmol (<30 mg/g), (ii) increased: 3–30 mg/mmol (30–300 mg/g), and (iii) high: >30 mg/mmol (300 mg/g).
Statistical Analyses
The bias, precision, and accuracy of the Schwartz and CKD-EPI equations were estimated for each age class and each category of renal function. Bias was defined as the mean of the eGFR/mGFR ratio. In a first step, the eGFR/mGFR ratio was modeled according to a linear mixed-effects model with random intercept to quantify the effect of the equation type (CKD-EPI or Schwartz equation) on the bias. The mean ratios according to the two equations were compared by a t-test in the linear mixed-effects model. In a second step, two models were built: a first model that included the variables “equation type” and “age class” and a second model that included an interaction between the variables “equation type” and “age class.” The second model allows quantification of the change of the effect of the equation type according to age. An ANOVA was used to compare the two nested models and draw conclusions regarding the statistical significance of the interaction. This analysis was carried out on the entire sample and on each category of renal function.
Precision was defined as the interquartile range (IQR) of the eGFR/mGFR ratio. Following the KDIGO guidelines, accuracy was defined at two levels: P10, the percentage of eGFR values within the 10% percent limits above and below the mGFR, and P30, the percentage of eGFR values within the 30% percent limits above and below the mGFR [2]. The 95% CIs of the IQR and accuracy values were obtained by bootstrap using the percentiles method. This method consists in taking the 2.5th and the 97.5th percentiles of the distribution of the IQR and accuracy values estimated on 2,000 bootstrap samples [22]. We used the ratio of eGFR to mGFR, instead of the difference, to assess the bias and precision of the two equations because the between-individual heterogeneity of the difference increased with GFR value. The use of the ratio allowed us to obtain a constant heterogeneity.
The analyses were performed with R for Windows, version 3.1.1 (http://cran.r-project.org/). The nominal p-value used to determine statistical significance was p < 0.05. (For STARD checklist and the full statistical plan see S1 and S2 Texts).
Results
Participants’ Characteristics
The clinical characteristics of the 10,610 participants are shown in Table 2. The median age of the participants was 50.8 y. Within the age range 3–90 y, 1,180 participants (11.0%) were less than 18 y, and 2,326 (22.0%) were aged 18 to 40 y. Among adult participants (≥18 y), 606 (6.4%) had a BMI < 18.5 kg/m2, and 441 (4.7%) had a BMI ≥35 kg/ m2.
Tab. 2. Characteristics of the patients in the different mGFR categories. 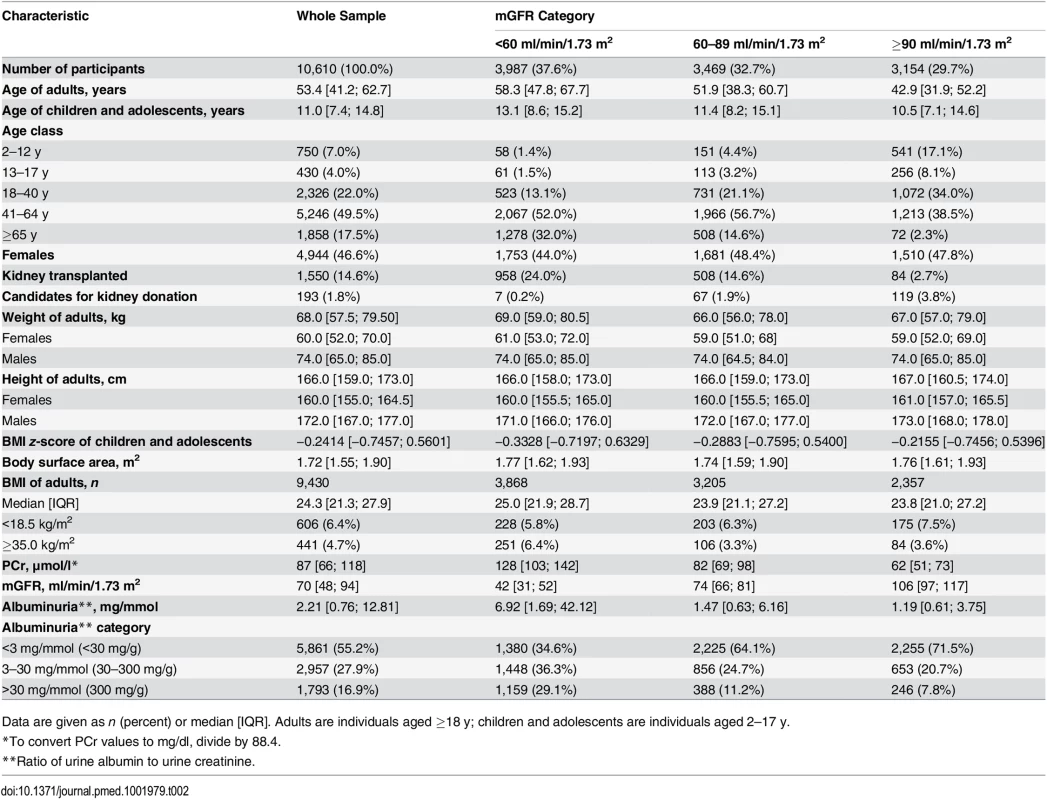
Data are given as n (percent) or median [IQR]. Adults are individuals aged ≥18 y; children and adolescents are individuals aged 2–17 y. The population consisted of three major groups of indication for GFR measurement: 193 candidates for living kidney donation, 8,867 cases of native CKD, and 1,550 kidney transplant recipients. The mean ± standard deviation of mGFR was 72.0 ± 32.0 ml/min/1.73 m2. Within the mGFR range of 3–160 ml/min/1.73 m2, 37.6% of the participants had values <60, 32.7% had values from 60 to 89, and 29.7% had values ≥90 ml/min/1.73 m2. The participants with mGFR values < 60 ml/min/1.73 m2 were older and had higher albuminuria values than the others. In the whole sample 1,793 participants (16.9%) had a ratio of urine albumin to urine creatinine > 30 mg/mmol (300 mg/g).
Modeling of Bias According to Equation Type and Age
In the whole sample, the mean eGFR/mGFR ratio according to the CKD-EPI equation was significantly higher than the mean eGFR/mGFR ratio according to the Schwartz equation (1.17 [95% CI 1.16; 1.18] versus 1.08 [95% CI 1.07; 1.09], p < 0.001, t-test). The interaction between the type of equation and age class was statistically significant (p < 0.001, ANOVA). This indicates that the mean ratios given by the two equations have different changes with increasing age class (Table 3). With the Schwartz equation, the mean ratio was close to 1 in children and adolescents (2–17 y) and young adults (18–40 y) (1.03 [95% CI 1.01; 1.04] and. 0.96 [0.90; 1.01], respectively) but high in participants aged 65 y and older (1.24 [95% CI 1.18; 1.30]). With the CKD-EPI equation, the mean ratio was high in children but decreased with increasing age; it was closer to 1 than the mean ratio from the Schwartz equation in participants older than 65 y (0.93 [95% CI 0.89; 0.97]) (Table 3).
Tab. 3. Estimation of bias (mean eGFR/mGFR ratio) with the CKD-EPI and Schwartz equations according to age class in the whole sample and in different mGFR categories. 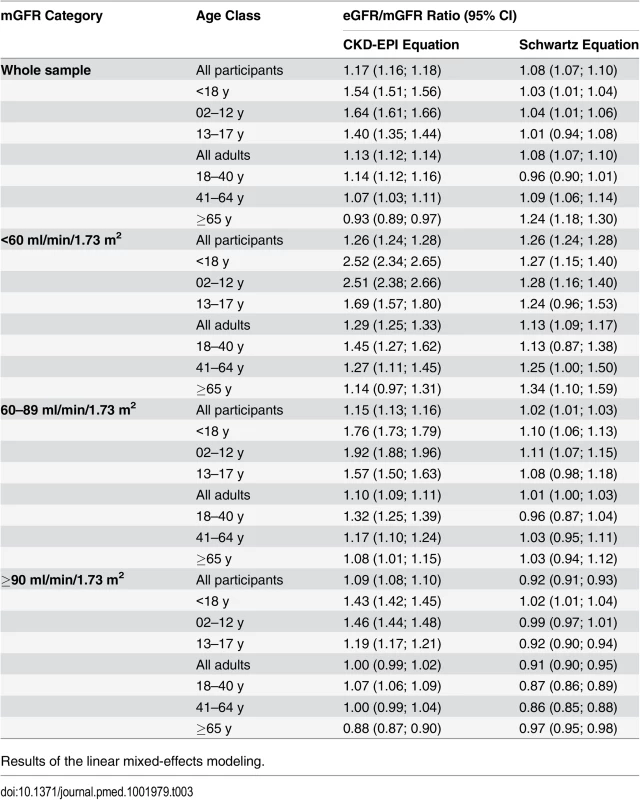
Results of the linear mixed-effects modeling. The interaction between the equation type and the age class was statistically significant in the three categories of mGFR. Whatever the mGFR category, the mean eGFR/mGFR ratio with the CKD-EPI equation was high in children and adolescents (<18 y) (1.54 [95% CI 1.51; 1.56]). In the mGFR category 60–89 ml/min/1.73 m2, the mean eGFR/mGFR ratios with the Schwartz equation were closer to 1 than the mean eGFR/mGFR ratios with the CKD-EPI equation for participants of all ages (1.02 [95% CI 1.01; 1.03] versus 1.15 [95% CI 1.13; 1.16], respectively, p < 0.001, t-test) (Table 3).
Equation Precision and Accuracy
In children and adolescents (<18 y), the Schwartz equation performed better than the CKD-EPI equation regarding precision (IQR: 0.23 [95% CI 0.21; 0.24] versus 0.33 [95% CI 0.31; 0.34]) and accuracy (P10 : 46.7 [95% CI 44.0; 49.6] versus 8.4 [95% CI 6.0;10.0]; P30 : 86.4 [95% CI 88.6; 90.4] versus 29.4 [95% CI 26.8; 32.0]) (Tables 4 and 5; Figs 2 and 3). In addition, the Schwartz equation was slightly better than the CKD-EPI equation in young adults (18–40 y) regarding precision (IQR: 0.26 [95% CI 0.25; 0.27] versus 0.27 [95% CI 0.26; 0.28]) and P30 accuracy (86.5 [95% CI 85.0; 87.8] versus 81.0 [95% CI 79.5; 82.6]) (Tables 4 and 5; Figs 2 and 3).
Fig. 2. Estimation of P30 accuracy of the CKD-EPI and Schwartz equations according to age class and mGFR. 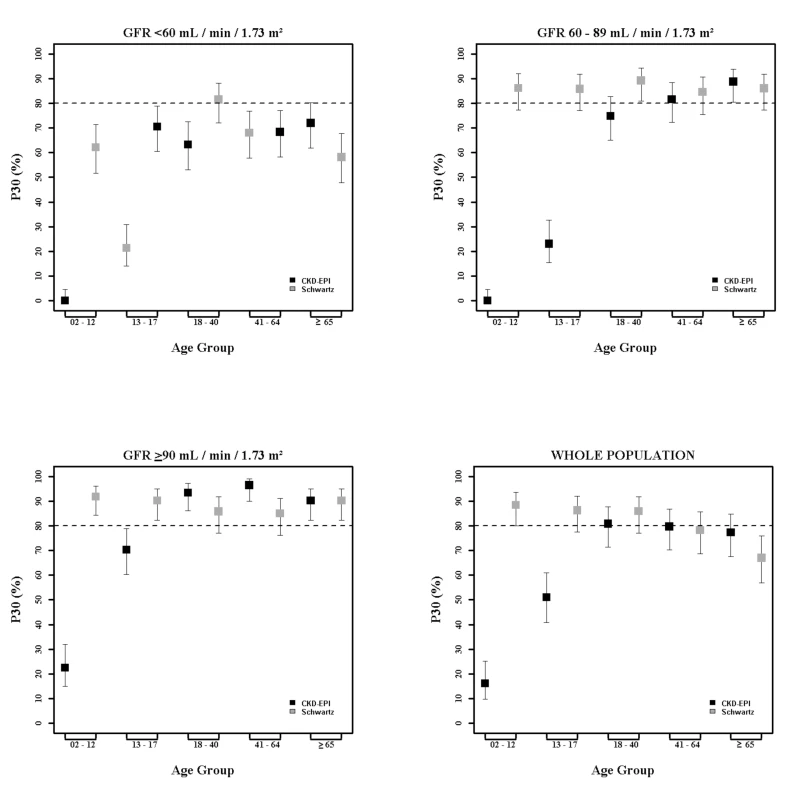
Fig. 3. Box plots showing eGFR/mGFR ratios according to age class and stage of chronic kidney disease. 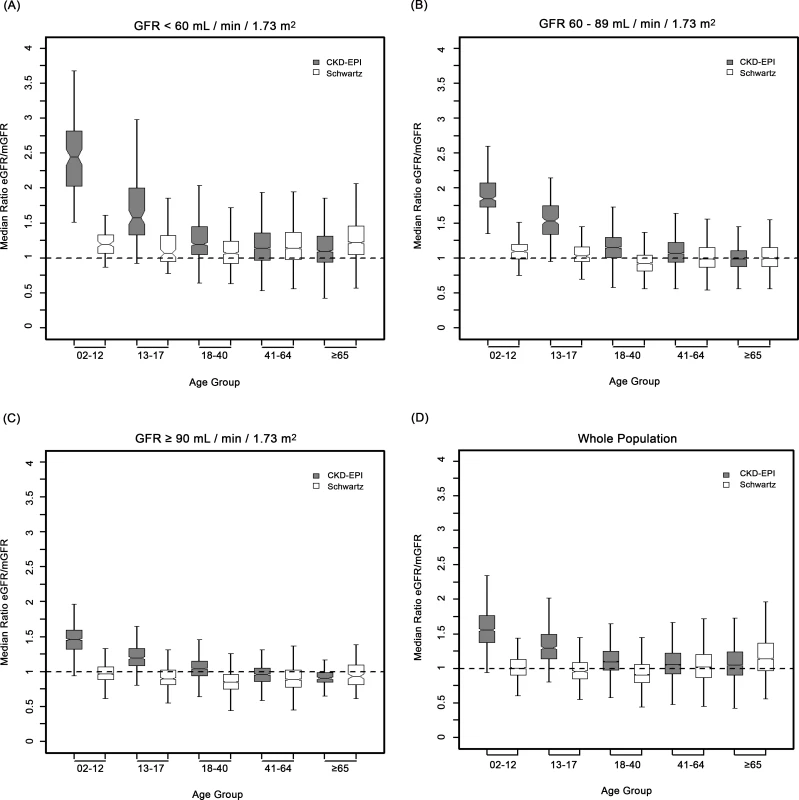
Tab. 4. Precision and accuracy of the CKD-EPI and Schwartz equations according to age and mGFR in children and adolescents. 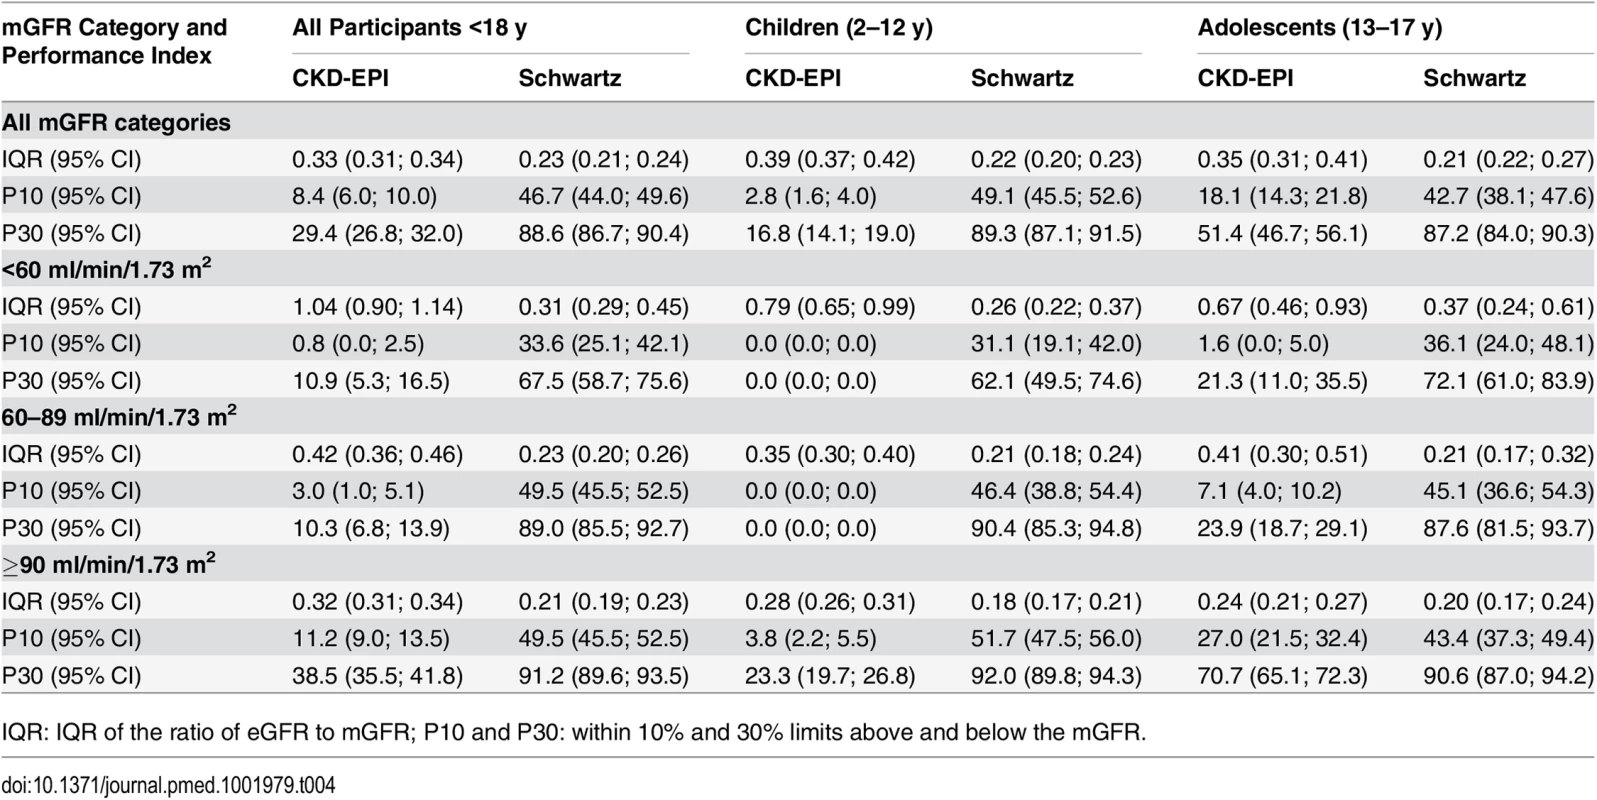
IQR: IQR of the ratio of eGFR to mGFR; P10 and P30: within 10% and 30% limits above and below the mGFR. Tab. 5. Precision and accuracy of the CKD-EPI and Schwartz equations according to age and mGFR in adults (≥18 y). 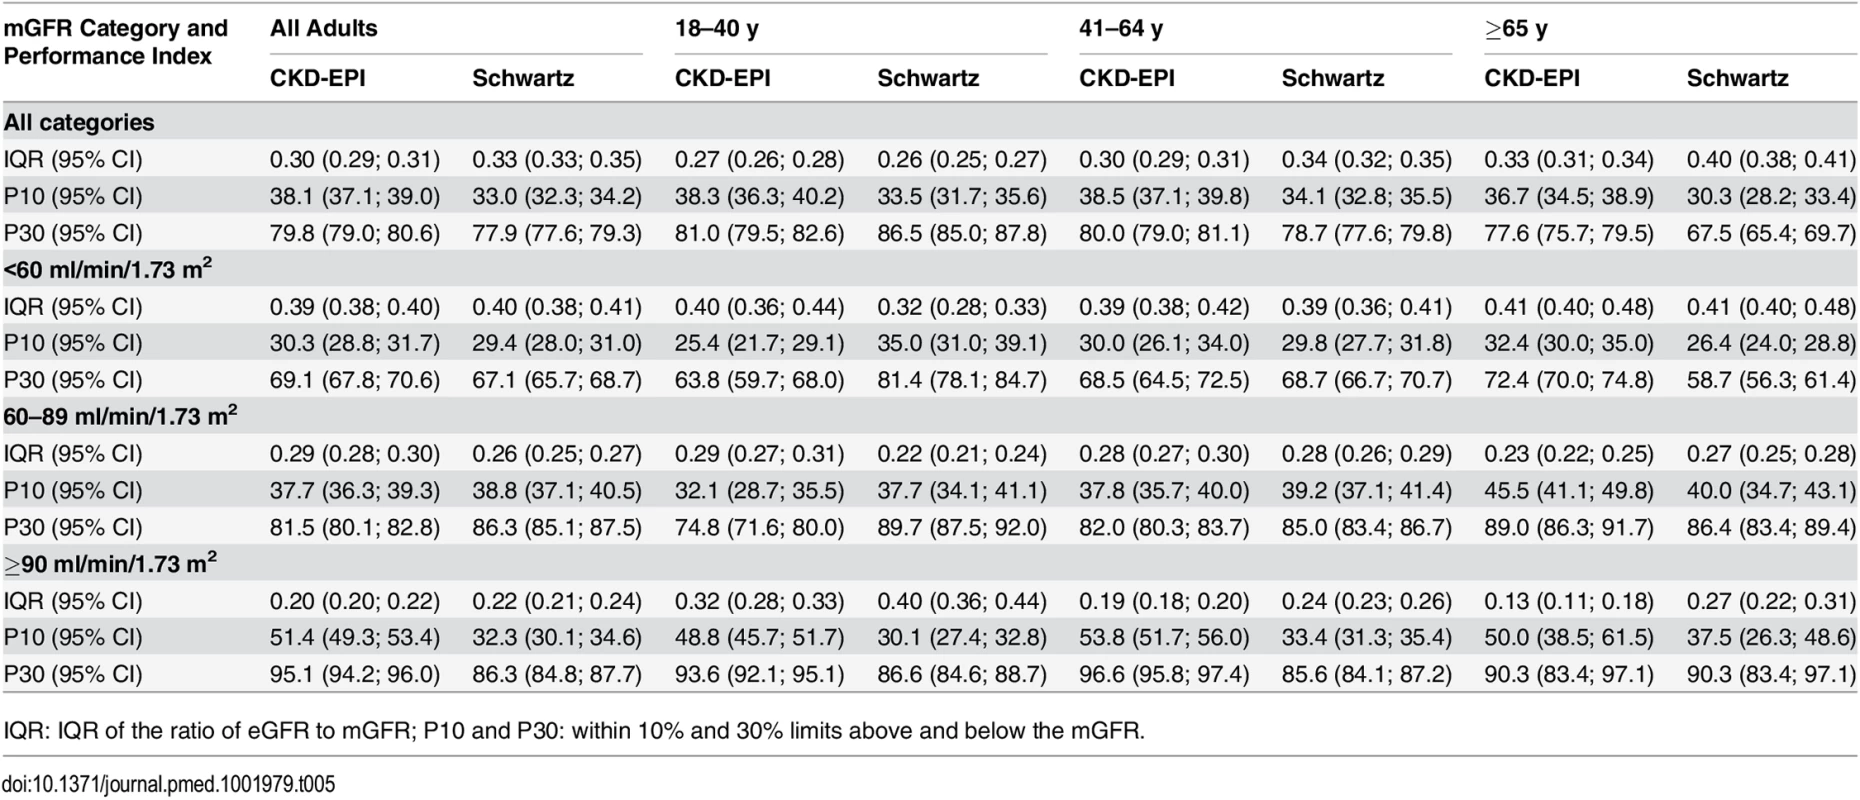
IQR: IQR of the ratio of eGFR to mGFR; P10 and P30: within 10% and 30% limits above and below the mGFR. For individuals aged 41–64 y, the CKD-EPI equation performed better than the Schwartz equation regarding precision and P10 accuracy (IQR: 0.30 [95% CI 0.29; 0.31] versus 0.34 [95% CI 0.32; 0.35]; P10 : 38.5 [95% CI 37.1; 39.8] versus 34.1 [95% CI 32.8; 35.5]; though P30 accuracies were close: 80.0 [95% CI 79.0; 81.1] versus 78.7 [95% CI 77.6; 79.8]). In patients aged 65 y and older, the CKD-EPI equation performed notably better than the Schwartz equation regarding precision and accuracy (IQR: 0.33 [95% CI 0.31; 0.34] versus 0.40 [95% CI 0.38; 0.41]; P10 : 36.7 [95% CI 34.5; 38.9] versus 30.3 [95% CI 28.2; 33.4]; P30 : 77.6 [95% CI 75.7; 79.5] versus 67.5 [95% CI 65.4; 69.7]) (Tables 4 and 5; Figs 2 and 3).
Equation Performance According to mGFR Category
At mGFR < 60 ml/min/1.73 m2, the Schwartz equation performed better than the CKD-EPI equation in the age class 18–40 y (in patients with mGFR < 60 ml/min/1.73 m2, IQR: 0.32 [95% CI 0.28; 0.33] versus 0.40 [95% CI 0.36; 0.44]; P10 : 35.0 [95% CI 31.0; 39.1] versus 25.4 [95% CI 21.7; 29.1]; P30 : 81.4 [95% CI 78.1; 84.7] versus 63.8 [95% CI 59.7; 68.0]). In contrast, in the adult (≥18 y) population with mGFR ≥ 90 ml/min/1.73 m2, the CKD-EPI equation was more accurate than the Schwartz equation (IQR: 0.20 [95% CI 0.20; 0.22] versus 0.22 [95% CI 0.21; 0.24]; P10 : 51.4 [95% CI 49.3; 53.4] versus 32.3 [95% CI 30.1; 34.6]; P30 : 95.1 [95% CI 94.2; 96.0] versus 86.3 [95% CI 84.8; 87.7]). Finally, in adults ≥65 y of age, the CKD-EPI equation performed better than the Schwartz equation whatever the mGFR category.
Discussion
This study compared CKD-EPI and Schwartz equation estimations of the GFR in 10,610 participants referred to a single university hospital. In this cohort, the Schwartz equation was more reliable and accurate in children and adolescents (2–17 y) and in young adults (18–40 y) with mild to moderate kidney impairment. These results may help in determining a cutoff age for switching from a pediatric to an adult equation. Up to now, the CKD-EPI equation, recommended in adults, has assumed that GFR decline starts at the age of 18 y, which may not be accurate.
GFR is currently considered the best indicator of kidney function. Direct GFR measurement being complex, PCr-based estimating equations have been proposed. KDIGO recommends using the Schwartz equation in children and the CKD-EPI equation in adults [2,4]. Developed in children and young to middle-aged adults, respectively, these equations are mathematically different and thus suffer from a lack of continuity over age, especially at the transition from childhood to adulthood. There is therefore confusion over the age at which a physician may or should switch from a pediatric to an adult eGFR equation. The present analysis compared the eGFR values given by the two equations in a large cross-sectional sample of participants who underwent clearance measurements. It investigated measurement bias across a wide range of eGFR values in successive age classes and three categories of mGFR level, which may help resolve the current confusion.
Numerous studies have demonstrated the validity of GFR-predicting equations in middle-aged adults and in children [2,4,7–11,13], but few have specifically searched for the most reliable equation in young adults (18–40 y); there is currently no consensus regarding the use of these equations in this population [11,12,14]. Additionally, a few studies have searched for a specific equation that could replace the pediatric equation in young adults [11–13].
Age-associated changes in renal function have been under study for over half a century [17,19]. GFR increases with age because of proportional kidney and body growth. However, with adjustment for body surface area, children GFR values start to reach adult values by 2 y of age, and the adjusted GFR remains constant until adulthood [17,18]. Thus, the decrease of GFR with age would begin between 30 and 40 y of age and accelerate after age 65–70 y [17–19,23]. The average decline in GFR has been estimated at 0.96 ml/min/y, or about 10 ml/min/decade [23]. Also, it has been shown that height is a good indicator of renal volume, and thus of adjusted GFR, until the sixth decade of life [24,25]. We can therefore assume that a height-dependent GFR estimating equation may be valid in young as in middle-aged adults.
Most GFR estimating equations have been developed using a combination of demographic and clinical variables [2,4]. In fact, in adult equations, such as the Modification of Diet in Renal Disease or CKD-EPI equation, age is used as a central component to integrate muscle mass decrease with age. For a given PCr value, this results in higher eGFR values in young than in old individuals [4]. The opposite is true for children; their muscle mass increases with age and is more closely correlated with height than with age [7]. In young adults, muscle mass does not begin to decrease at 18 y but remains probably constant until middle-age adulthood [2,4]. Therefore, in the CKD-EPI equation, the use of age leads to an overestimation of GFR in children, adolescents, and young adults, whereas, in people ≥65 y old, the CKD-EPI equation performs better than the Schwartz equation whatever the GFR level because of the significant muscle mass decrease.
We hypothesized that the better reliability of the Schwartz compared to the CKD-EPI equation was due to the choice of height as a surrogate for muscle mass and renal volume, and thus for GFR, which would confirm previous studies [24,25]. In these studies, “height/PCr” had a key place in building GFR estimating equations. Schwartz [15] has shown that “height/PCr” could explain more than 70% of the variability of GFR in children and young adults, probably because height is a good surrogate for muscle mass, and thus for creatinine production. In the CKD-EPI equation, age, sex, and ethnicity capture only some of the factors that affect PCr [4,8].
Despite its large scale, the present study has some limitations. First, the study population included few non-white participants and could not assess the effect of ethnicity; however, recent studies have reported that GFR is independent of ethnicity and that the use of population-specific corrections for PCr provide robust adjustments for standard eGFR equations [5,26]. Second, the performance of eGFR equations in participants with mGFR < 30 ml/min/1.73 m2 could not be independently examined because of the small number of participants with severe CKD.
The present analyses show that the Schwartz equation is less biased than the CKD-EPI equation in almost all subgroups. In particular, bias was low in subgroups at mild and high risk of CKD, in which an overestimation of eGFR may have led to an underestimation of CKD prevalence, including people aged less than 65 y. This has important clinical implications for eGFR reporting by laboratories and its interpretation by physicians. The better performance of the Schwartz equation should improve clinical decision-making in people with low mGFR, especially mGFR < 60 ml/min/1.73 m2. These people are exposed to increased risks of all-cause and cardiovascular mortality and to other traditional risk factors. However, the effect of more precise GFR estimates at lower mGFR values on clinical management should be assessed to identify and prevent the risks of CKD [2]. From another perspective, the Schwartz equation requires no additional laboratory costs and is easy to use, especially in developing countries (requires no computerized algorithms).
One interesting extension of the present report would be to conduct the same study in individuals of other ethnicities. Another wider project would be to elicit the collaboration of several centers to develop an equation able to estimate GFR across all ages and all CKD stages.
Conclusion
In this cohort, the Schwartz equation was less biased and showed higher precision and accuracy than the CKD-EPI equation in children and adolescents whatever the level of GFR and in adults aged 18–40 y with a GFR < 90 ml/min/1.73 m2. These results may help determine the cutoff age at which a physician should switch from the Schwartz to the CKD-EPI equation and suggest that the Schwartz equation can be an excellent alternative that does not need a computer.
Supporting Information
Zdroje
1. Eckardt KU, Coresh J, Devuyst O, Johnson RJ, Kottgen A, Levey AS, et al. Evolving importance of kidney disease: from subspecialty to global health burden. Lancet. 2013;382 : 158–169. doi: 10.1016/S0140-6736(13)60439-0 23727165
2. KDIGO 2012 clinical practice guideline for the evaluation and management of chronic kidney disease. Kidney Int Suppl. 2013;3 : 1–150.
3. Jha V, Garcia-Garcia G, Iseki K, Li Z, Naicker S, Plattner B, et al. Chronic kidney disease: global dimension and perspectives. Lancet. 2013;382 : 260–272. doi: 10.1016/S0140-6736(13)60687-X 23727169
4. Levey AS, Inker LA, Coresh J. GFR estimation: from physiology to public health. Am J Kidney Dis. 2014;63 : 820–834. doi: 10.1053/j.ajkd.2013.12.006 24485147
5. Earley A, Miskulin D, Lamb EJ, Levey AS, Uhlig K. Estimating equations for glomerular filtration rate in the era of creatinine standardization: a systematic review. Ann Intern Med. 2012;156 : 785–795. doi: 10.7326/0003-4819-156-6-201203200-00391 22312131
6. Soveri I, Berg UB, Bjork J, Elinder CG, Grubb A, Mejare I, et al. Measuring GFR: a systematic review. Am J Kidney Dis. 2014;64 : 411–424. doi: 10.1053/j.ajkd.2014.04.010 24840668
7. Schwartz GJ, Munoz A, Schneider MF, Mak RH, Kaskel F, Warady BA, et al. New equations to estimate GFR in children with CKD. J Am Soc Nephrol. 2009;20 : 629–637. doi: 10.1681/ASN.2008030287 19158356
8. Levey AS, Stevens LA. Estimating GFR using the CKD Epidemiology Collaboration (CKD-EPI) creatinine equation: more accurate GFR estimates, lower CKD prevalence estimates, and better risk predictions. Am J Kidney Dis. 2010;55 : 622–627. doi: 10.1053/j.ajkd.2010.02.337 20338463
9. Stevens LA, Schmid CH, Greene T, Zhang YL, Beck GJ, Froissart M, et al. Comparative performance of the CKD Epidemiology Collaboration (CKD-EPI) and the Modification of Diet in Renal Disease (MDRD) Study equations for estimating GFR levels above 60 mL/min/1.73 m2. Am J Kidney Dis. 2010;56 : 486–495. doi: 10.1053/j.ajkd.2010.03.026 20557989
10. Murata K, Baumann NA, Saenger AK, Larson TS, Rule AD, Lieske JC. Relative performance of the MDRD and CKD-EPI equations for estimating glomerular filtration rate among patients with varied clinical presentations. Clin J Am Soc Nephrol. 2011;6 : 1963–1972. doi: 10.2215/CJN.02300311 21737852
11. Selistre L, De Souza V, Cochat P, Antonello IC, Hadj-Aissa A, Ranchin B, et al. GFR estimation in adolescents and young adults. J Am Soc Nephrol. 2012;23 : 989–996. doi: 10.1681/ASN.2011070705 22499586
12. Fadrowski JJ, Neu AM, Schwartz GJ, Furth SL. Pediatric GFR estimating equations applied to adolescents in the general population. Clin J Am Soc Nephrol. 2011;6 : 1427–1435. doi: 10.2215/CJN.06460710 21566103
13. Hoste L, Dubourg L, Selistre L, De Souza VC, Ranchin B, Hadj-Aissa A, et al. A new equation to estimate the glomerular filtration rate in children, adolescents and young adults. Nephrol Dial Transplant. 2014;29 : 1082–1091. doi: 10.1093/ndt/gft277 24046193
14. Chehade H, Girardin E, Iglesias K, Ramseyer P, Frey P, Bardy D, et al. Assessment of adult formulas for glomerular filtration rate estimation in children. Pediatr Nephrol. 2013;28 : 105–114. doi: 10.1007/s00467-012-2298-2 22968331
15. Schwartz GJ. Height: the missing link in estimating glomerular filtration rate in children and adolescents. Nephrol Dial Transplant. 2014;29 : 944–947. doi: 10.1093/ndt/gft530 24516232
16. Loi Huriet-Sérusclat no. 88–1138 du 20 décember 1988 relative à la protection des personnes se prêtant à la recherche biomédicale. 1988 Dec 20 [cited 18 Feb 2016]. Available: http://www.chu-toulouse.fr/IMG/pdf/loihuriet.pdf.
17. Glassock RJ, Rule AD. The implications of anatomical and functional changes of the aging kidney: with an emphasis on the glomeruli. Kidney Int. 2012;82 : 270–277. doi: 10.1038/ki.2012.65 22437416
18. Fliser D. Ren sanus in corpore sano: the myth of the inexorable decline of renal function with senescence. Nephrol Dial Transplant. 2005;20 : 482–485. doi: 10.1093/ndt/gfh710 15735239
19. Glassock RJ, Winearls C. Ageing and the glomerular filtration rate: truths and consequences. Trans Am Clin Climatol Assoc. 2009;120 : 419–428. 19768194
20. Cole TJ, Bellizzi MC, Flegal KM, Dietz WH. Establishing a standard definition for child overweight and obesity worldwide: international survey. BMJ. 2000;320 : 1240–1243. 10797032
21. Sempe M, Hansson Bondallaz C, Limoni C. Growth curves in untreated Ullrich-Turner syndrome: French reference standards 1–22 years. Eur J Pediatr. 1996;155 : 862–869. 8891555
22. Chernick MR, LaBudde RA. An introduction to bootstrap methods with applications to R. Hoboken (New Jersey): Wiley; 2011. 216 p.
23. Wang X, Vrtiska TJ, Avula RT, Walters LR, Chakkera HA, Kremers WK, et al. Age, kidney function, and risk factors associate differently with cortical and medullary volumes of the kidney. Kidney Int. 2014;85 : 677–685. doi: 10.1038/ki.2013.359 24067437
24. Emamian SA, Nielsen MB, Pedersen JF, Ytte L. Kidney dimensions at sonography: correlation with age, sex, and habitus in 665 adult volunteers. AJR Am J Roentgenol. 1993;160 : 83–86. doi: 10.2214/ajr.160.1.8416654 8416654
25. Kariyanna SS, Light RP, Agarwal R. A longitudinal study of kidney structure and function in adults. Nephrol Dial Transplant. 2010;25 : 1120–1126. doi: 10.1093/ndt/gfp654 19948878
26. Stevens LA, Claybon MA, Schmid CH, Chen J, Horio M, Imai E, et al. Evaluation of the Chronic Kidney Disease Epidemiology Collaboration equation for estimating the glomerular filtration rate in multiple ethnicities. Kidney Int. 2011;79 : 555–562. doi: 10.1038/ki.2010.462 21107446
Štítky
Interní lékařství
Článek vyšel v časopisePLOS Medicine
Nejčtenější tento týden
2016 Číslo 3- Berberin: přírodní hypolipidemikum se slibnými výsledky
- Léčba bolesti u seniorů
- Příznivý vliv Armolipidu Plus na hladinu cholesterolu a zánětlivé parametry u pacientů s chronickým subklinickým zánětem
- Jak postupovat při výběru betablokátoru − doporučení z kardiologické praxe
- Červená fermentovaná rýže účinně snižuje hladinu LDL cholesterolu jako vhodná alternativa ke statinové terapii
-
Všechny články tohoto čísla
- Trans-Pacific Partnership Provisions in Intellectual Property, Transparency, and Investment Chapters Threaten Access to Medicines in the US and Elsewhere
- An Uninformative Truth: The Logic of Amarin’s Off-Label Promotion
- Performance of the GeneXpert Ebola Assay for Diagnosis of Ebola Virus Disease in Sierra Leone: A Field Evaluation Study
- Pragmatic Trials for Noncommunicable Diseases: Relieving Constraints
- Antibiotic Resistance in India: Drivers and Opportunities for Action
- Global Role and Burden of Influenza in Pediatric Respiratory Hospitalizations, 1982–2012: A Systematic Analysis
- Routine Pediatric Enterovirus 71 Vaccination in China: a Cost-Effectiveness Analysis
- Increased Duration of Paid Maternity Leave Lowers Infant Mortality in Low- and Middle-Income Countries: A Quasi-Experimental Study
- Planned Repeat Cesarean Section at Term and Adverse Childhood Health Outcomes: A Record-Linkage Study
- Experimental Treatment with Favipiravir for Ebola Virus Disease (the JIKI Trial): A Historically Controlled, Single-Arm Proof-of-Concept Trial in Guinea
- A Novel Brief Therapy for Patients Who Attempt Suicide: A 24-months Follow-Up Randomized Controlled Study of the Attempted Suicide Short Intervention Program (ASSIP)
- Comparison of the Schwartz and CKD-EPI Equations for Estimating Glomerular Filtration Rate in Children, Adolescents, and Adults: A Retrospective Cross-Sectional Study
- Cardiovascular and Renal Outcomes of Renin–Angiotensin System Blockade in Adult Patients with Diabetes Mellitus: A Systematic Review with Network Meta-Analyses
- Length of Stay After Childbirth in 92 Countries and Associated Factors in 30 Low- and Middle-Income Countries: Compilation of Reported Data and a Cross-sectional Analysis from Nationally Representative Surveys
- Transformative Innovations in Reproductive, Maternal, Newborn, and Child Health over the Next 20 Years
- Compassionate and Proactive Interventions by Health Workers in the United Kingdom: A Better Approach to Prevent and Respond to Female Genital Mutilation?
- Translational Research for Tuberculosis Elimination: Priorities, Challenges, and Actions
- The Community As the Patient in Malaria-Endemic Areas: Preempting Drug Resistance with Multiple First-Line Therapies
- PLOS Medicine
- Archiv čísel
- Aktuální číslo
- Informace o časopisu
Nejčtenější v tomto čísle- Experimental Treatment with Favipiravir for Ebola Virus Disease (the JIKI Trial): A Historically Controlled, Single-Arm Proof-of-Concept Trial in Guinea
- Comparison of the Schwartz and CKD-EPI Equations for Estimating Glomerular Filtration Rate in Children, Adolescents, and Adults: A Retrospective Cross-Sectional Study
- Performance of the GeneXpert Ebola Assay for Diagnosis of Ebola Virus Disease in Sierra Leone: A Field Evaluation Study
- A Novel Brief Therapy for Patients Who Attempt Suicide: A 24-months Follow-Up Randomized Controlled Study of the Attempted Suicide Short Intervention Program (ASSIP)
Kurzy
Zvyšte si kvalifikaci online z pohodlí domova
Současné možnosti léčby obezity
nový kurzAutoři: MUDr. Martin Hrubý
Všechny kurzyPřihlášení#ADS_BOTTOM_SCRIPTS#Zapomenuté hesloZadejte e-mailovou adresu, se kterou jste vytvářel(a) účet, budou Vám na ni zaslány informace k nastavení nového hesla.
- Vzdělávání


