-
Články
Top novinky
Reklama- Vzdělávání
- Časopisy
Top články
Nové číslo
- Témata
Top novinky
Reklama- Videa
- Podcasty
Nové podcasty
Reklama- Kariéra
Doporučené pozice
Reklama- Praxe
Top novinky
ReklamaGeographical Inequalities and Social and Environmental Risk Factors for Under-Five Mortality in Ghana in 2000 and 2010: Bayesian Spatial Analysis of Census Data
In a census-based study, Majid Ezzati and colleagues use demographic modeling to estimate district-level variation in under-five mortality across Ghana.
Published in the journal: . PLoS Med 13(6): e32767. doi:10.1371/journal.pmed.1002038
Category: Research Article
doi: https://doi.org/10.1371/journal.pmed.1002038Summary
In a census-based study, Majid Ezzati and colleagues use demographic modeling to estimate district-level variation in under-five mortality across Ghana.
Introduction
Mortality in children under 5 y of age has declined in most countries, with the decline accelerating since 2000 [1,2]. The pace of under-five mortality decline has been slower in sub-Saharan Africa (SSA) than in other regions, and SSA accounts for nearly one-half of global under-five deaths [1,3]. Poverty-related risk factors, including unimproved water and sanitation and household air pollution from solid fuels, are estimated to account for a large proportion of worldwide under-five deaths [4]. Parental, and especially maternal, education is also an important predictor of child survival [5]. These factors may also be associated with within-country disparities in under-five mortality [6,7].
Above and beyond global inequalities, there are important subnational inequalities in under-five mortality in relation to socioeconomic status and geography [6,8–14]. Although studies from health and demographic surveillance systems have reported child mortality at specific sites in some countries [15–18], very few studies have examined under-five mortality at fine spatial resolutions for entire countries, which is relevant for assessing community determinants and interventions [9,14,19,20]. Further, little is known about whether and how subnational variations and trends in under-five mortality are associated with social and environmental factors that have been found to be associated with child survival in individual-level studies [6,7].
Ghana has had one of the largest declines in under-five mortality in SSA [1,3]. Under-five mortality in Ghana dropped from 128 deaths per 1,000 live births in 1990 to 62 in 2015, a 52% reduction [1]. Ghana has also had one of SSA’s best economic performances, with its per-capita gross domestic product growing substantially between 2000 and 2013 [21]. Economic inequality, as measured by the Gini coefficient, increased slightly between 1998 and 2006 [21]. It is unclear whether the national improvement in child survival is benefiting all local communities, how it might be affecting within-country inequalities, and whether it is associated with socioeconomic and environmental improvements or whether it is driven by other factors.
In the analyses presented in this paper, we used geocoded data from two national censuses to estimate under-five mortality in Ghana at the district level in 2000 and 2010, and assessed variations and inequalities in under-five mortality in these two years and changes over the decade. We also analyzed the distributions of social and environmental risk factors of under-five mortality, and their associations with under-five mortality and its change. To our knowledge, this report is one of only a few high-resolution “small-area” studies of under-five mortality and its social and environmental risk factors, and the only one to assess change in small-area units over a period of a decade for an entire country. Small-area analysis helps reveal geographical inequalities in mortality and allows the benchmarking of outcomes in each district against the others.
Methods
Data Sources
We used 10% random samples of Ghana’s 2000 and 2010 National Population and Housing Censuses. Using a set of predefined questions, both censuses gathered information on a number of individual - and household-level variables related to socioeconomic factors (e.g., literacy and educational attainment for persons 11 y or older), living environment (e.g., household’s main water supply source, sanitation facility type, and cooking fuel type, as a commonly used metric for household air pollution [4,22]), and children's births and deaths for females 12 y or older. Each record in the census data had information on the census enumeration area (EA), the smallest geographical unit, with an average population of 750. The 2000 and 2010 censuses had nearly 26,000 and 38,000 EAs, respectively. Our analysis was conducted at the district level, the country’s second smallest level of subnational administrative divisions, with EAs mapped to the district of residence. We used districts as units of analysis because they are administrative units for resource allocation and for program implementation. Further, EAs were defined separately in each census and could not be mapped from one census to the other. There were 110 and 170 districts in the 2000 and 2010 censuses, respectively. We merged the 2010 districts, linking them to their original districts that had split since 2000, to create 110 common districts for our analyses. The 110 districts are administratively assembled into ten regions: Ashanti, Brong-Ahafo, Greater Accra, Central, Eastern, Northern, Western, Upper East, Upper West, and Volta.
We used the data to calculate the distribution of households or persons in each district for the following variables that are associated with child survival: household’s main source of cooking fuel (wood, charcoal, other biomass, kerosene, liquefied petroleum gas [LPG], electricity), type of sanitation (toilet) facility usually used by households (improved, unimproved), household’s main source of drinking water (improved, unimproved), maternal education (highest educational grade completed: none, primary, secondary or higher), paternal education (highest educational grade completed: none, primary, secondary or higher), and urban versus rural place of residence. We classified census responses on drinking water source and sanitation facility as improved versus unimproved based on WHO/UNICEF joint monitoring program categories for water supply and sanitation (http://www.wssinfo.org).
Statistical Methods
District-level under-five mortality
Our measure of under-five mortality was the probability of dying by 5 y of age (5q0). The censuses asked all women of childbearing age to report on the total number of children ever born and children surviving. This information was the basis for the application of indirect demographic models to estimate under-five mortality, an approach commonly used by researchers and by national and international statistical and health agencies. The method converts the proportion of deaths among children ever born to women in each 5-y age group of the reproductive period into estimates of the probability of dying by exact ages of childhood, and calculates the number of years before the survey date to which the estimates refer [23,24]. Estimates derived from the two youngest age groups of women (15–19 and 20–24 y) tend to be overestimated compared to the population average because children of women in these age groups tend to have a higher risk of dying than children of older women [23]. Therefore, and following other analyses (including those by the UN Inter-agency Group for Child Mortality Estimation [IGME]) [23], we excluded 5q0 estimates based on reports of women aged 15–24 y. The remaining five estimates (one for each 5-y age group between 25 and 49 y), each with a reference date in years prior to the survey date, were used in our analysis. The reference dates for 5q0 estimates for the 2000 census covered the period 1987–1996; for the 2010 census, the period was 1997–2007.
To obtain a single 5q0 estimate for each district for the index years 2000 and 2010, we fitted a Bayesian space-time model to the five estimates per district from each census. The model included a linear time trend for estimates from each census in each district. The district intercepts and slopes were modeled using the Besag, York, and Mollié (BYM) model [25]. In the BYM model, information is shared both locally (amongst neighboring districts), through spatially structured random effects with a conditional autoregressive (CAR) prior, and globally, through spatially unstructured Gaussian random effects. District-specific intercept and slope values are estimated by the sum of their respective spatially structured and spatially unstructured random effects. The prior distributions in the Bayesian framework allow district-specific parameters to be estimated on the basis of a district’s own data and those of its neighbors. This approach balances between overly unstable within-district estimates and overly simplified aggregate national estimates. Samples from the posterior distributions of the intercepts and slopes were used to estimate 5q0 for the years 2000 and 2010.
Correcting 5q0 estimates from summary birth histories
The national 5q0 estimates based on the Ghana censuses alone were different from the UN IGME estimates, which use a larger number of data sources [1], especially for 2000 (the additional sources used in the UN IGME estimates are not available at the district level). We adjusted our estimates to match the UN IGME estimates in 2000 and 2010, because the additional data sources likely help provide more reliable estimates. As detailed above, the linear trends fitted to the census-based national estimates were used to obtain 5q0 in 2000 and 2010. We then applied a correction factor, calculated as the ratio of the national estimate of 5q0 from the UN IGME to that from the census alone, to the 5q0 estimates for each district. The means of the corrected district 5q0 estimates for the 2000 and 2010 censuses were 104.7 and 77.5, respectively, compared to 102.1 and 75.1 deaths per 1,000 live births as estimated by the UN IGME.
Statistical analysis
We estimated the associations of under-five mortality with its social and environmental determinants at the district level. We analyzed the associations in 2000 and 2010, as well as the associations of the change in under-five mortality between 2000 and 2010 with changes in these factors. The model for associations in each census year was
where 5q0 is the district-level under-five mortality (per 1,000 live births); X is a vector of district-level risk factors (each as percent of households or persons), including cooking fuel type (wood, charcoal, other biomass, kerosene, LPG, electricity), sanitation facility (improved, unimproved), drinking water source (improved, unimproved), maternal education (none, primary, secondary or higher), paternal education (none, primary, secondary or higher), and place of residence (urban, rural); U is a district-specific spatially structured random effect; V is a district-specific unstructured random effect; and α and β are regression coefficients. When analyzing change in under-five mortality, Ln(5q0) and X were replaced with their 2000–2010 differences.Noninformative normal priors with mean 0 and variance 10,000 were placed on all fixed effects parameters; gamma priors, Gamma(0.5,0.0005), were specified for the precision parameters of all random effects. For each analysis, two chains were run, and convergence was monitored using Brooks-Gelman-Rubin diagnostics [26] and visual inspection of the chains. Following convergence, which was before 10,000 iterations in all analyses, a further 200,000 iterations were run, with thinning to every tenth iteration, yielding final samples of 20,000 iterations for inference.
All analyses were implemented using R2WinBUGS and sqldf libraries in the open-source statistical package R version 3.1.0 (R Project for Statistical Computing) and WinBUGS version 1.4 [27].
Results
District under-five mortality estimates and social and environmental factors that may be associated with child survival for the index years 2000 and 2010 are summarized in Table 1. Median district under-five mortality declined from 99 deaths per 1,000 live births in 2000 to about 70 in 2010. In 2000, under-five mortality varied substantially among districts, ranging from about 75 to nearly 150 deaths per 1,000 live births (Fig 1). Under-five mortality was above 100 per 1,000 live births in over half of the districts in 2000. The majority of these districts were in the three northernmost regions of the country (Upper West, Upper East, and Northern). There was also high under-five mortality in areas along the coastline of the Western and Central regions. Under-five mortality declined in all districts between 2000 and 2010 (Fig 2), and was above 100 per 1,000 live births in only 13% of districts in 2010 (Fig 2A). In 2010, under-five mortality was below 70 deaths per 1,000 live births for nearly half of the districts, whereas no district had had under-five mortality this low in 2000 (Fig 1).
Fig. 1. Under-five mortality (deaths per 1,000 live births) by district in 2000 and 2010. 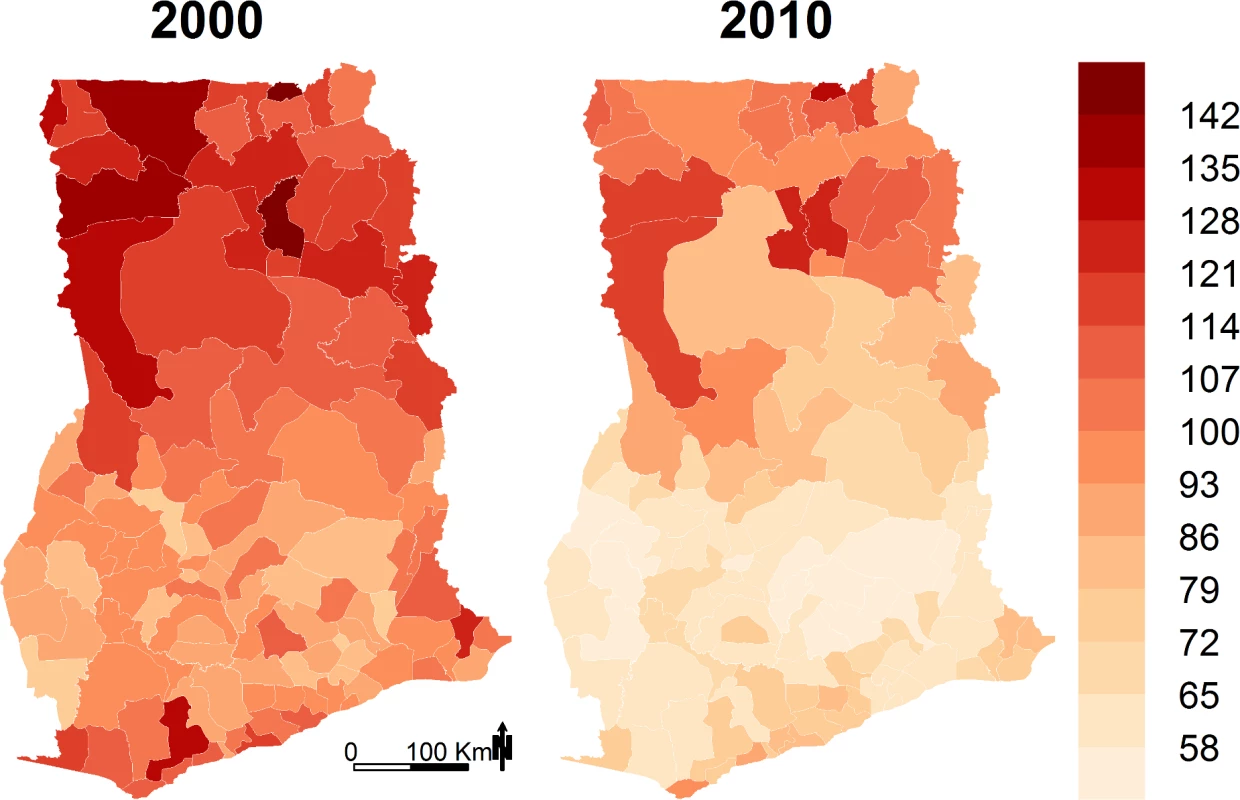
Fig. 2. Change in under-five mortality (deaths per 1,000 live births) by district from 2000 to 2010. 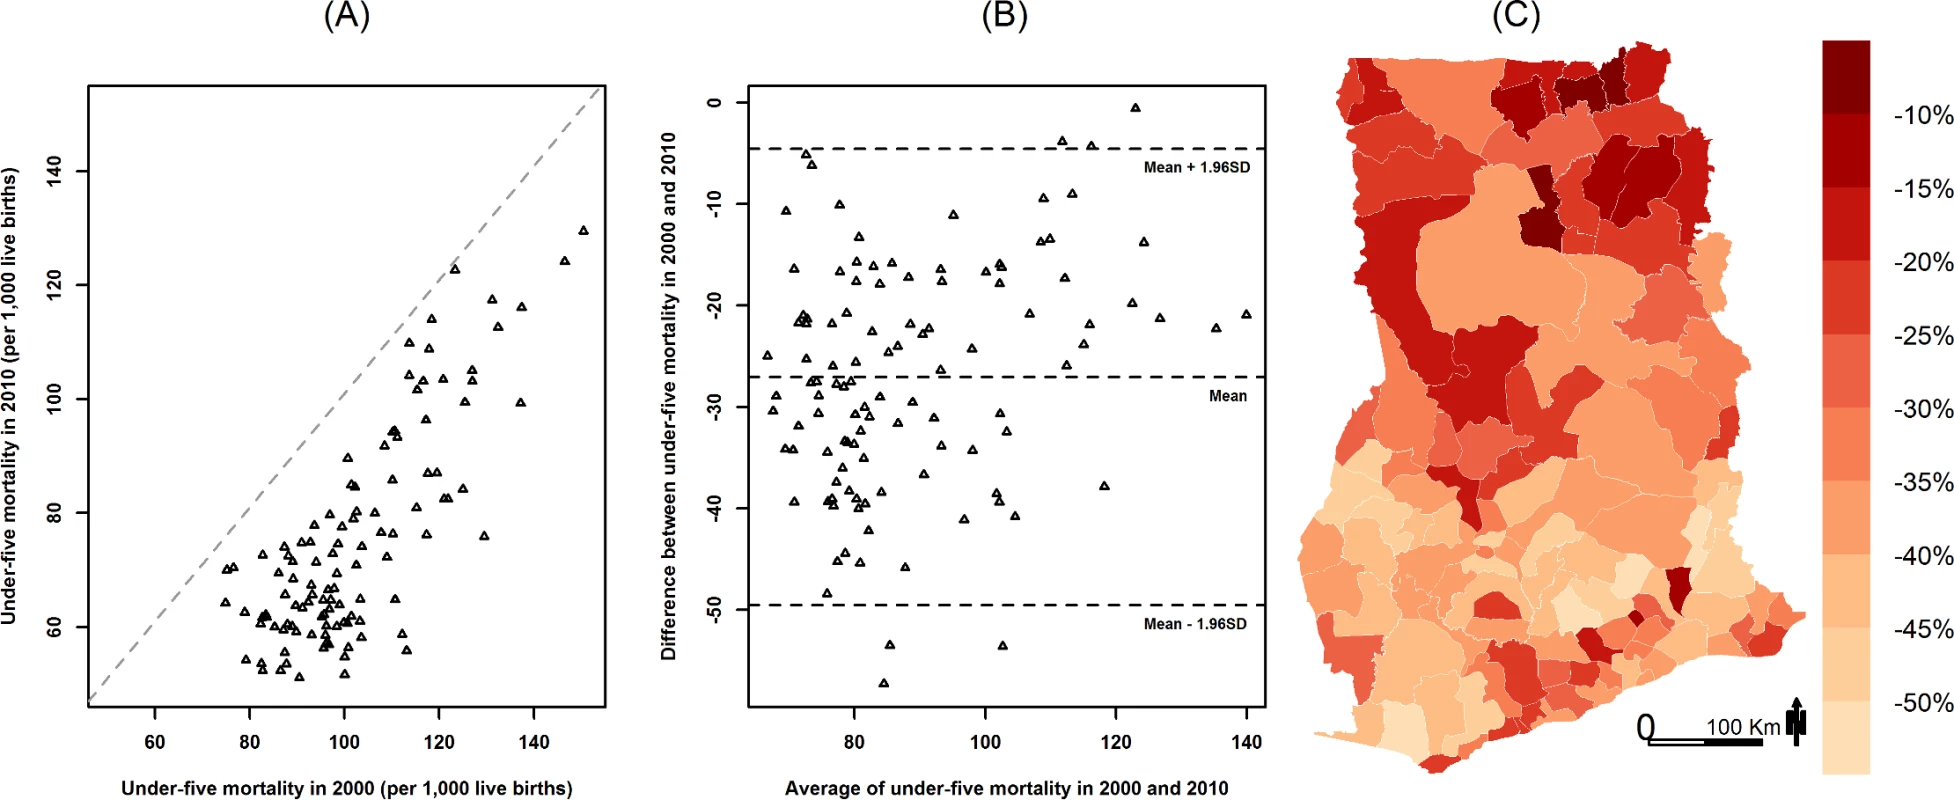
(A) Under-five mortality (deaths per 1,000 live births) in 2000 versus 2010. (B) Tukey mean-difference plot of under-five mortality (deaths per 1,000 live births) in 2000 and 2010. (C) Percent change in under-five mortality by district from 2000 to 2010. Tab. 1. Summary statistics of district population and under-five mortality and its social and environmental risk factors. 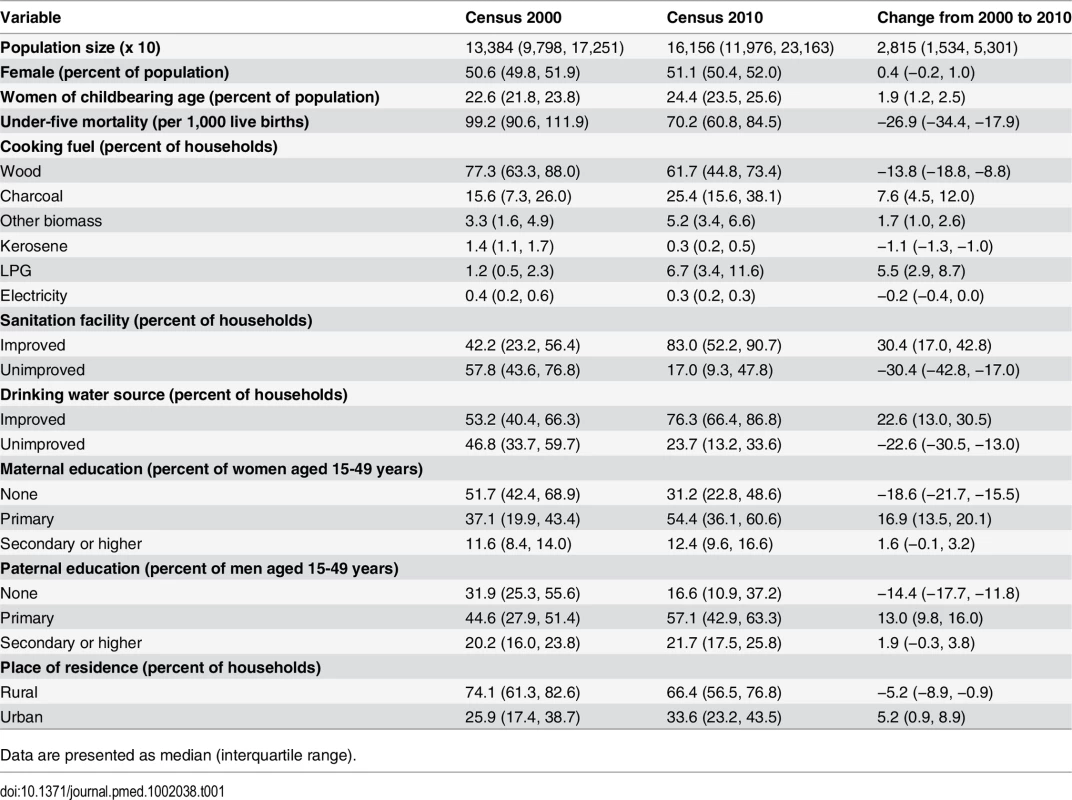
Data are presented as median (interquartile range). From 2000 to 2010, under-five mortality declined by over 40% in some southern districts, but the decline was less in the north, with nearly a third of districts having less than 20% reduction (Fig 2). Districts with the highest mortality in 2000 generally had a smaller decline, exacerbating existing cross-district inequalities, especially for relative inequalities. For example, the difference and the ratio of the highest and lowest percentile of district under-five mortality increased from 76 and 2.0 in 2000 to 78 and 2.5 in 2010, respectively.
From 2000 to 2010, the proportion of households without improved sanitation and drinking water decreased in all districts (Table 1). The share of households with improved drinking water was over 80% in 47 districts, and the share of households with improved sanitation was over 80% in 64 districts, in 2010; virtually no district had had this level of improved drinking water and improved sanitation in 2000 (Fig 3). Despite the improvements, the share of households with improved sanitation was less than 80% in all districts in the Northern, Upper East, and Upper West regions in 2010. There was also some reduction in the use of wood for cooking, largely replaced by charcoal, which emits less health-damaging particulate matter [22,28,29]. The proportion of households using LPG also increased from 6% in 2000 to 18% in 2010. In some districts in the Greater Accra region, over a quarter of households used LPG as the primary cooking fuel in 2010.
Fig. 3. Distributions of household cooking fuel, sanitation facility, drinking water source, and maternal education by district in 2000 and 2010 (percent of households or persons). 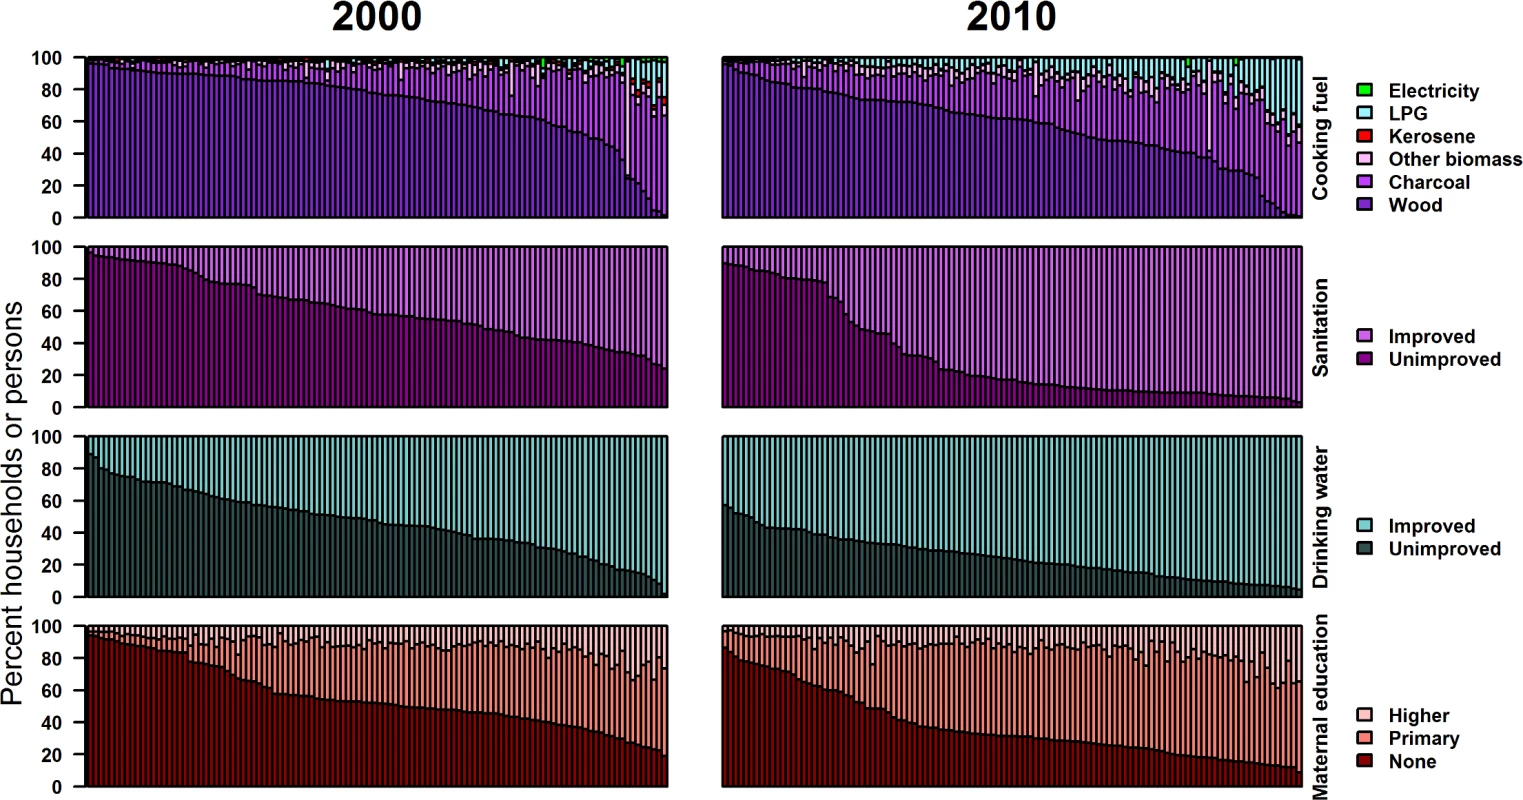
Each bar represents one district, with districts ordered by decreasing prevalence of the worst category for each census. More women completed primary education and fewer were illiterate in every district in 2010 compared to 2000 (Fig 3). In over one-half of districts, including in all 24 districts in the northernmost regions, at least one-half of women had not attended school or had not completed primary education in 2000; by 2010, this was the case in 25% of districts. Despite improvements in basic literacy and primary education, the proportion of women who attained secondary or higher education did not change noticeably.
In multivariate analysis, higher use of LPG for household cooking was associated with lower under-five mortality after adjusting for other factors, with each 10% increase in households using LPG associated with a 11.1% (95% CI 3.0%–18.8%) decline in 5q0 (Fig 4). Associations for the other social and environmental variables were not consistent or were weak in the different analyses, although there were indications of beneficial effects from replacing wood with charcoal or kerosene, from improved sanitation and drinking water, and from having a higher share of mothers who had completed primary education.
Fig. 4. Risk ratios and 95% credible intervals (2.5th and 97.5th percentiles of the posterior distributions of effect size parameters from the Bayesian model) from multivariate analysis of the association of under-five mortality with its social and environmental risk factors for 2000, 2010, and the change between 2000 and 2010. 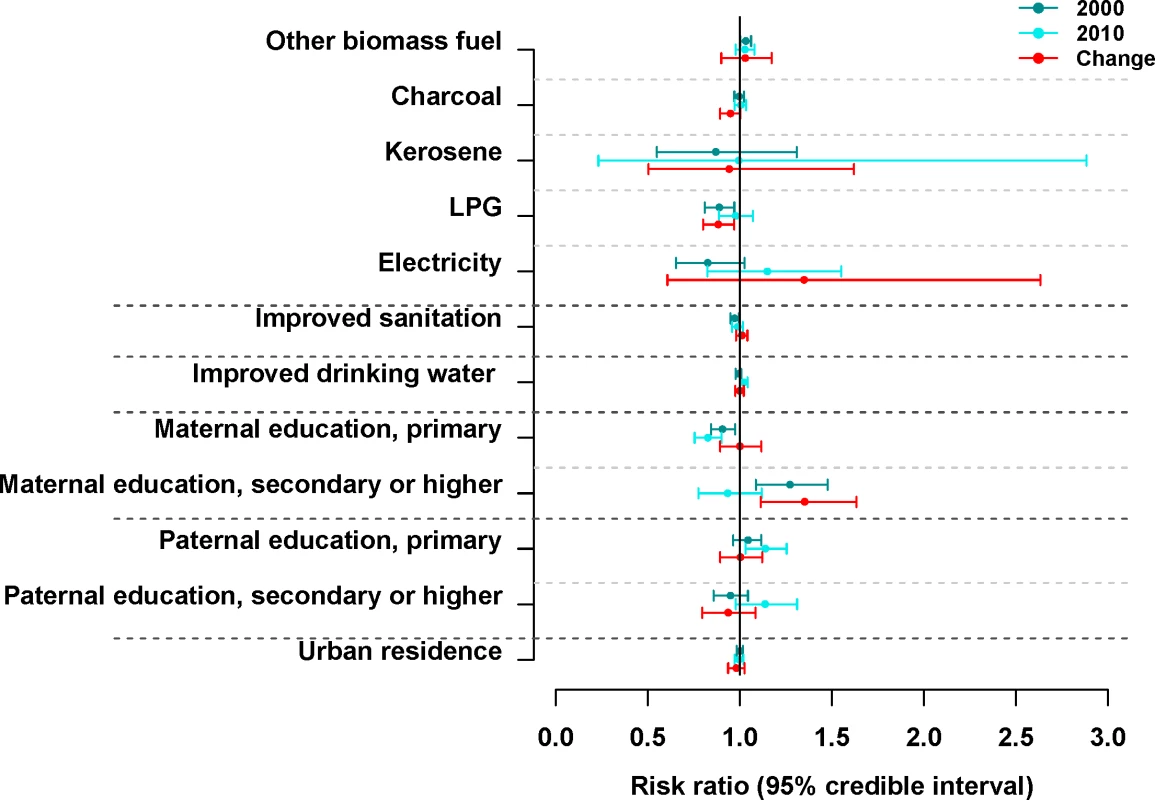
The magnitude of the effect size for each variable represents the proportional change (decrease or increase) in 5q0 for a 10% higher prevalence of that variable (over space in a single census year or change over time between censuses), with the 10% shift coming from the reference variable. The reference variables were wood (for cooking fuel), unimproved sanitation, unimproved drinking water, no education (for maternal and paternal education), and living in rural areas. After adjustment for socioeconomic and environmental factors, some unexplained spatial variation in under-five mortality remains (Fig 5), which represents unmeasured and/or unknown risk factors not already included in the model. Specifically, in 2010 the spatially structured part (Fig 5A) of the unexplained component of under-five mortality was higher in the northernmost and Greater Accra regions, and lower in the Western, Brong-Ahafo, Ashanti, and Eastern regions and parts of the Volta region (Fig 5A).
Fig. 5. Unexplained district variability in under-five mortality. 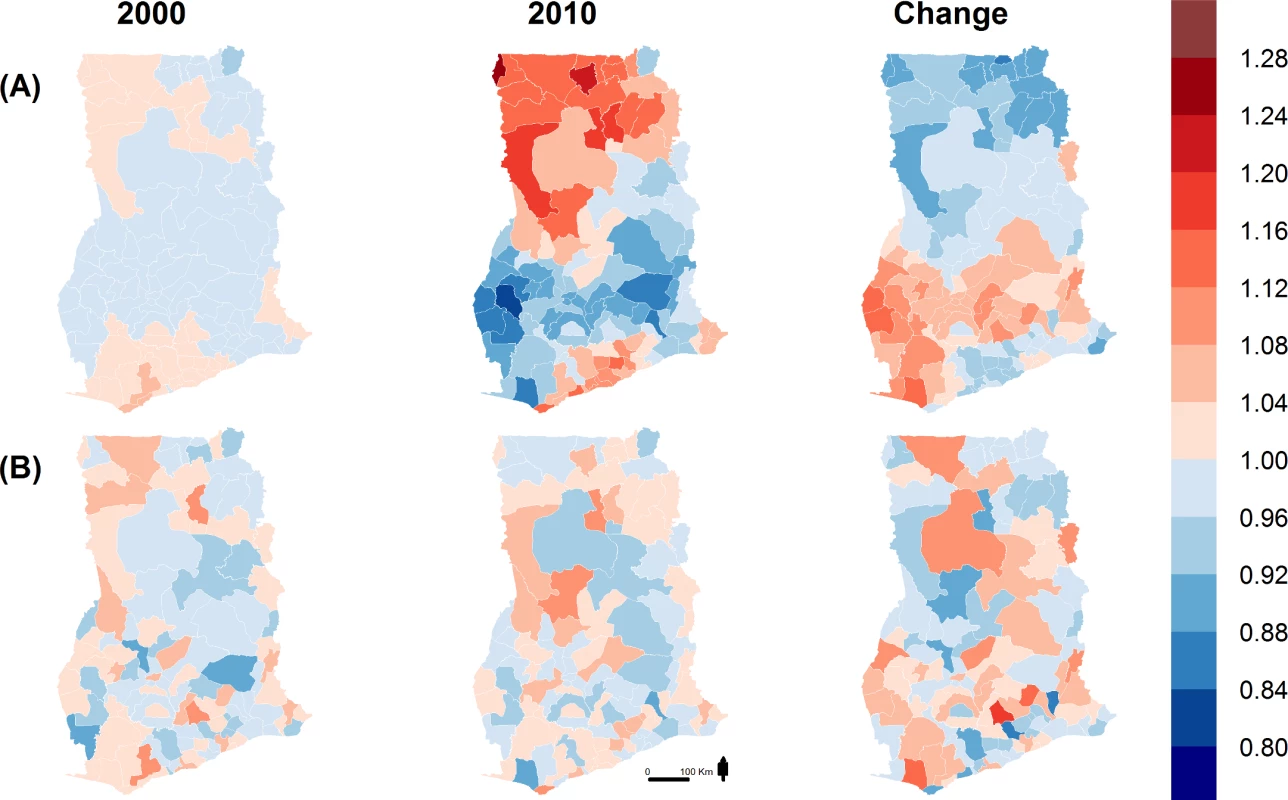
(A) Spatially structured random effects [exp(U)] and (B) unstructured random effects [exp(V)] of unexplained district variability in under-five mortality. Random effects < 1 for a district represents a reduction in under-five mortality, and random effects > 1 represents an increase. Discussion
Our small-area analysis found that under-five mortality declined in all of Ghana’s districts between 2000 and 2010, but the size of this decline varied considerably across districts. The pace of decline was steeper in southern districts, where under-five mortality was lower in 2000, than in the north, exacerbating existing cross-district inequalities, especially for relative inequality. The decline in under-five mortality in Ghana appears to continue beyond 2010, as indicated by the latest national estimate by the UN IGME [2]. We also found improvements in education and household environment, including access to improved water and sanitation and cleaner cooking fuels, from 2000 to 2010. Higher use of LPG for cooking was associated with lower under-five mortality, but the associations of either the level or change in under-five mortality with other social and environmental variables were weak. We observed high unexplained variability in under-five mortality in parts of the country, especially in 2010. This unexplained variability does not readily point to any single factor that we are aware of. It is possible that a combination of unmeasured variables, including healthcare, socioeconomic status, natural resource availability, and local governance, played a role in this (unexplained) variability.
Like in our study, studies in Zambia, Papua New Guinea, and India found that under-five mortality declined in all or some districts over a similar time period, with large subnational variation in the magnitude of decline [9,14,19]. Unlike in our study, cross-district inequality decreased in Zambia over time, but the Indian study found a rise in cross-district inequality, as we did in Ghana. The association between parental, especially maternal, education and child survival was weaker in our data than in some other population-based studies [5,12,30–32].
The main strength of our study is its novel scope in analyzing under-five mortality, and its socioeconomic and environmental risk factors, at the small-area level. Small-area information allows benchmarking of subnational administrative units, both in terms of mortality levels and trends and in terms of the environmental and socioeconomic risk factors for mortality. This information can in turn identify districts that are performing well and those that are most in need of additional interventions related to the environmental and socioeconomic factors analyzed or to other determinants of child survival, as discussed below. We used geocoded data from two national censuses, which included every household in the country. We also used Bayesian spatial analysis, which balanced between unstable district-level estimates and simplified aggregate national estimates to obtain consistent and comparable under-five mortality estimates for all districts.
Our study also has a number of limitations. Due to the limited coverage of the vital registration system in Ghana, we relied on demographic models to estimate under-five mortality at the district level. While this approach is well tested and used by national and international agencies, it introduces uncertainty into our estimates. In particular, the estimates using the 2000 census were substantially different from the national estimates using other sources. We dealt with this issue by adjusting our estimates to be consistent with pooled estimates from all sources. This adjustment could introduce additional uncertainty into the district-level estimates. We could not separate child deaths into those during the neonatal versus subsequent periods. The social and environmental risk factors in our data were each measured using one or two questions in the census. This simplification of measurement may have affected the associations of these factors with under-five mortality. We had no information on healthcare access and interventions such as immunization, insecticide-treated nets, and nutritional supplementation, which are important factors for child survival [33–35]. Similarly, we had no information on within-country migration, which might be partially responsible for changes in specific districts over time.
Conclusions
The Millennium Development Goals, and the policy emphases and resources that followed them, have led to acceleration of under-five mortality decline in Ghana and other countries in SSA. These efforts seem to be benefiting all of Ghana’s districts, but the rate of progress has been slow and unequal across districts. There is therefore a need both to accelerate the decline and to put special emphasis on districts that have progressed more slowly. Experiences of more equitable decline in countries such as Niger, Brazil, and Bangladesh show that achieving this requires multisectoral approaches while maintaining a major role for the health system [33–35]. In particular, although we found weak associations between under-five mortality and some of the social and environmental factors we investigated, the role of these factors may have been partially masked by others, including changes in health services and health systems interventions, and hence there should be investments in education and household environments as a way to continue and accelerate improvements in child survival. At the same time, the weak association of child mortality with social and environmental factors, and the large body of evidence on the efficacy of healthcare and health systems interventions for child health, should motivate increasing the coverage of healthcare interventions such as antenatal care, immunization, insecticide-treated nets, and treatment of acute conditions such as pneumonia, malaria, and diarrhea throughout Ghana, with an emphasis on equity in access and utilization [33,36]. Finally, improving measurement and monitoring of under-five mortality and its risk factors and interventions at the subnational level are particularly important for all SSA countries, to better inform policies and programs that facilitate equitable progress.
Supporting Information
Zdroje
1. United Nations Inter-agency Group for Child Mortality Estimation. Levels & trends in child mortality: report 2013. New York: UNICEF; 2013.
2. United Nations Inter-agency Group for Child Mortality Estimation. Levels & trends in child mortality: report 2015. New York: UNICEF; 2015.
3. Requejo J, Bryce J, Victora C, Deixel A, Barros A, Bhutta Z, et al. Fulfilling the health agenda for women and children: the 2014 report. New York: UNICEF; 2014.
4. Lim SS, Vos T, Flaxman AD, Danaei G, Shibuya K, Adair-Rohani H, et al. A comparative risk assessment of burden of disease and injury attributable to 67 risk factors and risk factor clusters in 21 regions, 1990–2010: a systematic analysis for the Global Burden of Disease Study 2010. Lancet. 2012;380 : 2224–2260. doi: 10.1016/S0140-6736(12)61766-8 23245609
5. Gakidou E, Cowling K, Lozano R, Murray CJ. Increased educational attainment and its effect on child mortality in 175 countries between 1970 and 2009: a systematic analysis. Lancet. 2010;376 : 959–974. doi: 10.1016/S0140-6736(10)61257-3 20851260
6. Gakidou E, Oza S, Vidal Fuertes C, Li AY, Lee DK, Sousa A, et al. Improving child survival through environmental and nutritional interventions: the importance of targeting interventions toward the poor. JAMA. 2007;298 : 1876–1887. 17954539
7. Stevens GA, Dias RH, Ezzati M. The effects of 3 environmental risks on mortality disparities across Mexican communities. Proc Natl Acad Sci U S A. 2008;105 : 16860–16865. doi: 10.1073/pnas.0808927105 18974224
8. Amouzou A, Kozuki N, Gwatkin DR. Where is the gap?: the contribution of disparities within developing countries to global inequalities in under-five mortality. BMC Public Health. 2014;14 : 216. doi: 10.1186/1471-2458-14-216 24581032
9. Dwyer-Lindgren L, Kakungu F, Hangoma P, Ng M, Wang H, Flaxman AD, et al. Estimation of district-level under-5 mortality in Zambia using birth history data, 1980–2010. Spat Spatiotemporal Epidemiol. 2014;11 : 89–107. doi: 10.1016/j.sste.2014.09.002 25457599
10. Hosseinpoor AR, Mohammad K, Majdzadeh R, Naghavi M, Abolhassani F, Sousa A, et al. Socioeconomic inequality in infant mortality in Iran and across its provinces. Bull World Health Organ. 2005;83 : 837–844. 16302040
11. Houweling TA, Kunst AE. Socio-economic inequalities in childhood mortality in low - and middle-income countries: a review of the international evidence. Br Med Bull. 2010;93 : 7–26. doi: 10.1093/bmb/ldp048 20007188
12. Kraft AD, Nguyen KH, Jimenez-Soto E, Hodge A. Stagnant neonatal mortality and persistent health inequality in middle-income countries: a case study of the Philippines. PLoS ONE. 2013;8:e53696. doi: 10.1371/journal.pone.0053696 23308278
13. Vapattanawong P, Hogan MC, Hanvoravongchai P, Gakidou E, Vos T, Lopez AD, et al. Reductions in child mortality levels and inequalities in Thailand: analysis of two censuses. Lancet. 2007;369 : 850–855. 17350454
14. Ram U, Jha P, Ram F, Kumar K, Awasthi S, Shet A, et al. Neonatal, 1–59 month, and under-5 mortality in 597 Indian districts, 2001 to 2012: estimates from national demographic and mortality surveys. Lancet Glob Health. 2013:e219–e226.
15. Adjuik M, Kanyomse E, Kondayire F, Wak G, Hodgson A. Clustering of under-five mortality in the Navrongo HDSS in the Kassena-Nankana District of northern Ghana. Glob Health Action. 2010;3. doi: 10.3402/gha.v3i0.5233
16. Nettey OEA, Zandoh C, Sulemana A, Adda R, Owusu-Agyei S. Clustering of childhood mortality in the Kintampo Health and Demographic Surveillance System in Ghana. Glob Health Action. 2010;3. doi: 10.3402/gha.v3i0.5258
17. Awini E, Mattah P, Sankoh O, Gyapong M. Spatial variations in childhood mortalities at the Dodowa Health and Demographic Surveillance System site of the INDEPTH Network in Ghana. Trop Med Int Health. 2010;15 : 520–528. doi: 10.1111/j.1365-3156.2010.02492.x 20345554
18. Sankoh OA, Yé Y, Sauerborn R, Müller O, Becher H. Clustering of childhood mortality in rural Burkina Faso. Int J Epidemiol. 2001;30 : 485–492. 11416070
19. Bauze AE, Tran LN, Nguyen KH, Firth S, Jimenez-Soto E, Dwyer-Lindgren L, et al. Equity and geography: the case of child mortality in Papua New Guinea. PLoS ONE. 2012;7:e37861. doi: 10.1371/journal.pone.0037861 22662238
20. Sousa A, Hill K, Dal Poz MR. Sub-national assessment of inequality trends in neonatal and child mortality in Brazil. Int J Equity Health. 2010;9 : 21. doi: 10.1186/1475-9276-9-21 20815875
21. World Bank. World development indicators. Washington (District of Columbia): World Bank; 2013.
22. Bailis R, Ezzati M, Kammen DM. Mortality and greenhouse gas impacts of biomass and petroleum energy futures in Africa. Science. 2005;308 : 98–103. 15802601
23. Hill K, You D, Inoue M, Oestergaard MZ, Technical Advisory Group of United Nations Inter-agency Group for Child Mortality Estimation. Child mortality estimation: accelerated progress in reducing global child mortality, 1990–2010. PLoS Med. 2012;9:e1001303. doi: 10.1371/journal.pmed.1001303 22952441
24. United Nations Department of International Economic and Social Affairs. Manual X: indirect techniques for demographic estimation. New York: United Nations; 1983.
25. Besag J, York J, Mollié A. Bayesian image restoration, with two applications in spatial statistics. Ann Inst Stat Math. 1991;1 : 1–20.
26. Brooks SP, Gelman A. General methods for monitoring convergence of iterative simulations. J Comput Graph Stat. 1998;7 : 434–455.
27. Spiegelhalter D, Thomas A, Best N, Lunn D. WinBUGS user manual, version 1.4. Cambridge: MRC Biostatistics Unit; 2003.
28. Dionisio KL, Howie SR, Dominici F, Fornace KM, Spengler JD, Adegbola RA, et al. Household concentrations and exposure of children to particulate matter from biomass fuels in The Gambia. Environ Sci Technol. 2012;46 : 3519–3527. doi: 10.1021/es203047e 22304223
29. Ezzati M, Mbinda BM, Kammen DM. Comparison of emissions and residential exposure from traditional and improved cookstoves in Kenya. Environ Sci Technol. 2000;34 : 578–583.
30. Pradhan J, Arokiasamy P. Socio-economic inequalities in child survival in India: a decomposition analysis. Health Policy. 2010;98 : 114–120. doi: 10.1016/j.healthpol.2010.05.010 20576309
31. Fink G, Gunther I, Hill K. Slum residence and child health in developing countries. Demography. 2014;51 : 1175–1197. doi: 10.1007/s13524-014-0302-0 24895049
32. Wang H, Liddell CA, Coates MM, Mooney MD, Levitz CE, Schumacher AE, et al. Global, regional, and national levels of neonatal, infant, and under-5 mortality during 1990–2013: a systematic analysis for the Global Burden of Disease Study 2013. Lancet. 2014;384 : 957–979. doi: 10.1016/S0140-6736(14)60497-9 24797572
33. Amouzou A, Habi O, Bensaid K, Niger Countdown Case Study Working Group. Reduction in child mortality in Niger: a Countdown to 2015 country case study. Lancet. 2012;380 : 1169–1178. doi: 10.1016/S0140-6736(12)61376-2 22999428
34. Adams AM, Rabbani A, Ahmed S, Mahmood SS, Al-Sabir A, Rashid SF, et al. Explaining equity gains in child survival in Bangladesh: scale, speed, and selectivity in health and development. Lancet. 2013;382 : 2027–2037. doi: 10.1016/S0140-6736(13)62060-7 24268604
35. Monteiro CA, Benicio MH, Conde WL, Konno S, Lovadino AL, Barros AJ, et al. Narrowing socioeconomic inequality in child stunting: the Brazilian experience, 1974–2007. Bull World Health Organ. 2010;88 : 305–311. doi: 10.2471/BLT.09.069195 20431795
36. Victora CG, Barros AJ, Axelson H, Bhutta ZA, Chopra M, Franca GV, et al. How changes in coverage affect equity in maternal and child health interventions in 35 Countdown to 2015 countries: an analysis of national surveys. Lancet. 2012;380 : 1149–1156. doi: 10.1016/S0140-6736(12)61427-5 22999433
Štítky
Interní lékařství
Článek vyšel v časopisePLOS Medicine
Nejčtenější tento týden
2016 Číslo 6- Berberin: přírodní hypolipidemikum se slibnými výsledky
- Léčba bolesti u seniorů
- Příznivý vliv Armolipidu Plus na hladinu cholesterolu a zánětlivé parametry u pacientů s chronickým subklinickým zánětem
- Jak postupovat při výběru betablokátoru − doporučení z kardiologické praxe
- Červená fermentovaná rýže účinně snižuje hladinu LDL cholesterolu jako vhodná alternativa ke statinové terapii
-
Všechny články tohoto čísla
- Direct-to-consumer Marketing to People with Hemophilia
- Geographical Inequalities and Social and Environmental Risk Factors for Under-Five Mortality in Ghana in 2000 and 2010: Bayesian Spatial Analysis of Census Data
- Phosphodiesterase Type 5 Inhibitors and Risk of Malignant Melanoma: Matched Cohort Study Using Primary Care Data from the UK Clinical Practice Research Datalink
- Age, Spatial, and Temporal Variations in Hospital Admissions with Malaria in Kilifi County, Kenya: A 25-Year Longitudinal Observational Study
- Obesity and Multiple Sclerosis: A Mendelian Randomization Study
- Inter-pregnancy Weight Change and Risks of Severe Birth-Asphyxia-Related Outcomes in Singleton Infants Born at Term: A Nationwide Swedish Cohort Study
- Impact Evaluation of a System-Wide Chronic Disease Management Program on Health Service Utilisation: A Propensity-Matched Cohort Study
- Early Childhood Developmental Status in Low- and Middle-Income Countries: National, Regional, and Global Prevalence Estimates Using Predictive Modeling
- Plant-Based Dietary Patterns and Incidence of Type 2 Diabetes in US Men and Women: Results from Three Prospective Cohort Studies
- Exclusive Breastfeeding and Cognition, Executive Function, and Behavioural Disorders in Primary School-Aged Children in Rural South Africa: A Cohort Analysis
- Investigating the Causal Relationship of C-Reactive Protein with 32 Complex Somatic and Psychiatric Outcomes: A Large-Scale Cross-Consortium Mendelian Randomization Study
- Agreements between Industry and Academia on Publication Rights: A Retrospective Study of Protocols and Publications of Randomized Clinical Trials
- Weighing Evidence from Mendelian Randomization—Early-Life Obesity as a Causal Factor in Multiple Sclerosis?
- A Global Champion for Health—WHO’s Next?
- Malaria Epidemiology in Kilifi, Kenya during the 21st Century: What Next?
- Guidelines for Accurate and Transparent Health Estimates Reporting: the GATHER statement
- Strengthening the Reporting of Observational Studies in Epidemiology—Nutritional Epidemiology (STROBE-nut): An Extension of the STROBE Statement
- Why Most Clinical Research Is Not Useful
- Delinking Investment in Antibiotic Research and Development from Sales Revenues: The Challenges of Transforming a Promising Idea into Reality
- Novel Three-Day, Community-Based, Nonpharmacological Group Intervention for Chronic Musculoskeletal Pain (COPERS): A Randomised Clinical Trial
- Prediction of Bladder Outcomes after Traumatic Spinal Cord Injury: A Longitudinal Cohort Study
- The Effect of Sitagliptin on Carotid Artery Atherosclerosis in Type 2 Diabetes: The PROLOGUE Randomized Controlled Trial
- PLOS Medicine
- Archiv čísel
- Aktuální číslo
- Informace o časopisu
Nejčtenější v tomto čísle- Why Most Clinical Research Is Not Useful
- Agreements between Industry and Academia on Publication Rights: A Retrospective Study of Protocols and Publications of Randomized Clinical Trials
- Inter-pregnancy Weight Change and Risks of Severe Birth-Asphyxia-Related Outcomes in Singleton Infants Born at Term: A Nationwide Swedish Cohort Study
- Strengthening the Reporting of Observational Studies in Epidemiology—Nutritional Epidemiology (STROBE-nut): An Extension of the STROBE Statement
Kurzy
Zvyšte si kvalifikaci online z pohodlí domova
Současné možnosti léčby obezity
nový kurzAutoři: MUDr. Martin Hrubý
Všechny kurzyPřihlášení#ADS_BOTTOM_SCRIPTS#Zapomenuté hesloZadejte e-mailovou adresu, se kterou jste vytvářel(a) účet, budou Vám na ni zaslány informace k nastavení nového hesla.
- Vzdělávání


