-
Články
Top novinky
Reklama- Vzdělávání
- Časopisy
Top články
Nové číslo
- Témata
Top novinky
Reklama- Videa
- Podcasty
Nové podcasty
Reklama- Kariéra
Doporučené pozice
Reklama- Praxe
Top novinky
ReklamaThe 2014–2015 Ebola virus disease outbreak and primary healthcare delivery in Liberia: Time-series analyses for 2010–2016
Bradley Wagenaar and colleagues use health facility data to analyze losses to essential primary healthcare service outputs during and immediately after the EVD outbreak, and their recovery in the years after.
Published in the journal: . PLoS Med 15(2): e32767. doi:10.1371/journal.pmed.1002508
Category: Research Article
doi: https://doi.org/10.1371/journal.pmed.1002508Summary
Bradley Wagenaar and colleagues use health facility data to analyze losses to essential primary healthcare service outputs during and immediately after the EVD outbreak, and their recovery in the years after.
Introduction
The 2014–2015 Ebola virus disease (EVD) outbreak across West Africa represented an international tragedy, directly leading to 28,616 cases of EVD and 11,310 deaths in total, and 10,675 confirmed, probable, and suspected cases in Liberia, resulting in 4,809 deaths [1]. Due to already weakened health systems, the EVD outbreak led to incredible disruption in the continued provision of life-saving public-sector primary healthcare across Sierra Leone, Guinea, and Liberia—the 3 countries most severely impacted by the epidemic [2]. Analyses using routine health information system (RHIS) data originating from Guinea and Sierra Leone have recently chronicled the effect of the EVD epidemic on the delivery of public-sector care for maternal, child, and reproductive health services, showing dramatic decreases during the Ebola outbreak (on the order of 50% declines) and sustained low levels not suggesting recovery [3–5]. Previous descriptive studies using RHIS data from Liberia have shown decreases in maternal and child health (MCH) indicators [6,7], malaria treatment [8], HIV testing [9], and tuberculosis diagnoses [10] during the EVD outbreak. Others have estimated that EVD-related disruptions in treating malaria alone will contribute to significantly more excess deaths than direct EVD-related mortality [11]. Mathematical modeling of malaria in Liberia has estimated that the disruption of treatment due to EVD will result in 520,000 untreated malaria cases, 57,200 new malaria cases that would not have occurred otherwise, and a 62% increase in malaria-attributable mortality [12]. Other modeling approaches have suggested that EVD-related deaths may significantly decrease life expectancy across Sierra Leone, Liberia, and Guinea [13]—not to mention collateral morbidity and mortality due to the disruption of these countries’ health systems. The majority of existing studies on the effects of the EVD outbreak on the delivery of primary healthcare have used survey sampling data or mathematical modeling methods [14–30].
Now, almost 2 years after the final case of EVD was discharged in Liberia, it is essential to understand the lingering effects of the EVD outbreak on the public-sector health system. Tragically, one of the most enduring legacies of this global health emergency was the death of health workers. Liberia lost 184 doctors, nurses, and midwives due to EVD—a loss of 8% of the nationwide total—leaving Liberia with only 2.1 doctors, nurses, and midwives per 10,000 population; this density ranks as one of the lowest in the world and is far below the minimum World Health Organization standard of 23 per 10,000 [31]. While there have been a significant number of studies examining the effect of the EVD outbreak on health systems, including a number from Liberia, the majority have had significant limitations, including the following: (1) analyzing a small sub-sample of health facilities in select districts; (2) using only 1 year of data to populate pre-EVD and/or post-EVD trends; (3) analyzing data at an aggregate district, provincial, or national level rather than at the facility level; (4) using strict linear time trends rather than more flexible functional forms; (5) using statistical methods that fail to account for data clustering, seasonality, or autocorrelation; (6) a lack of forecasting to examine the impact of the EVD outbreak versus a counterfactual; and (7) focusing on only 1 small subset of primary healthcare indicators in a given analysis.
The aim of the present study is to extend previous research estimating the effects of the EVD outbreak on health system outputs by analyzing monthly facility-level system outputs for 7 years across 10 key primary healthcare indicators in a census of public-sector health facilities in Liberia, excluding Montserrado County. We additionally aim to use more than 4 years of pre-EVD data to generate accurate forecasts, allowing estimation of lost system outputs due to the EVD outbreak in Liberia to aid in future targeting of health system strengthening.
Methods
Ethics statement
This paper was approved by the Liberian Ministry of Health (MoH) and used existing RHIS data that do not qualify as human subjects research.
Data sources and outcomes
The primary outcome was monthly facility-level time-series data abstracted from the Liberian MoH RHIS, which is integrated with District Health Information Software 2 (DHIS 2) open-source software. We abstracted all available data from 1 January 2010 to 31 December 2016 across indicators and health facilities nationwide, with the exception of facilities in Montserrado County, which houses the capital of Monrovia (see S1 Fig for the county structure of Liberia). We excluded health facilities in Montserrado County for 2 reasons. First, Montserrado County has unique sociodemographic characteristics compared to the rest of Liberia in that 85% of its population is in the fourth or highest wealth quintile, compared to only 14% in these quintiles averaging across all other counties nationwide [32]. Second, and more pertinent to the present analyses, there exist numerous for-profit, religious, and not-for-profit clinics and pharmacies operating in Montserrado County, which do not report to the MoH and thus would not be captured in these analyses. This contrasts to the other 14 counties nationwide, where few private clinics exist, and the vast majority of care is provided by public-sector clinics reporting through the national RHIS. Our analyses included the following indicators: (1) clinic visits; (2) bacille Calmette–Guérin (BCG) vaccinations; (3) measles vaccinations; (4) first pentavalent vaccinations; (5) first antenatal care (ANC) visits; (6) institutional births; (7) postnatal care (PNC) visits within 6 weeks of birth; (8) artemisinin-based combination therapy (ACT) treatments for malaria; (9) acute respiratory infections (ARIs) treated; and (10) medroxyprogesterone acetate doses. These indicators were selected from DHIS 2 as they represent key outputs for the effective delivery of primary healthcare across Liberia that have not changed in definition and data collection procedures during the time period of interest (2010–2016). PNC visits within 6 weeks and ARIs treated were analyzed beginning 1 January 2012 due to inconsistent reporting in the MoH system prior to this time.
Statistical analyses and data cleaning
The specific hypotheses we intended to test were as follows: (1) Did the EVD outbreak lead to statistically significant reductions in primary healthcare outputs? (2) What is the magnitude of lost primary healthcare outputs compared to pre-EVD forecasted trends, and how do these reductions differ by primary care indicator? (3) Have primary healthcare outputs recovered to pre-EVD levels as of December 2016? (4) What is the magnitude of recovery of primary healthcare outputs, and how does this differ by primary care indicator?
Our a priori analysis plan included (1) data cleaning and outlier identification using individual facility-level local regression analyses over time; (2) initial univariate analyses of indicators over time to determine functional forms for model parameterization; (3) analyses of the effect of the EVD outbreak on each indicator; and (4) forecasts to determine estimates of lost health system outputs due to the EVD outbreak.
Initial data abstraction identified 379 public-sector MoH facilities reporting through the DHIS 2 system from 1 January 2010 to 31 December 2016 across all counties excluding Montserrado County. Individual facility-level local regression analyses were conducted, with outliers identified and set to missing if they exceeded 8 standard deviations from the mean time trend. Measles vaccination was excluded from facility-level local regression outlier analyses due to a measles campaign during the Ebola outbreak that led to informative data that would have been incorrectly tagged as outliers by outlier analysis. Facilities were excluded from analyses if they failed to report at least 12 monthly observations over the 7-year period for a given indicator. After observing large facility-level heterogeneity in intercepts, as well as trends over time, we employed mixed-effects models with random intercepts for facility and random slopes over time (see equation below).
where Indicatorit represents 1 of 10 key primary healthcare system outputs included in this study (e.g., clinic visits); subscripts i, y, and t indicate a health facility i (running from 1 to 379) in calendar year y (running from 1 to 7) and at month t (running from 1 to 84); β0i represents the model intercept with both a fixed effect and facility-level random effects; Splineyt indexes time within calendar year y at month t (these linear splines include fixed effects and random effects by facility); Month is an individual dummy variable indexing month of the year using the month of January as the reference category; Catchmentit is the catchment population for health facility i at month t; Ebola1 counts the months since the beginning of the Ebola outbreak in June 2014; Ebola2 counts the months since October 2014; and AfterEbola counts the months since the end of the Ebola outbreak in May 2015.Since RHIS data are facility-level counts, our initial a priori analysis plan was to use Poisson or negative binomial models with health facility catchment population as an offset term. However, the final model we employed was a linear mixed-effects model with a normal residual distribution. We used a linear mixed-effects model for 3 reasons. First, attempts to run these complex models (>25,000 observations; 8 random effects) as Poisson models failed to converge without simplifications such as the elimination of facility-level random slopes and the elimination of an AR(1) structure for autocorrelation in residual errors. Second, a linear mixed model converged and resulted in a stable model with approximately normal residual errors and best linear unbiased predictors (predicted random effects). Third, using linear models allows the intuitive interpretation of absolute differences in health facility outputs over time, rather than ratios of rates on a multiplicative scale, as one would receive from a Poisson model, which are often less easy to interpret by policymakers and implementers.
After initial univariate analyses of indicators over time, we modeled the time effect using yearly splines, and the effect of Ebola was modeled using a segmented regression parameterization with pre-EVD trends (1 January 2010–31 May 2014), trends for the first 4 months of the EVD outbreak (1 June 2014–30 September 2014), trends for the middle 3 months of the EVD outbreak (1 October 2014–31 December 2014), trends for the last 4 months of the EVD outbreak (1 January 2015–30 April 2015), and post-Ebola trends (1 May 2015–31 December 2016). Due to large observed seasonal effects, we included fixed-effect monthly indicator variables in all models. An AR(1) structure was used to account for autocorrelation in residual errors. To control for clinic-level catchment population, we included a fixed effect of facility-level catchment population, which aids in explaining some of the non-random natural heterogeneity of health facilities. Missing data were accounted for in the mixed-effects models using standard maximum likelihood estimation. In order to develop forecasts, we reran the abovementioned mixed-effects linear models to extend pre-EVD trends through December 2016 as a “counterfactual” to the observed EVD outbreak. We simulated 1,000 predictions per month under each model (full and counterfactual) using the coefficients and covariance matrix of the fixed parts of each model using a multivariate normal distribution [33]. Lost health system outputs were computed as the differences between the mean simulated values under the full model and the forecasted (counterfactual) model. To compute 95% confidence intervals around these differences, we used the range from the percentiles 2.5 and 97.5 of simulated values. p-Values were calculated as the smaller of the proportion of simulated values falling either above or below zero. This value was then multiplied by 2 to represent a 2-sided p-value. All analyses were conducted using Stata 15 and a 2-sided alpha value of 0.05 (see S1 Text for Stata do file).
Results
Across the 379 clinics and the 31,836 clinic-months in the analyses, the mean clinic-level catchment population was 6,912 (range: 214–67,381), serving an estimated total population of approximately 2.6 million (Table 1). Across the 14 counties included in the analyses, there were a total of 2,320 EVD cases, ranging from 2 cases in Grand Gedeh and River Cess to 746 cases in Lofa. Data from previous community surveys suggest that all counties except Sinoe and Grand Kru have more than 90% of women attending at least 1 ANC visit, although on average across all counties, only 52.7% of women deliver in a health facility (range: 34.6%–75.6%). The average BCG coverage across counties is 89.5%, with measles coverage lower, at 70.6%. Malaria prevalence in children is high, at 34.4%.
Tab. 1. Background information on a census of 379 public-sector health facilities reporting through DHIS 2 by county and by indicator across all Liberian counties excluding Montserrado, 2010–2016. 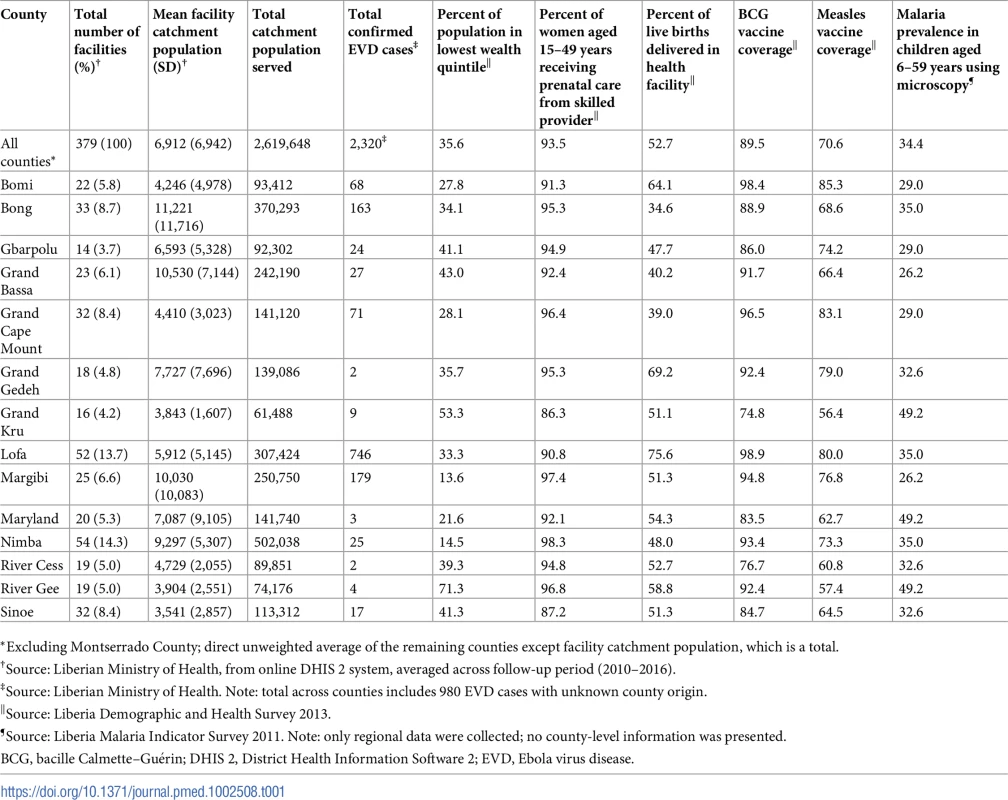
*Excluding Montserrado County; direct unweighted average of the remaining counties except facility catchment population, which is a total. Given that not all clinics perform, and thus report, all 10 primary care indicators, the number of facilities and facility-months included in analyses vary by indicator. Values range from 379 clinics and 31,736 clinic-months for clinic visits and ACT treatments for malaria to 275 clinics and 23,100 clinic-months for institutional births and 244 clinics and 14,640 clinic-months for treatment of ARIs (see Table 2). The proportion of clinic-months missing also varied from a low of 4.8% for outpatient clinic visits to a high of 14.3% for medroxyprogesterone acetate doses. The number of outliers identified through facility-level local regression analyses ranged from 1.1% of clinic-months for BCG vaccinations and first ANC visits to a low of 0.34% for ARIs. Rates of missing data varied over time, with most indicators showing more missing data earlier in the time series (2010–2014) compared to in later years. For some indicators, there was a slight increase in missing data during the first 4 months of the EVD outbreak (June–September 2014) compared to the 5 months just prior to the EVD outbreak (January–May 2014); however, these increases were relatively small (clinic visits: 4.3% to 7.3%; institutional births: 5.1% to 6.0%; ACT treatments: 4.6% to 8.0%) and not consistent for all indicators (BCG doses: 6.4% to 6.3%; measles doses: 8.4% to 7.1%).
Tab. 2. Dates system outputs surpassed pre-Ebola forecasted trends for 3 months, total system outputs estimated to be lost due to the Ebola virus disease (EVD) outbreak (June 2014–April 2015), and number of clinics and clinic-months included for 10 key health system outputs across a census of clinics providing services in Liberia excluding Montserrado County, 2010–2016. 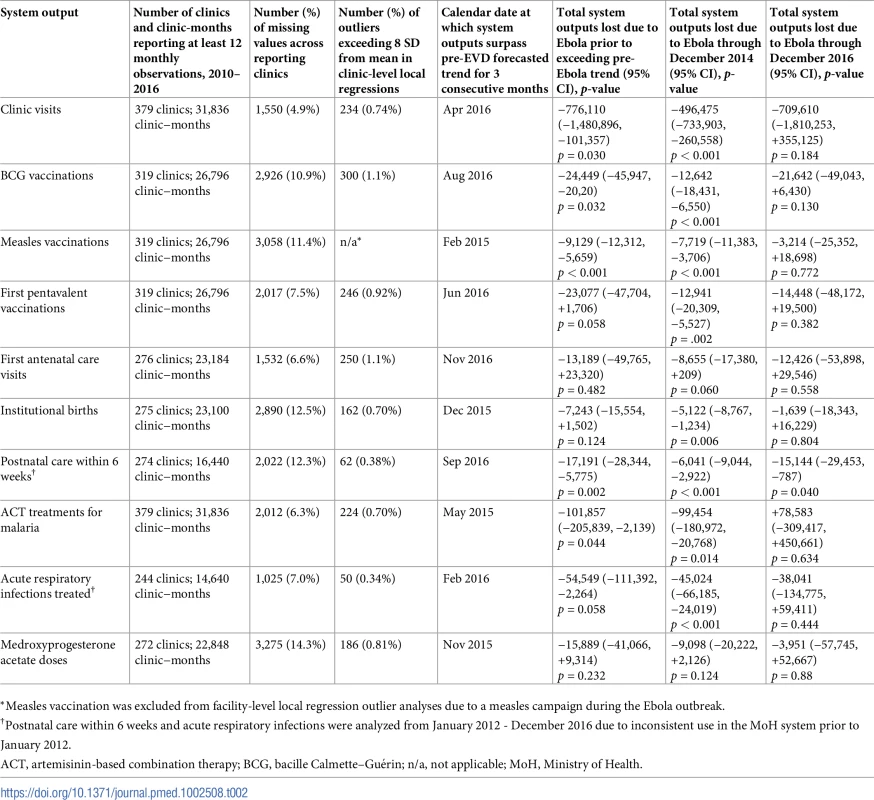
*Measles vaccination was excluded from facility-level local regression outlier analyses due to a measles campaign during the Ebola outbreak. Pre-EVD trends (January 2010–May 2014)
Pre-EVD trends were heterogeneous by indicator. Clinic visits, first ANC visits, and ACT malaria treatments all showed strong and consistent decreases across the pre-EVD period, resulting in decreases in system outputs of −21.9% (95% CI: −27.6%, −16.3%, p < 0.001), −30.8% (95% CI: −38.4%, −23.3%, p < 0.001), and −30.0% (95% CI: −39.2%, −20.8%, p < 0.001), respectively, comparing January 2010 to January 2014. Other indicators showed strong and consistent increases, including institutional births (+91.6%; 95% CI: +61.4%, +121.9%, p < 0.001) and medroxyprogesterone acetate doses (+108.5%; 95% CI: +70.0, +146.9, p < 0.001). Remaining indicators showed mixed trends, with some years of significant increases and some years of significant decreases (see Tables 3–6; see Figs 1–10). Of note is that official MoH clinic catchment populations increased an average of 8.6% from January 2011 to January 2014.
Fig. 1. Mean trends and system losses due to Ebola virus disease (EVD) outbreak (June 2014–April 2015) for clinic visits in a census of 379 clinics providing services in Liberia from 2010–2016, excluding Montserrado County. 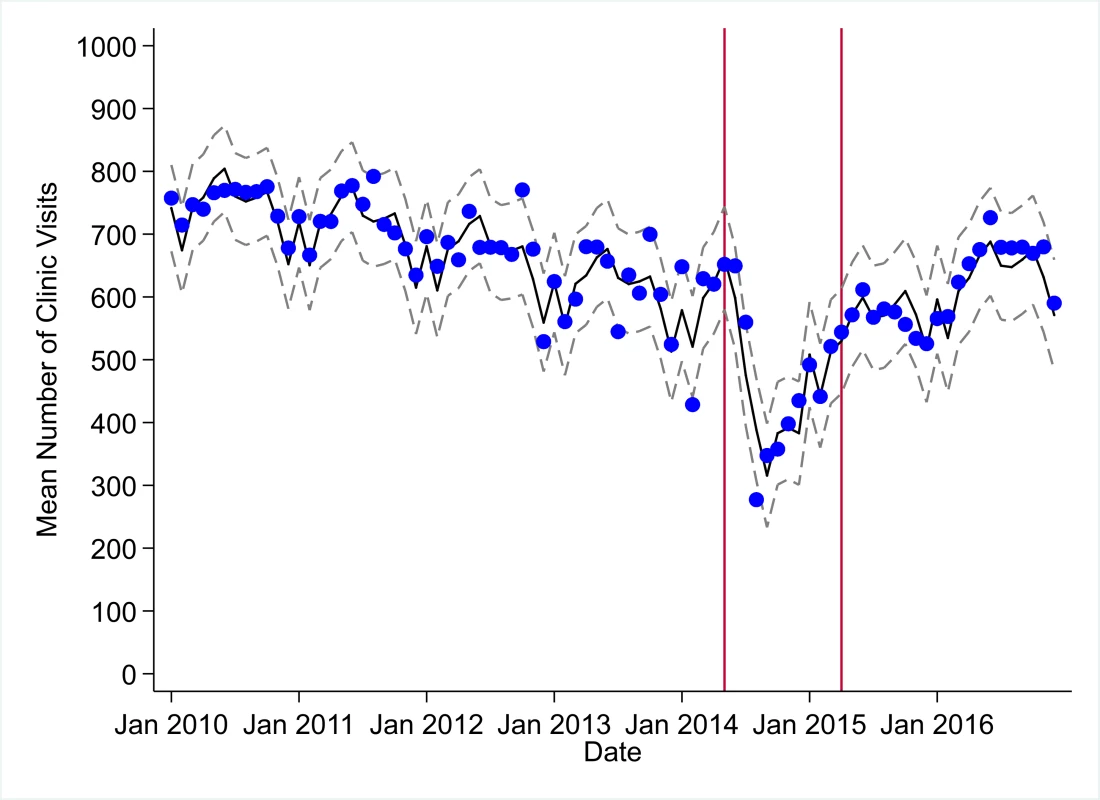
The black solid line represents the fitted mean from a linear mixed model using a segmented regression parameterization, random intercepts and slopes by facility, monthly indicator variables to adjust for seasonality, a fixed effect to adjust for clinic-level catchment area, and an AR(1) structure to account for autocorrelation in residual errors. Gray dashed lines are 95% confidence intervals around the fitted mean. Red lines are placed at the final month before the start (May 2014) and end (April 2015) of the EVD outbreak in Liberia. Fig. 2. Mean trends and system losses due to Ebola virus disease (EVD) outbreak (June 2014–April 2015) for bacille Calmette–Guérin (BCG) vaccinations in a census of 379 clinics providing services in Liberia from 2010–2016, excluding Montserrado County. 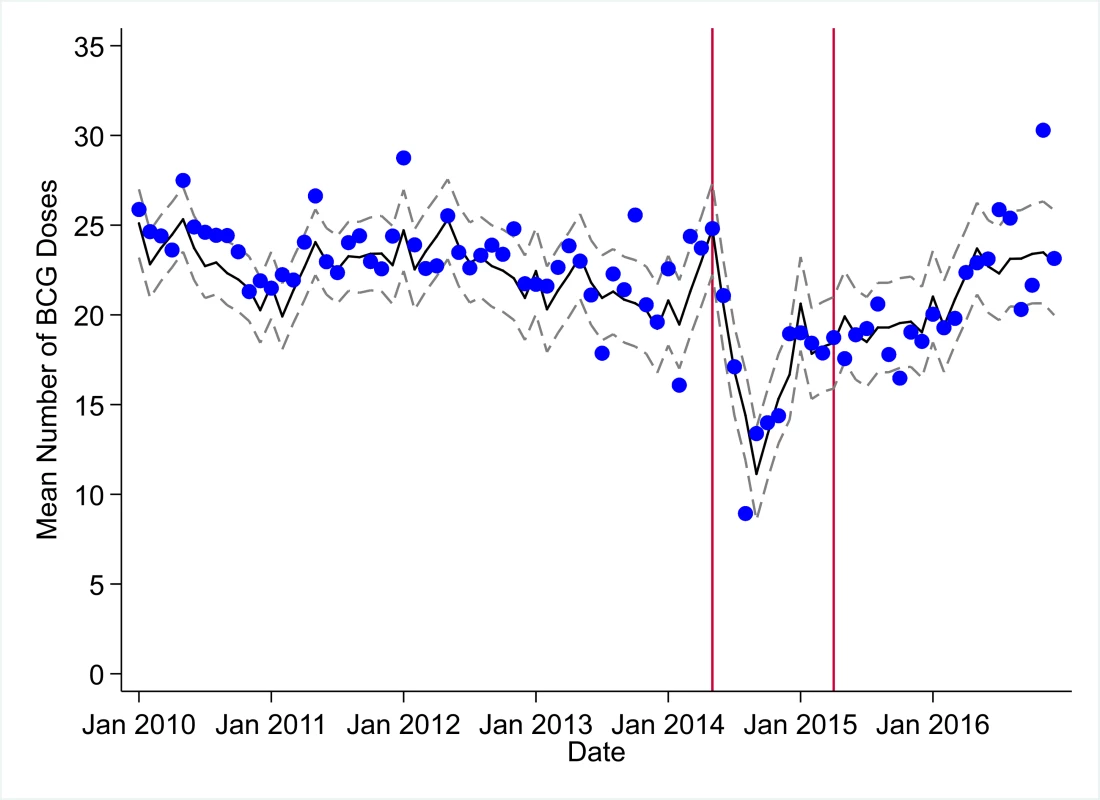
The black solid line represents the fitted mean from a linear mixed model using a segmented regression parameterization, random intercepts and slopes by facility, monthly indicator variables to adjust for seasonality, a fixed effect to adjust for clinic-level catchment area, and an AR(1) structure to account for autocorrelation in residual errors. Gray dashed lines are 95% confidence intervals around the fitted mean. Red lines are placed at the final month before the start (May 2014) and end (April 2015) of the EVD outbreak in Liberia. Fig. 3. Mean trends and system losses due to Ebola virus disease (EVD) outbreak (June 2014–April 2015) for measles vaccinations in a census of 379 clinics providing services in Liberia from 2010–2016, excluding Montserrado County. 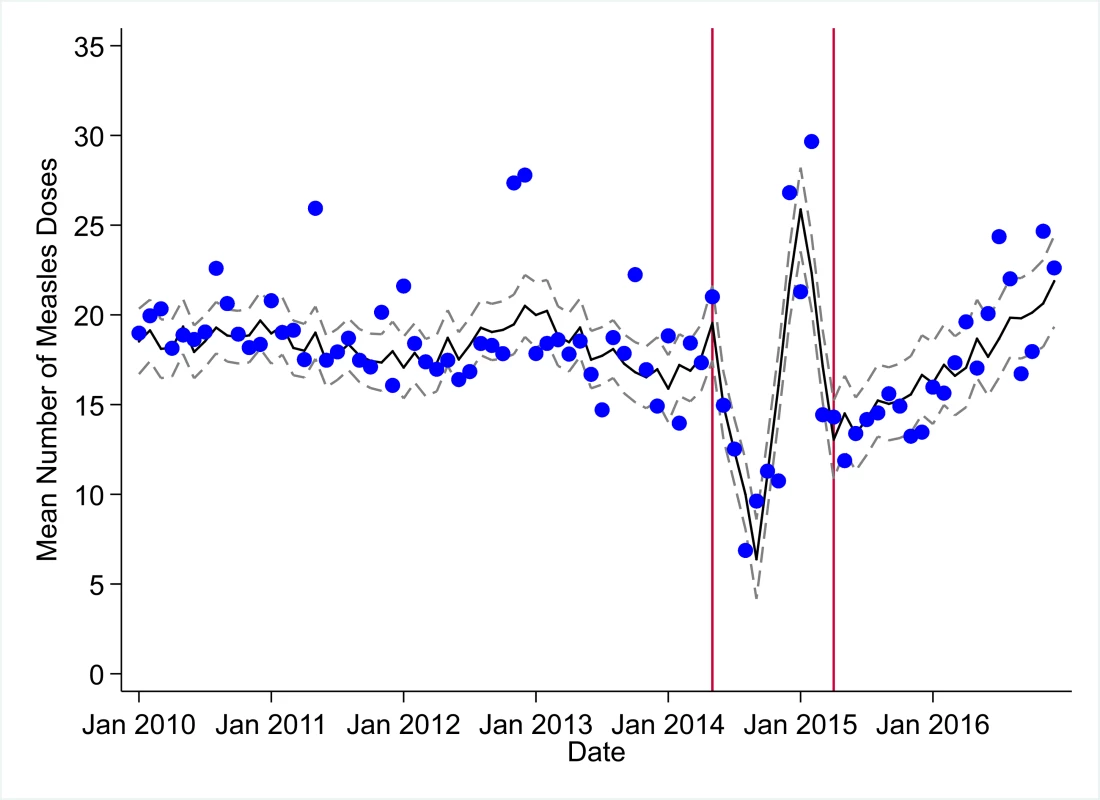
The black solid line represents the fitted mean from a linear mixed model using a segmented regression parameterization, random intercepts and slopes by facility, monthly indicator variables to adjust for seasonality, a fixed effect to adjust for clinic-level catchment area, and an AR(1) structure to account for autocorrelation in residual errors. Gray dashed lines are 95% confidence intervals around the fitted mean. Red lines are placed at the final month before the start (May 2014) and end (April 2015) of the EVD outbreak in Liberia. Fig. 4. Mean trends and system losses due to Ebola virus disease (EVD) outbreak (June 2014–April 2015) for first pentavalent vaccinations in a census of 379 clinics providing services in Liberia from 2010–2016, excluding Montserrado County. 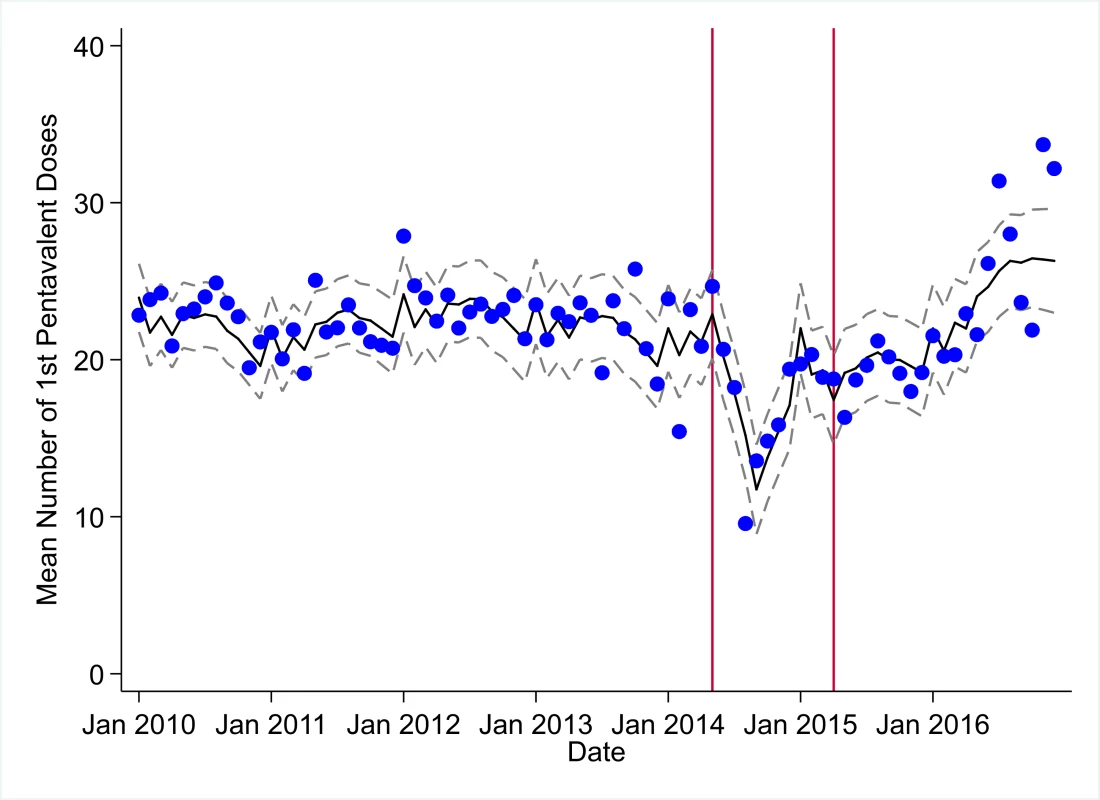
The black solid line represents the fitted mean from a linear mixed model using a segmented regression parameterization, random intercepts and slopes by facility, monthly indicator variables to adjust for seasonality, a fixed effect to adjust for clinic-level catchment area, and an AR(1) structure to account for autocorrelation in residual errors. Gray dashed lines are 95% confidence intervals around the fitted mean. Red lines are placed at the final month before the start (May 2014) and end (April 2015) of the EVD outbreak in Liberia. Fig. 5. Mean trends and system losses due to Ebola virus disease (EVD) outbreak (June 2014–April 2015) for first antenatal care visits in a census of 379 clinics providing services in Liberia from 2010–2016, excluding Montserrado County. 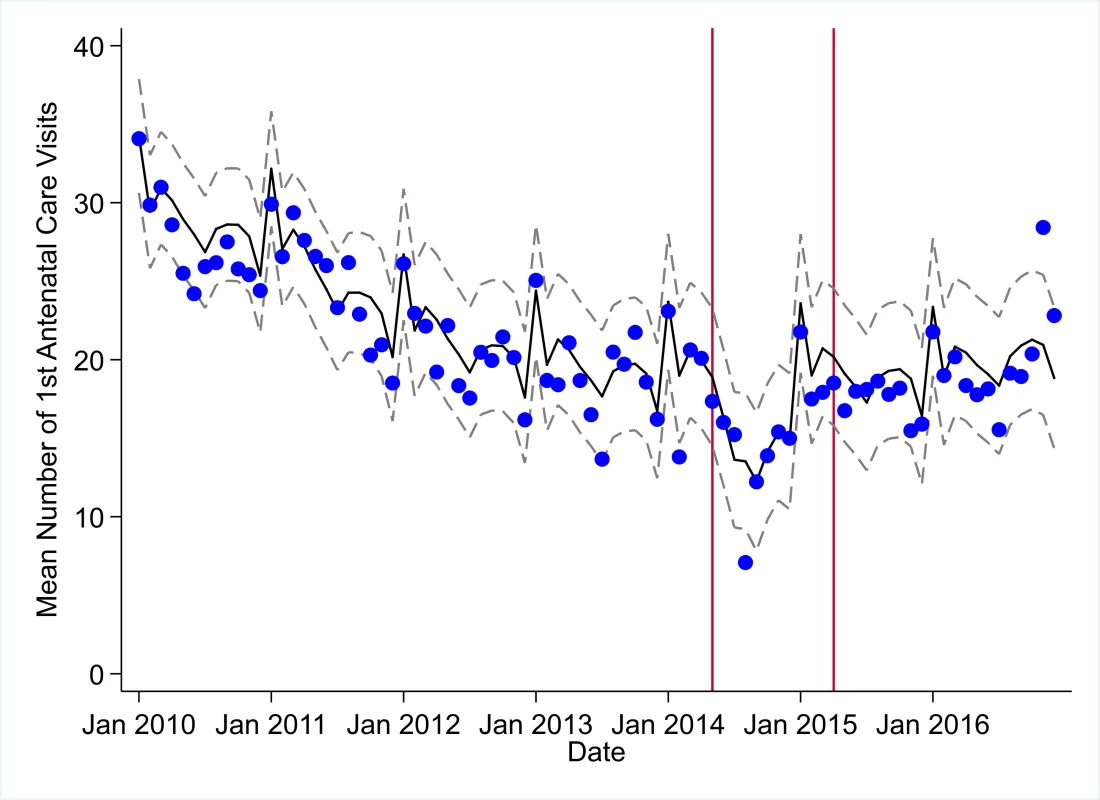
The black solid line represents the fitted mean from a linear mixed model using a segmented regression parameterization, random intercepts and slopes by facility, monthly indicator variables to adjust for seasonality, a fixed effect to adjust for clinic-level catchment area, and an AR(1) structure to account for autocorrelation in residual errors. Gray dashed lines are 95% confidence intervals around the fitted mean. Red lines are placed at the final month before the start (May 2014) and end (April 2015) of the EVD outbreak in Liberia. Fig. 6. Mean trends and system losses due to Ebola virus disease (EVD) outbreak (June 2014–April 2015) for institutional births in a census of 379 clinics providing services in Liberia from 2010–2016, excluding Montserrado County. 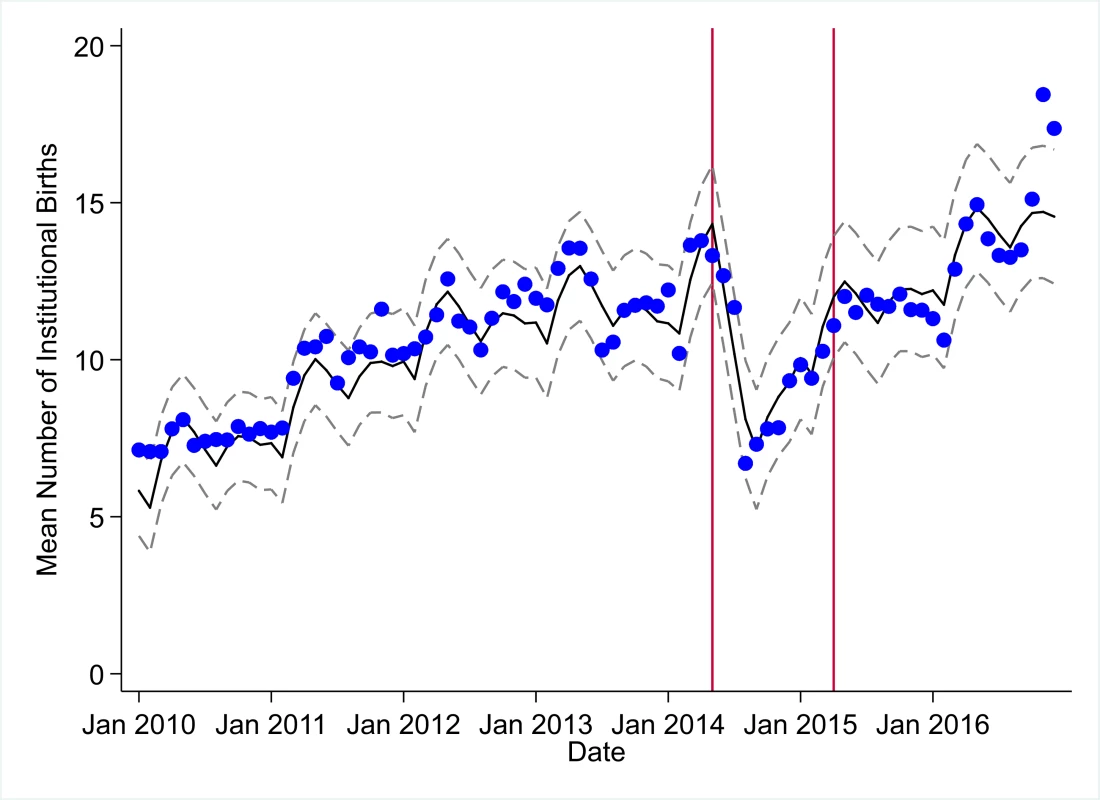
The black solid line represents the fitted mean from a linear mixed model using a segmented regression parameterization, random intercepts and slopes by facility, monthly indicator variables to adjust for seasonality, a fixed effect to adjust for clinic-level catchment area, and an AR(1) structure to account for autocorrelation in residual errors. Gray dashed lines are 95% confidence intervals around the fitted mean. Red lines are placed at the final month before the start (May 2014) and end (April 2015) of the EVD outbreak in Liberia. Fig. 7. Mean trends and system losses due to Ebola virus disease (EVD) outbreak (June 2014–April 2015) for postnatal care within 6 weeks in a census of 379 clinics providing services in Liberia from 2010–2016, excluding Montserrado County. 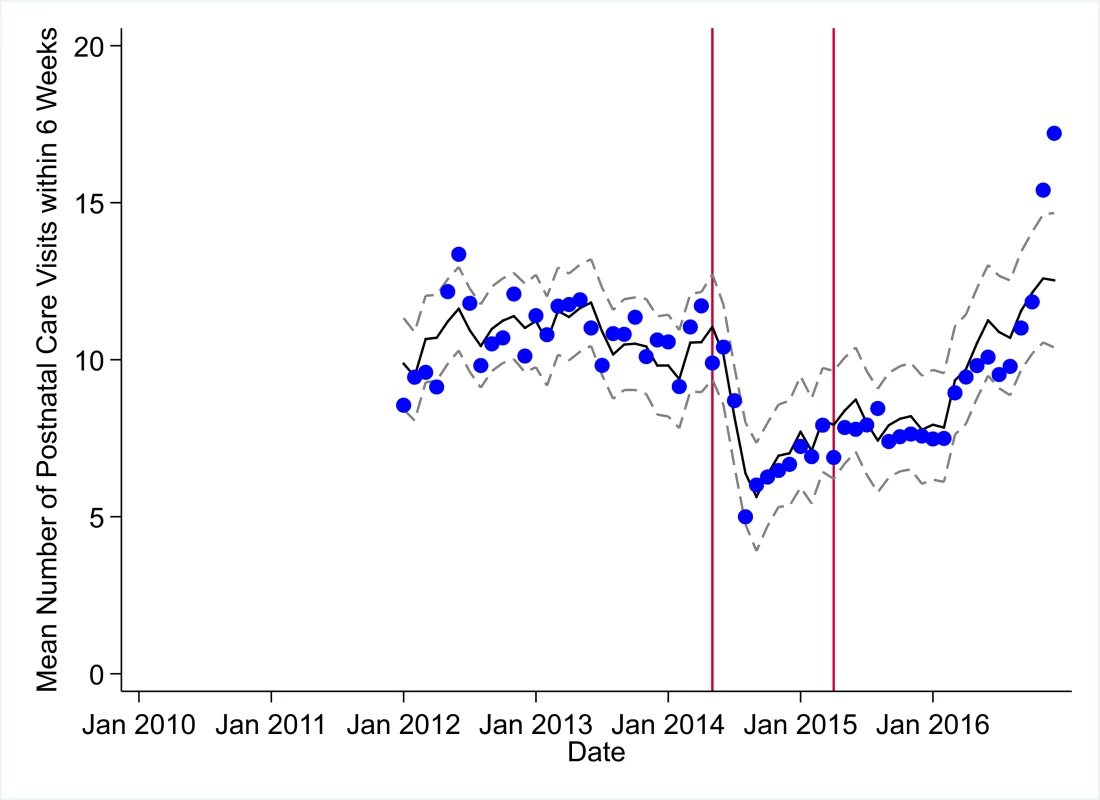
The black solid line represents the fitted mean from a linear mixed model using a segmented regression parameterization, random intercepts and slopes by facility, monthly indicator variables to adjust for seasonality, a fixed effect to adjust for clinic-level catchment area, and an AR(1) structure to account for autocorrelation in residual errors. Gray dashed lines are 95% confidence intervals around the fitted mean. Red lines are placed at the final month before the start (May 2014) and end (April 2015) of the EVD outbreak in Liberia. Fig. 8. Mean trends and system losses due to Ebola virus disease (EVD) outbreak (June 2014–April 2015) for artemisinin-based combination therapy (ACT) treatments for malaria in a census of 379 clinics providing services in Liberia from 2010–2016, excluding Montserrado County. 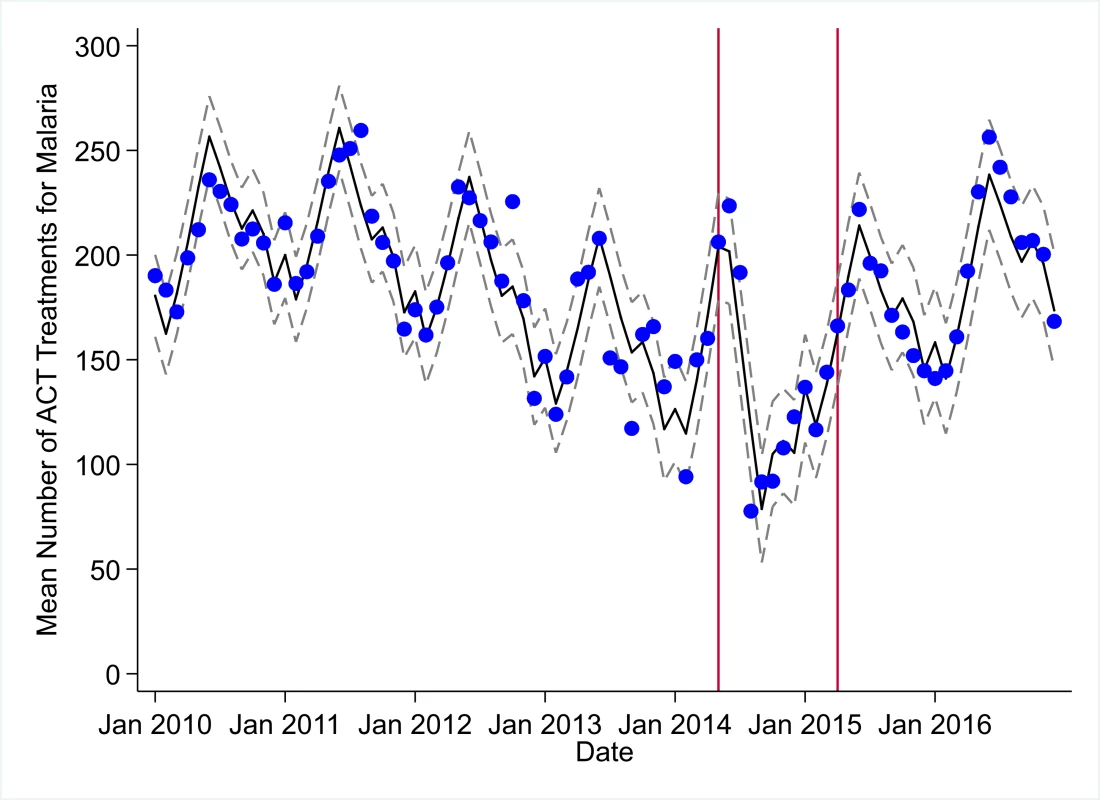
The black solid line represents the fitted mean from a linear mixed model using a segmented regression parameterization, random intercepts and slopes by facility, monthly indicator variables to adjust for seasonality, a fixed effect to adjust for clinic-level catchment area, and an AR(1) structure to account for autocorrelation in residual errors. Gray dashed lines are 95% confidence intervals around the fitted mean. Red lines are placed at the final month before the start (May 2014) and end (April 2015) of the EVD outbreak in Liberia. Fig. 9. Mean trends and system losses due to Ebola virus disease (EVD) outbreak (June 2014–April 2015) for acute respiratory infections treated in a census of 379 clinics providing services in Liberia from 2010–2016, excluding Montserrado County. 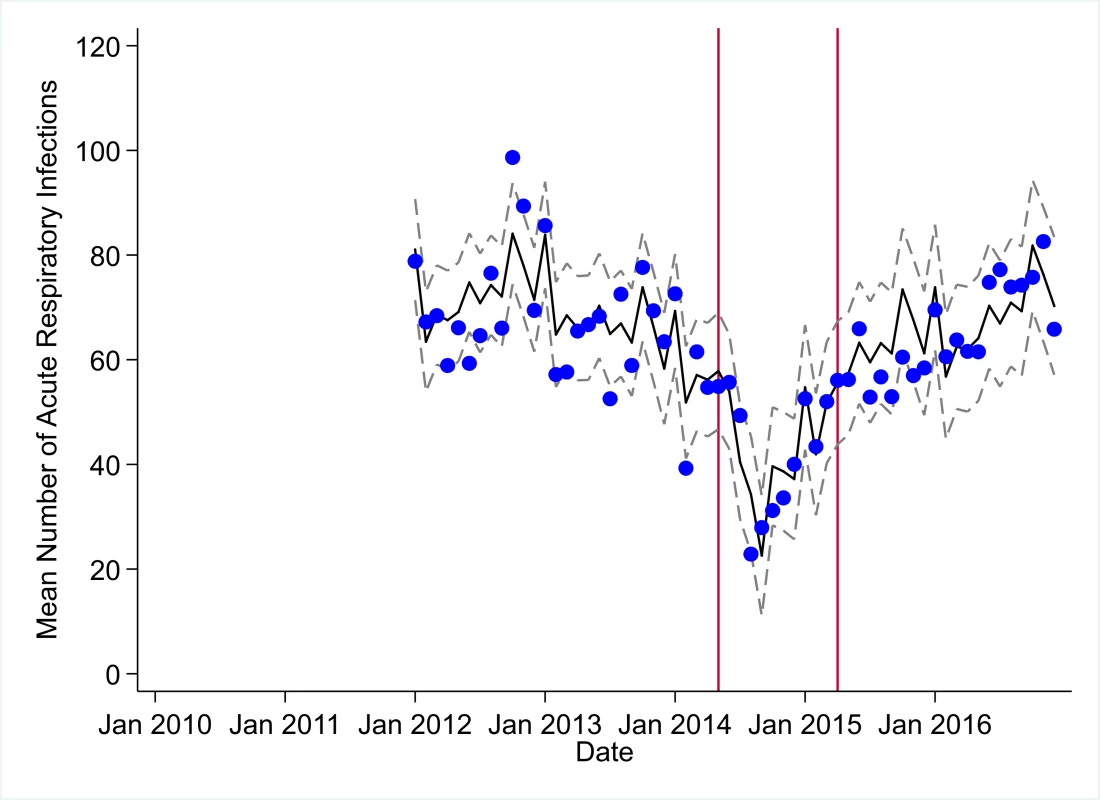
The black solid line represents the fitted mean from a linear mixed model using a segmented regression parameterization, random intercepts and slopes by facility, monthly indicator variables to adjust for seasonality, a fixed effect to adjust for clinic-level catchment area, and an AR(1) structure to account for autocorrelation in residual errors. Gray dashed lines are 95% confidence intervals around the fitted mean. Red lines are placed at the final month before the start (May 2014) and end (April 2015) of the EVD outbreak in Liberia. Fig. 10. Mean trends and system losses due to Ebola virus disease (EVD) outbreak (June 2014–April 2015) for medroxyprogesterone acetate doses in a census of 379 clinics providing services in Liberia from 2010–2016, excluding Montserrado County. 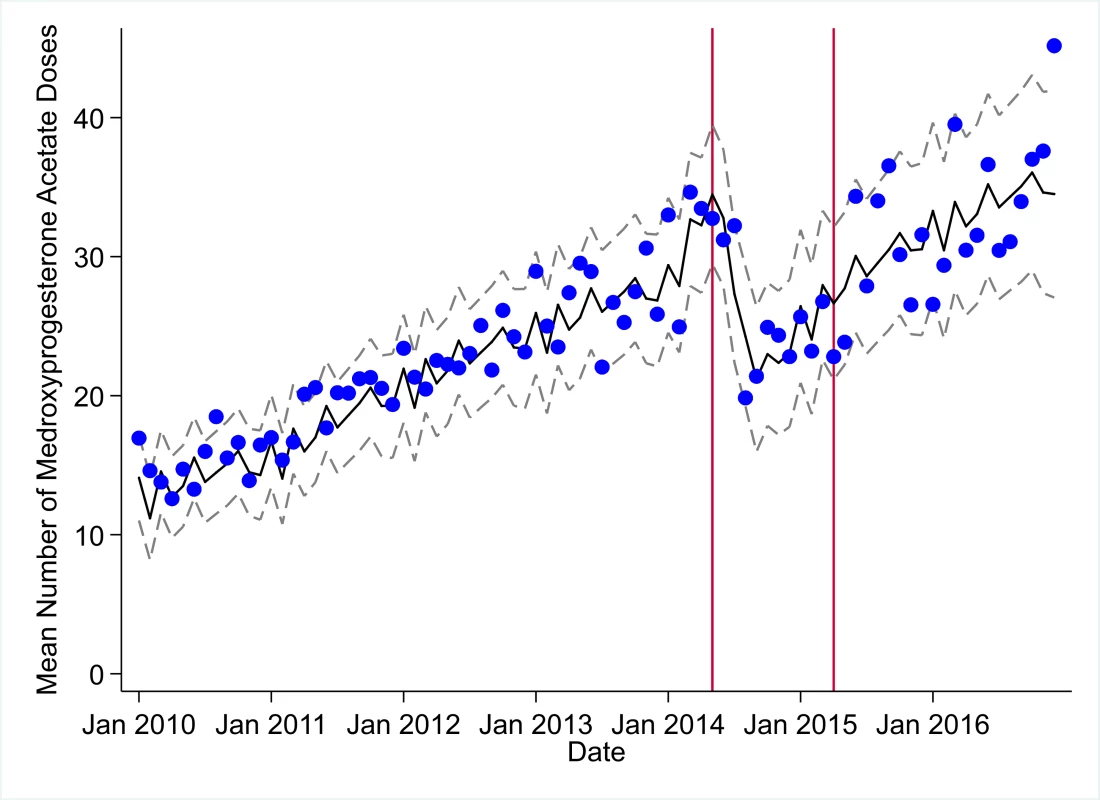
The black solid line represents the fitted mean from a linear mixed model using a segmented regression parameterization, random intercepts and slopes by facility, monthly indicator variables to adjust for seasonality, a fixed effect to adjust for clinic-level catchment area, and an AR(1) structure to account for autocorrelation in residual errors. Gray dashed lines are 95% confidence intervals around the fitted mean. Red lines are placed at the final month before the start (May 2014) and end (April 2015) of the EVD outbreak in Liberia. Tab. 3. Parameter estimates and system losses due to Ebola virus disease (EVD) outbreak (June 2014–April 2015) for clinic visits, bacille Calmette–Guérin (BCG) vaccinations, and measles vaccinations across a census of clinics providing services in Liberia excluding Montserrado County, 2010–2016. 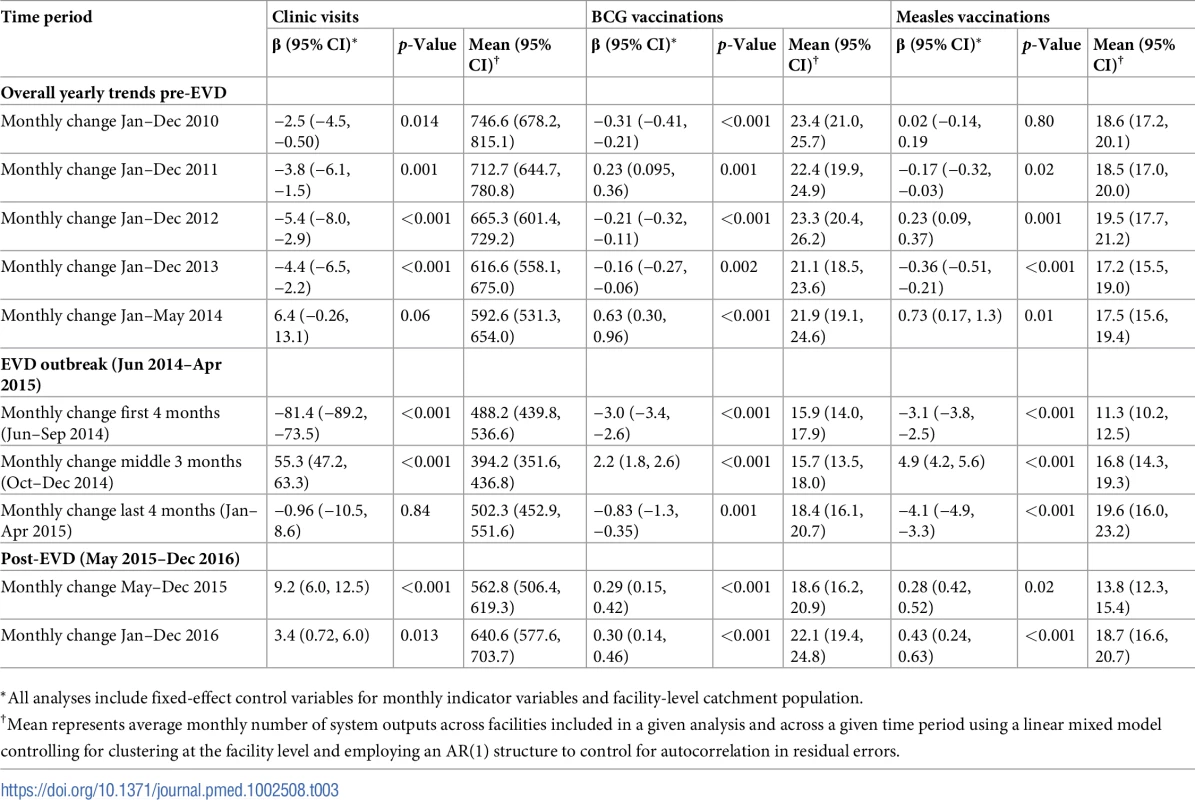
*All analyses include fixed-effect control variables for monthly indicator variables and facility-level catchment population. Tab. 4. Parameter estimates and system losses due to Ebola virus disease (EVD) outbreak (June 2014–April 2015) for first pentavalent vaccinations, first antenatal care visits, and institutional births across a census of clinics providing services in Liberia excluding Montserrado County, 2010–2016. 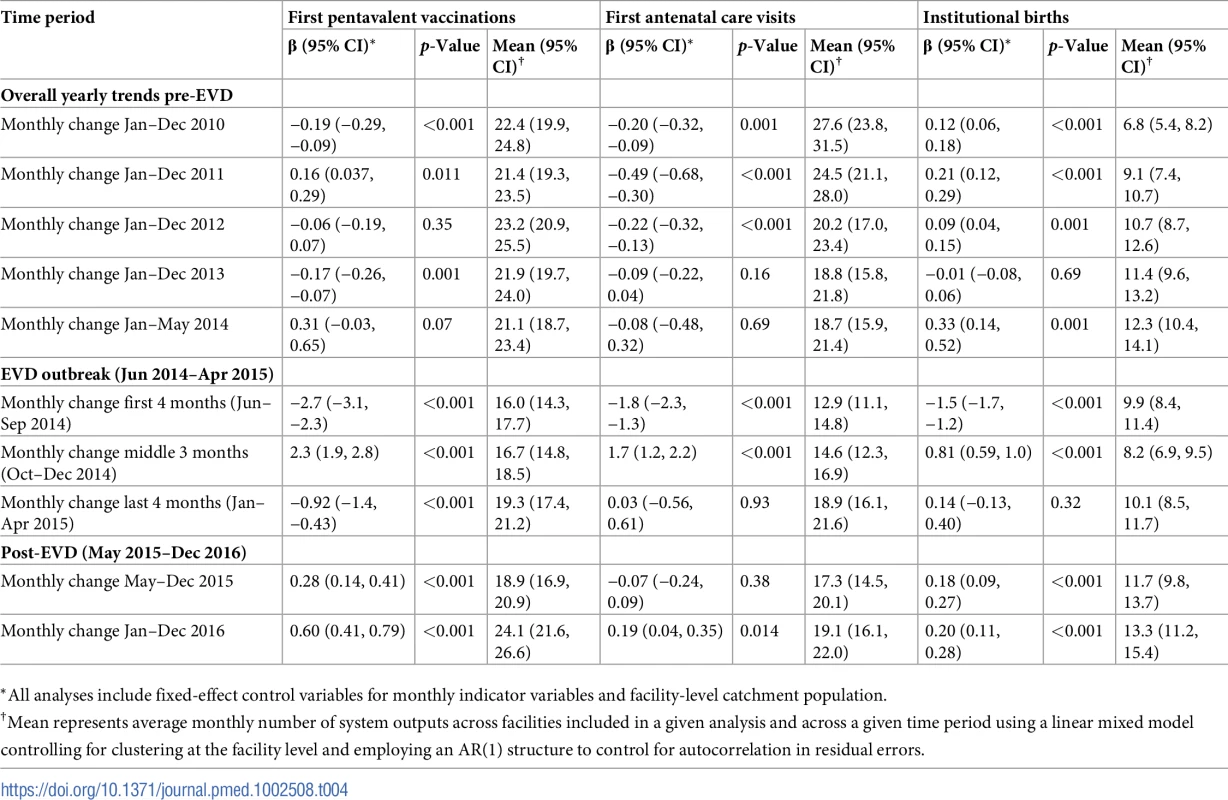
*All analyses include fixed-effect control variables for monthly indicator variables and facility-level catchment population. Tab. 5. Parameter estimates and system losses due to Ebola virus disease (EVD) outbreak (June 2014–April 2015) for postnatal care visits within 6 weeks, artemisinin-based combination therapy (ACT) treatments for malaria, and acute respiratory infections treated across a census of clinics providing services in Liberia excluding Montserrado County, 2010–2016. 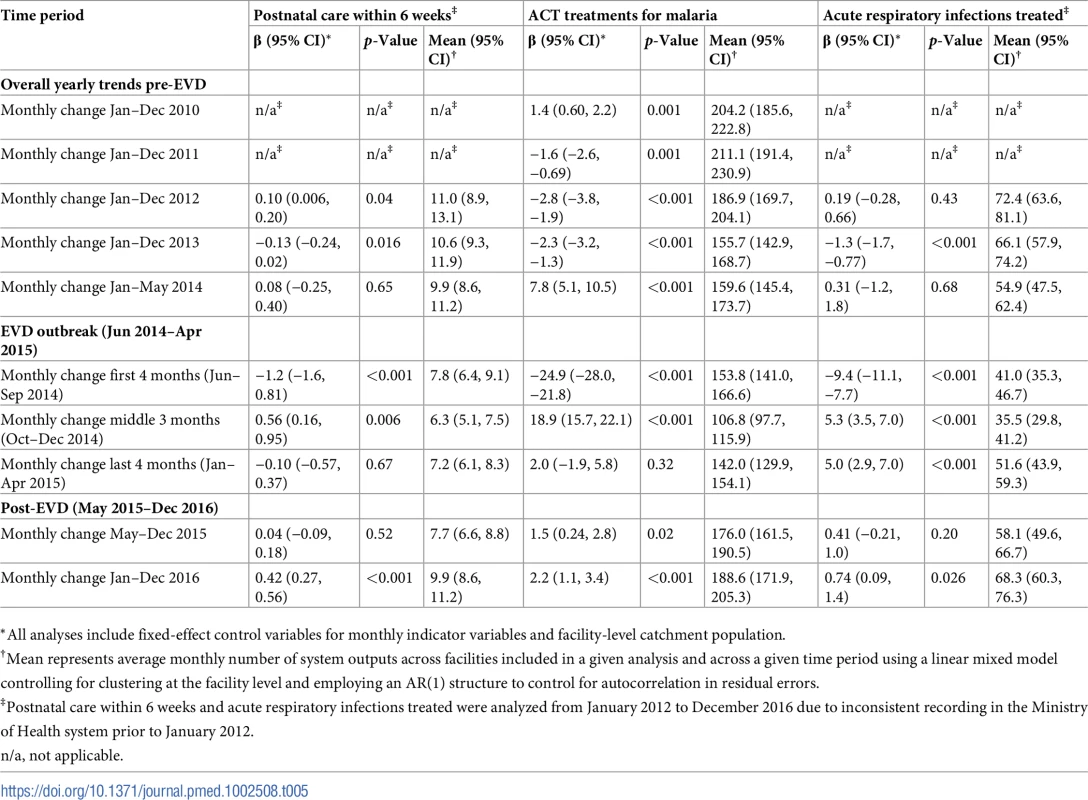
*All analyses include fixed-effect control variables for monthly indicator variables and facility-level catchment population. Tab. 6. Parameter estimates and system losses due to Ebola virus disease (EVD) outbreak (June 2014–April 2015) for medroxyprogesterone acetate doses across a census of clinics providing services in Liberia excluding Montserrado County, 2010–2016. 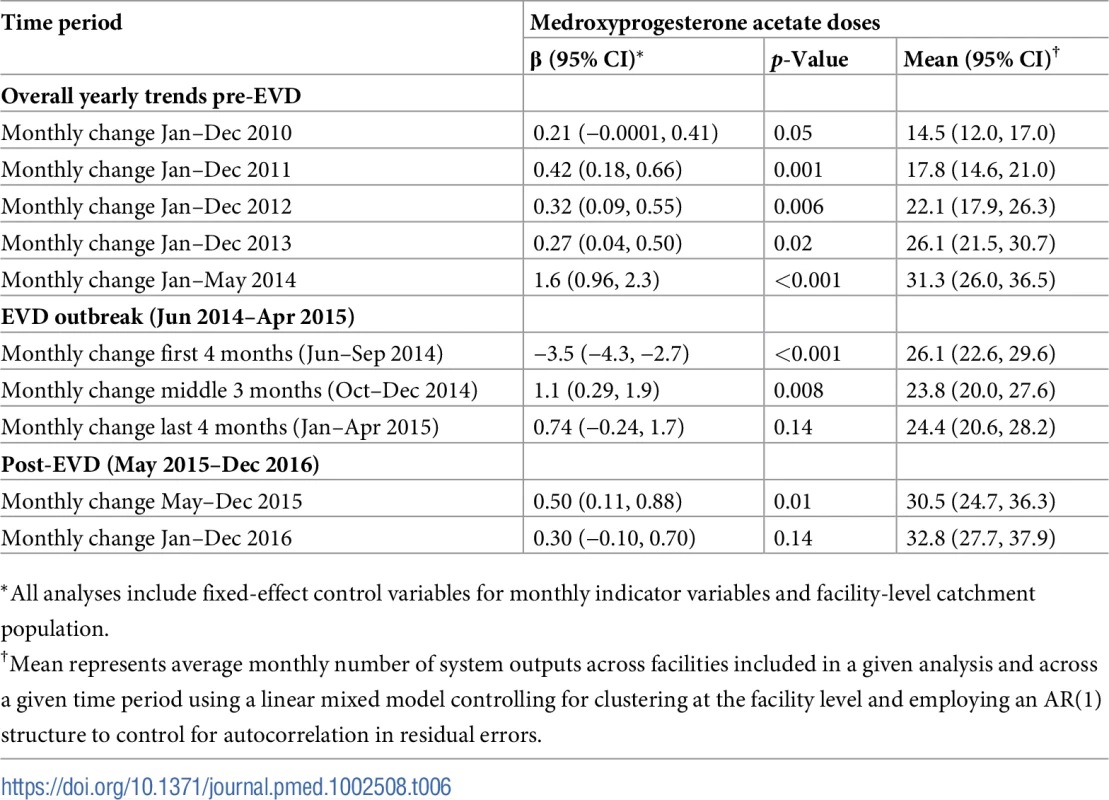
*All analyses include fixed-effect control variables for monthly indicator variables and facility-level catchment population. All indicators, except measles vaccinations, exhibited significant seasonal effects. Clinic visits were most common in the month of June, first ANC visits were most common in January, institutional births were most common in May, ACT malaria treatments were most common in June, and the most ARIs were treated in October.
Early effects of the EVD outbreak (June 2014–September 2014)
All indicators had statistically significant and clinically important decreases in system outputs during the first 4 months of the EVD outbreak (June 2014–September 2014) (Tables 3–6; Figs 1–10). Using raw means, all indicators had their lowest system outputs in the month of August 2014. Model-fitted decreases in outputs comparing the end of the initial EVD period (September 2014) to May 2014 (pre-EVD) ranged in magnitude from a 67.3% decrease in measles vaccinations (95% CI: −77.9%, −56.8%, p < 0.001) and a 61.4% decrease in ACT malaria treatments (95% CI: −69.0%, −53.8%, p < 0.001) to a 35.2% decrease in first ANC visits (95% CI: −45.8%, −24.7%, p < 0.001) and a 38.5% decrease in medroxyprogesterone acetate doses (95% CI: −47.6%, −29.5%, p < 0.001). All remaining indicators showed decreases in system outputs ranging from a 48.7% decrease in first pentavalent doses (95% CI: −56.0%, −41.5%, p < 0.001) to a 61.0% decrease in ARIs treated (95% CI: −73.6%, −48.3%, p < 0.001).
System resilience during the EVD outbreak (October 2014–April 2015)
Following the nadir of system outputs in August 2014, all indicators showed statistically significant increases from October 2014 to December 2014—beginning the recovery of health system outputs to pre-EVD levels (Tables 3–6). By January 2015, measles vaccination had increased to 162.9% of the pre-EVD levels from January 2014 (95% CI: 144.4%, 181.3%, p < 0.001), likely due to targeted vaccination campaigns. Furthermore, all other indicators increased from the nadir to a range of 107.8% of pre-EVD (January 2014) levels for ACT treatments (95% CI: 91.1%, 116.4%, p < 0.001) to 78.5% for PNC visits (95% CI: 65.9%, 91.1%, p < 0.001). Following these initial system increases, indicators showed mixed progress over the next 4 months (January 2015–April 2015), with clinic visits, first ANC visits, institutional births, PNC visits, ACT treatments for malaria, and medroxyprogesterone acetate doses showing no significant increases. BCG and first pentavalent vaccinations also showed significant decreases during this time period. In contrast to all other indicators, treatment for ARIs continued to significantly increase during this time period. By May 2015, measles vaccinations normalized to 74.2% of pre-EVD (May 2014) levels (95% CI: 64.6%, 83.8%, p < 0.001) as targeted campaigns ended.
Post-EVD trends (May 2015–December 2016)
All indicators had significant positive trends during the post-EVD period, with every system output exceeding pre-Ebola forecasted trends for 3 consecutive months by November 2016. Measles vaccinations exceeded pre-Ebola forecasted trends earliest, achieving the 3-month benchmark in February 2015 even prior to the EVD outbreak finishing (Table 2). Other indicators notable for their rapid recovery to pre-EVD levels included ACT treatments for malaria (recovered by May 2015), medroxyprogesterone acetate doses (recovered by November 2015), and institutional births (recovered by December 2015). First ANC visits, PNC visits within 6 weeks, and ARIs treated did not show significant increases during the initial 8-month period post-EVD (May–December 2015); however, all showed significant increases from January to December 2016. PNC visits and first ANC visits took longest to recover to pre-EVD levels, achieving 3 months of output exceeding the pre-Ebola forecast in September and November 2016, respectively.
Estimates of system outputs lost due to the EVD outbreak
Health system outputs lost due to the EVD outbreak were large and sustained for most indicators. Prior to exceeding pre-EVD forecasted trends for 3 months, we estimate a cumulative loss of −776,110 clinic visits (95% CI: −1,480,896, −101,357, p = 0.030); −24,449 BCG vaccinations (95% CI: −45,947, −2,020, p = 0.032); −9,129 measles vaccinations (95% CI: −12,312, −5,659, p < 0.001); −23,077 first pentavalent vaccinations (95% CI: −47,704, +1,706, p = 0.058); −13,189 first ANC visits (95% CI: −49,765, +23,320, p = 0.482); −7,243 institutional births (95% CI: −15,554, +1,502, p = 0.124); −17,191 PNC visits within 6 weeks (95% CI: −28,344, −5,775, p = 0.002); −101,857 ACT malaria treatments (95% CI: −205,839, −2,139, p = 0.044); −54,549 ARIs treated (95% CI: −111,392, +2,264, p = 0.058); and −15,889 medroxyprogesterone acetate doses (95% CI: −41,066, +9,314, p = 0.232) due to the EVD outbreak (Table 2). When tabulating cumulative system losses compared to pre-EVD forecasted trends through December 2014, all indicators except first ANC visits and medroxyprogesterone acetate doses had statistically significant cumulative losses of system outputs.
All indicators exceeded pre-EVD levels by November 2016 and showed sustained, statistically significant positive trends post-EVD. However, only ACT treatments for malaria had a point estimate of system output change that exceeded zero compared to pre-EVD forecasted trends through December 2016—showing an excess of +78,583 treatments (95% CI: −309,417, +450,661, p = 0.634), although it is important to note that this confidence interval is wide and contains zero. Comparing model-fitted ACT malaria treatments from December 2013 and December 2016, cases significantly increased by +49.2% (95% CI: +33.9%, +64.5%, p < 0.001). Compared to pre-EVD forecasted trends, PNC visits within 6 weeks was the only indicator showing a statistically significant change in outputs through December 2016, showing a loss of −15,144 PNC visits within 6 weeks (95% CI: −29,453, −787, p = 0.040). With the exception of ACT malaria treatments, all other indicators had large negative point estimates for total change in cumulative system outputs through December 2016, although all confidence intervals are large and contain zero (except PNC visits within 6 weeks; Table 2).
Discussion
To our knowledge, this study is the first analytical assessment of public-sector primary healthcare delivery before, during, and after the 2014–2015 EVD outbreak. This study uses data from 7 years of service delivery in Liberia (excluding Montserrado County) to accurately estimate trends before, during, and after the outbreak, as well as forecast system losses attributable to the EVD outbreak. We observed large and significant changes in the delivery of public-sector primary healthcare across Liberia during and after the EVD outbreak. It took only 4 months to lose between 35% and 67% of essential primary care health system outputs across Liberian clinics after the beginning of the EVD outbreak (with the time period of the outbreak defined as June 2014–April 2015). The Liberian health system showed early resilience during the EVD outbreak, with all primary healthcare indicators showing increases from October to December 2014. Unlike findings from recent studies in Guinea [4], our analyses show that, through December 2016, primary healthcare delivery across Liberia has shown significant evidence of recovery from the EVD outbreak. However, due to the large magnitude of health system output losses during the EVD outbreak, there remain estimated net losses of tens of thousands of key childhood vaccinations and essential MCH consultations and hundreds of thousands of clinic visits.
In addition, the EVD outbreak appears to have reversed multiple-year trends of decreases in the number of malaria cases. We hypothesize that the loss of over 100,000 treatments for malaria during the EVD outbreak may have contributed to an excess of malaria cases after the EVD outbreak, and a return to numbers of malaria cases not seen since 2011. Our analyses suggest that malaria cases have increased by almost 50% comparing December 2013 before the EVD outbreak to December 2016. These measurements corroborate previous mathematical models that have hypothesized a large increase in malaria cases due to the disruption of malaria case management in EVD-affected countries [11,12,24]. In addition to the disruption of acute malaria treatment, the observed increase in malaria cases may be partially attributable to interruption of prevention activities (e.g., bednet distribution and utilization programs), as well as an increased fraction of malaria cases being treated post-EVD compared to pre-EVD.
We found that it took 23 months after the beginning of the EVD outbreak, and 11 months after Liberia was declared free of EVD, for health-seeking behavior to return to pre-Ebola levels, leading to a cumulative loss of more than 770,000 clinic visits. This gap in primary care service delivery lasted longer for first ANC visits, PNC visits within 6 weeks, and BCG and first pentavalent vaccinations. While some indicators such as clinic visits, ANC visits, PNC visits, and vaccinations may potentially be “made up” after the EVD epidemic (although deferred care could still be detrimental), other indicators such as institutional births, treatment for episodes of malaria and ARI, and medroxyprogesterone acetate doses that are inherently time-limited cannot be made up through increased access to care post-EVD. In the present paper, we calculated net losses of health system outputs for all 10 primary care indicators, with the caveat that increased access to care for acute and time-limited indicators does not offset the deleterious effects of gaps in treatment access during the EVD outbreak.
These findings suggest the need for the development of best practices, coordinated responses, and larger global investments in public-sector health system strengthening efforts when responding to future global public health emergencies [34]. The emerging evidence from Sierra Leone [2,16,17,22], Guinea [3,4,11,15], and Liberia ([6–10] and our study) suggests that, in terms of morbidity and mortality, the collateral effects from the EVD outbreak on public-sector primary healthcare delivery will greatly exceed the direct effects from EVD infection. Analyses using population-based surveys in Liberia suggest that distrust of the government and the health system was the primary source of reduced health service demand during the EVD outbreak, rather than supply-side factors [29]. Thus, during future health system emergencies, policymakers should address demand-side factors during periods of crisis. In addition, sustained and long-term investments in public-sector health system strengthening is needed to ensure that EVD-affected countries have the resilience to detect, treat, and eradicate future emerging epidemics prior to large-scale spread, all while maintaining the delivery of life-saving public-sector primary healthcare.
Prior to the EVD outbreak, Liberia had one of the highest rates of maternal mortality in the world, with a rate of 1,072 deaths per 100,000 live births according to the 2013 Demographic and Health Survey (DHS) [32]—representing an 8% increase from 2007 DHS estimates [35]. Nationwide, maternal deaths are estimated to represent 38% of all deaths to women aged 15–49 years [32]. As of 2013, community-level estimates of institutional birth coverage (56%) and use of any modern contraceptive method (21%) remained low [32]. For these reasons, it was positive to document the large increases in institutional births (+92%) and medroxyprogesterone acetate doses (+109%) from 2010 to 2014 in our study. These increases are corroborated by community survey data showing a more than 50% increase in institutional births and a 130% increase in injectable contraceptive use from 2007 to 2013 [32,35]. Given these successes, it is especially concerning to see the loss of 7,243 institutional births, along with gaps in other essential MCH services (estimated losses of 13,189 first ANC visits, 17,191 PNC visits within 6 weeks, and 15,889 medroxyprogesterone acetate doses), that occurred during the EVD outbreak, all of which continue to have point estimates of net losses in system outputs through December 2016, over 20 months post-EVD. However, it is important to note that PNC visits within 6 weeks is the only indicator with a confidence interval of lost system outputs through December 2016 that does not contain zero.
The loss of medroxyprogesterone acetate doses may have lasting negative impacts on MCH across Liberia as unintended pregnancies are linked to elevated risks of low birth weight, child malnutrition and mortality, and maternal mortality [36]. The disruption of access to long-acting reversible contraception during the EVD outbreak could also partially explain the observed increases in recorded births post-EVD [37]. The slow recovery of first ANC visits and PNC visits to pre-EVD levels may warrant targeted interventions, especially considering the persistent gaps in PNC coverage pre-EVD [32], as well as the essential role that first ANC visits play in the health of mother and child. Given the near universal coverage (>95%) of at least 1 ANC visit nationwide [32], the observed decreases in first ANC visits before the EVD outbreak could at least partially reflect declining total fertility rates [32], although we hypothesize that the majority of this decrease is due to improved routine data management, such as better tracking of repeat ANC visits. A recent study in the capital city of Monrovia (which was excluded from the present analyses) showed that during the EVD outbreak, deliveries in public clinics decreased dramatically and were substituted by a similar magnitude increase in deliveries in private clinics [30].
In regards to child vaccination, prior to the EVD outbreak, reported numbers of BCG, first pentavalent, and measles vaccinations were relatively stable, with some decreases also hypothesized to be due to decreasing fertility rates. The EVD outbreak led to large losses in vaccination outputs, leaving young children at significant risk for infection with life-threatening illnesses, as well as potentially putting adults at risk through the breakdown of community-level herd immunity. Overall, we recorded significant and persistent net losses of child vaccinations that continue to number over 20,000 for BCG, 14,000 for first pentavalent, and 3,200 for measles, although, again, these are point estimates, and confidence intervals around these forecasts as of December 2016 contain zero. In the short term, significant efforts should be launched across EVD-affected countries to ensure that coverage of all essential child vaccinations reaches the minimum levels necessary to maintain herd immunity. In the longer term, system strengthening efforts are needed to ensure that routine immunization activities can maintain high levels of coverage in the post-EVD environment across West Africa. Our finding that it took only 7 months (June–December 2014) to accumulate more than 12,000 lost BCG vaccinations, 9,000 lost measles vaccinations, and 12,000 lost first pentavalent vaccinations suggests that during future public health emergencies, significant and rapid efforts must be made to maintain the delivery of essential child vaccinations in public-sector primary care even during the most challenging times.
Our study has several important limitations. First, due to inconsistent indicators in the national RHIS, we were unable to include any HIV or tuberculosis data in the present analyses. Second, Montserrado County was excluded from this study, which limits generalizability and means that the calculated system losses due to EVD are likely an underestimate. Third, these analyses relied on aggregate RHIS data that have not undergone systematic or large-scale data quality audits, and thus we cannot confirm the consistency, reliability, or validity of these data. We found some small increases in the amount of missing data during the first 4 months of the EVD epidemic compared to the 5 months just previous to the EVD epidemic—however, there were also some indicators that had no changes in missingness. Without knowledge of data quality over time pre - and post-EVD, it is likely that the health system disruption during the EVD outbreak may have caused some bias in the effect sizes presented in this study. Future studies could attempt to understand how the EVD outbreak affected RHIS data quality to inform use of RHIS data to track future epidemics or health system emergencies. Fourth, our assessment of system outputs did not quantify potential changes in the quality of care provided before, during, and after the EVD outbreak, including disruptions in essential supplies, medicines, reagents, and staff. Last, given the scope of this paper, we were unable to analyze facility - or county-level factors that may have influenced changes in system outputs. This is an area that could be examined in future studies.
Despite these limitations, our study has some notable strengths. We analyzed RHIS data at the facility level, using robust statistical methods and flexible time trends to accurately estimate the functional forms of reductions in health services due to the EVD outbreak. In addition, we used 7 years of data across a census of all public-sector MoH facilities in Liberia outside Montserrado County, resulting in a database of over 30,000 facility-month observations. We analyzed multiple nonoverlapping essential primary healthcare indicators, all of which had relatively low rates of missing data and limited changes in missing data patterns over the 7-year period. These analyses serve as an example of the value of RHIS data for rapidly and effectively tracking health system performance in low - and middle-income countries [38].
In summary, there were rapid and significant disruptions to public-sector primary healthcare delivery during and immediately after the EVD outbreak in Liberia, with system losses of 36% to 67% of pre-EVD levels. The Liberian health system showed early signs of resilience during and after the EVD outbreak, but not before accruing large gaps in essential primary care service delivery. As of November 2016, all indicators tracked have recovered to pre-EVD levels, although large net losses likely exist for essential childhood vaccinations, maternal health services, and primary care visits. Due to the disruption of malaria case management during the EVD outbreak, malaria cases have rebounded from steady decreases pre-EVD to an increasing trend and 50% higher caseloads in December 2016 compared to December 2013. More than 20 months after Liberia was declared free of EVD, persistent gaps in public-sector health service delivery continue due to lingering effects from the EVD outbreak. During future public health emergencies, funding should be explicitly allocated to maintain public-sector primary healthcare delivery and to promote recovery of systems functioning post-emergency. RHIS data should be considered an essential tool to track future epidemics and health system emergencies in real time and should receive more funding, attention, and use. Sustained investments in public-sector health system strengthening are needed across EVD-affected countries to close gaps in primary care that occurred during the EVD outbreak, and to build resilient primary healthcare systems capable of mitigating collateral effects of the next emerging epidemic.
Supporting Information
Zdroje
1. World Health Organization. Situation report: Ebola virus disease—10 June 2016. Geneva: World Health Organization; 2016 [cited 2017 Apr 5]. Available from: http://apps.who.int/iris/bitstream/10665/208883/1/ebolasitrep_10Jun2016_eng.pdf?ua=1.
2. Brolin Ribacke KJ, Saulnier DD, Eriksson A, von Schreeb J. Effects of the West Africa Ebola virus disease on health-care utilization—a systematic review. Front Public Health. 2016;4 : 222. doi: 10.3389/fpubh.2016.00222 27777926
3. Camara BS, Delamou A, Diro E, Béavogui AH, El Ayadi AM, Sidibé S, et al. Effect of the 2014/2015 Ebola outbreak on reproductive health services in a rural district of Guinea: an ecological study. Trans R Soc Trop Med Hyg. 2017;111(1):22–9. doi: 10.1093/trstmh/trx009 28340207
4. Delamou A, Ayadi AM El, Sidibe S, Delvaux T, Camara BS, Sandouno SD, et al. Effect of Ebola virus disease on maternal and child health services in Guinea: a retrospective observational cohort study. Lancet Glob Health. 2017;5(4):e448–57. doi: 10.1016/S2214-109X(17)30078-5 28237252
5. Sesay T, Denisiuk O, Shringarpure K, Wurie B, George P, Sesay M, et al. Paediatric care in relation to the 2014–2015 Ebola outbreak and general reporting of deaths in Sierra Leone. Public Health Action. 2017;7(Suppl 1):S34–9. doi: 10.5588/pha.16.0088 28744437
6. Shannon F, Horace-Kwemi E, Najjemba R, Owiti P, Edwards J, Shringarpure K, et al. Effects of the 2014 Ebola outbreak on antenatal care and delivery outcomes in Liberia: a nationwide analysis. Public Health Action. 2017;7(Suppl 1):S88–93. doi: 10.5588/pha.16.0099 28744445
7. Wesseh C, Najjemba R, Edwards J, Owiti P, Tweya H, Bhat P. Did the Ebola outbreak disrupt immunisation services? Public Health Action. 2017;7(Suppl 1):S82–7. doi: 10.5588/pha.16.0104 28744444
8. Dunbar N, Richards E, Woldeyohannes D, Van den Bergh R, Wilkinson E, Tamang D, et al. Knockdown and recovery of malaria diagnosis and treatment in Liberia during and after the 2014 Ebola outbreak. Public Health Action. 2017;7(Suppl 1):S76–81. doi: 10.5588/pha.16.0100 28744443
9. Jacobs G, Bhat P, Owiti P, Edwards J, Tweya H, Najjemba R. Did the 2014 Ebola outbreak in Liberia affect HIV testing, linkage to care and ART initiation? Public Health Action. 2017;7(Suppl 1):S70–5. doi: 10.5588/pha.16.0101 28744442
10. Konwoloh P, Cambell C, Ade S, Bhat P, Harries A, Wilkinson E, et al. Influence of Ebola on tuberculosis case finding and treatment outcomes in Liberia. Public Health Action. 2017;7(Suppl 1):S62–9. doi: 10.5588/pha.16.0097 28744441
11. Plucinski MM, Guilavogui T, Sidikiba S, Diakite N, Diakite S, Dioubate M, et al. Effect of the Ebola-virus-disease epidemic on malaria case management in Guinea, 2014: a cross-sectional survey of health facilities. Lancet Infect Dis. 2015;15(9):1017–23. doi: 10.1016/S1473-3099(15)00061-4 26116183
12. Walker PGT, White MT, Griffin JT, Reynolds A, Ferguson NM, Ghani AC. Malaria morbidity and mortality in Ebola-affected countries caused by decreased health-care capacity, and the potential effect of mitigation strategies: a modelling analysis. Lancet Infect Dis. 2015;15(7):825–32. doi: 10.1016/S1473-3099(15)70124-6 25921597
13. Helleringer S, Noymer A. Assessing the direct effects of the Ebola outbreak on life expectancy in Liberia, Sierra Leone and Guinea. PLoS Curr. 2015 Feb 19. doi: 10.1371/currents.outbreaks.01a99f8342b42a58d806d7d1749574ea 25737805
14. Mohammed A, Sheikh TL, Gidado S, Poggensee G, Nguku P, Olayinka A, et al. An evaluation of psychological distress and social support of survivors and contacts of Ebola virus disease infection and their relatives in Lagos, Nigeria: a cross sectional study—2014. BMC Public Health. 2015;15(1):824.
15. Barden-O’Fallon J, Barry M, Brodish P, Hazerjian J. Rapid assessment of Ebola-related implications for reproductive, maternal, newborn, and child health service delivery and utilization in Guinea. PLoS Curr. 2015 Aug 4. doi: 10.1371/currents.outbreaks.0b0ba06009dd091bc39ddb3c6d7b0826 26331094
16. Elston JWT, Moosa AJ, Moses F, Walker G, Dotta N, Waldman RJ, et al. Impact of the Ebola outbreak on health systems and population health in Sierra Leone. J Public Health (Oxf). 2016;38(4):673–8.
17. Brolin Ribacke KJ, Van Duinen AJ, Nordenstedt H, Hoijer J, Molnes R, Froseth TW, et al. The impact of the West Africa Ebola outbreak on obstetric health care in Sierra Leone. PLoS ONE. 2016;11(2):e0150080. doi: 10.1371/journal.pone.0150080 26910462
18. Loubet P, Mabileau G, Baysah M, Nuta C, Taylor M, Jusu H, et al. Likely effect of the 2014 Ebola epidemic on HIV care in Liberia. AIDS. 2015;29(17):2347–51. doi: 10.1097/QAD.0000000000000821 26544705
19. Tattevin P, Baysah MK, Raguin G, Toomey J, Chapplain J-M, Taylor ME, et al. Retention in care for HIV-infected patients in the eye of the Ebola storm: lessons from Monrovia, Liberia. AIDS. 2015;29(6):N1–2. doi: 10.1097/QAD.0000000000000614 25849843
20. Ly J, Sathananthan V, Griffiths T, Kanjee Z, Kenny A, Gordon N, et al. Facility-based delivery during the Ebola virus disease epidemic in rural Liberia: analysis from a cross-sectional, population-based household survey. PLoS Med. 2016;13(8):e1002096. doi: 10.1371/journal.pmed.1002096 27482706
21. Lori JR, Rominski SD, Perosky JE, Munro ML, Williams G, Bell SA, et al. A case series study on the effect of Ebola on facility-based deliveries in rural Liberia. BMC Pregnancy Childbirth. 2015;15 : 254. doi: 10.1186/s12884-015-0694-x 26459295
22. Bolkan HA, Bash-Taqi DA, Samai M, Gerdin M, von Schreeb J. Ebola and indirect effects on health service function in Sierra Leone. PLoS Curr. 2014 Dec 19. doi: 10.1371/currents.outbreaks.0307d588df619f9c9447f8ead5b72b2d 25685617
23. Iyengar P, Kerber K, Howe C, Dahn B. Services for mothers and newborns during the Ebola outbreak in Liberia: the need for improvement in emergencies. PLoS Curr. 2015 Apr 16. doi: 10.1371/currents.outbreaks.4ba318308719ac86fbef91f8e56cb66f 25932347
24. Parpia AS, Ndeffo-mbah ML, Wenzel NS, Galvani AP. Effects of response to 2014–2015 Ebola outbreak on deaths from malaria, HIV/AIDS, and tuberculosis, West Africa. Emerg Infect Dis. 2016;22(3):433–41. doi: 10.3201/eid2203.150977 26886846
25. Venkatramanan S, Lewis B, Chen J, Higdon D, Vullikanti A, Marathe M. Using data-driven agent-based models for forecasting emerging infectious diseases. Epidemics. 2017 Feb 22. doi: 10.1016/j.epidem.2017.02.010 28256420
26. Chowell G, Viboud C, Simonsen L, Merler S, Vespignani A. Perspectives on model forecasts of the 2014–2015 Ebola epidemic in West Africa: lessons and the way forward. BMC Med. 2017;15(1):42. doi: 10.1186/s12916-017-0811-y 28245814
27. Khaleque A, Sen P. An empirical analysis of the Ebola outbreak in West Africa. Sci Rep. 2017;7 : 42594. doi: 10.1038/srep42594 28205617
28. Althaus CL, Low N, Musa EO, Shuaib F, Gsteiger S. Ebola virus disease outbreak in Nigeria: transmission dynamics and rapid control. Epidemics. 2015;11 : 80–4. doi: 10.1016/j.epidem.2015.03.001 25979285
29. Morse B, Grépin KA, Blair RA, Tsai L. Patterns of demand for non-Ebola health services during and after the Ebola outbreak: panel survey evidence from Monrovia, Liberia. BMJ Glob Health. 2016;1:e000007. doi: 10.1136/bmjgh-2015-000007 28588907
30. Gizelis T, Karim S, Østby G, Urdal H. Maternal health care in the time of Ebola: a mixed-method exploration of the impact of the epidemic on delivery services in Monrovia. World Dev. 2017;98(2014):169–78.
31. Evans DK, Goldstein M, Popova A. Health-care worker mortality and the legacy of the Ebola epidemic. Lancet Glob Health. 2015;3:e439–40. doi: 10.1016/S2214-109X(15)00065-0 26163833
32. Liberia Institute of Statistics and Geo-Information Services, Ministry of Health and Social Welfare, National AIDS Control Program, ICF International. Liberia Demographic and Health Survey 2013. Monrovia: Liberia Institute of Statistics and Geo-Information Services; 2014.
33. King G, Tomz M, Wittenberg J. Making the most of statistical analyses: improving interpretation and presentation. Am J Pol Sci. 2000;44(2):341–55.
34. Moon S, Leigh J, Woskie L, Checchi F, Dzau V, Fallah M, et al. Post-Ebola reforms: ample analysis, inadequate action. BMJ. 2017;280:j280.
35. Liberia Institute of Statistics and Geo-Information Services, Ministry of Health and Social Welfare, National AIDS Control Program, Macro International. Liberia Demographic and Health Survey 2007. Monrovia: Liberia Institute of Statistics and Geo-Information Services; 2008.
36. Tsui AO, McDonald-Mosley R, Burke AE. Family planning and the burden of unintended pregnancies. Epidemiol Rev. 2010;32(1):152–74.
37. McBain RK, Wickett E, Mugunga JC, Beste J, Konwloh P, Mukherjee J. The post-Ebola baby boom: time to strengthen health systems. Lancet. 2016;388(10058):2331–3. doi: 10.1016/S0140-6736(16)31895-5 27845079
38. Wagenaar BH, Sherr K, Fernandes QF, Wagenaar AC. Using routine health information systems for well-designed health evaluations in low and middle-income countries. Health Policy Plan. 2015;31(1):129–35. doi: 10.1093/heapol/czv029 25887561
Štítky
Interní lékařství
Článek vyšel v časopisePLOS Medicine
Nejčtenější tento týden
2018 Číslo 2- Berberin: přírodní hypolipidemikum se slibnými výsledky
- Léčba bolesti u seniorů
- Příznivý vliv Armolipidu Plus na hladinu cholesterolu a zánětlivé parametry u pacientů s chronickým subklinickým zánětem
- Červená fermentovaná rýže účinně snižuje hladinu LDL cholesterolu jako vhodná alternativa ke statinové terapii
- Jak postupovat při výběru betablokátoru − doporučení z kardiologické praxe
-
Všechny články tohoto čísla
- Setbacks in Alzheimer research demand new strategies, not surrender
- Impact of person-centred care training and person-centred activities on quality of life, agitation, and antipsychotic use in people with dementia living in nursing homes: A cluster-randomised controlled trial
- Susceptibility of to azithromycin and ceftriaxone in China: A retrospective study of national surveillance data from 2013 to 2016
- Population impact of lung cancer screening in the United States: Projections from a microsimulation model
- Prevalence of sexually transmitted infections among young people in South Africa: A nested survey in a health and demographic surveillance site
- The potential impact of case-area targeted interventions in response to cholera outbreaks: A modeling study
- Perfluoroalkyl substances and changes in body weight and resting metabolic rate in response to weight-loss diets: A prospective study
- The 2014–2015 Ebola virus disease outbreak and primary healthcare delivery in Liberia: Time-series analyses for 2010–2016
- Prevalence of sexually transmitted infections and bacterial vaginosis among women in sub-Saharan Africa: An individual participant data meta-analysis of 18 HIV prevention studies
- Preventing cholera outbreaks through early targeted interventions
- Diet during pregnancy and infancy and risk of allergic or autoimmune disease: A systematic review and meta-analysis
- Risk and surrogate benefit for pediatric Phase I trials in oncology: A systematic review with meta-analysis
- PLOS Medicine
- Archiv čísel
- Aktuální číslo
- Informace o časopisu
Nejčtenější v tomto čísle- The potential impact of case-area targeted interventions in response to cholera outbreaks: A modeling study
- Prevalence of sexually transmitted infections among young people in South Africa: A nested survey in a health and demographic surveillance site
- Susceptibility of to azithromycin and ceftriaxone in China: A retrospective study of national surveillance data from 2013 to 2016
- Perfluoroalkyl substances and changes in body weight and resting metabolic rate in response to weight-loss diets: A prospective study
Kurzy
Zvyšte si kvalifikaci online z pohodlí domova
Současné možnosti léčby obezity
nový kurzAutoři: MUDr. Martin Hrubý
Všechny kurzyPřihlášení#ADS_BOTTOM_SCRIPTS#Zapomenuté hesloZadejte e-mailovou adresu, se kterou jste vytvářel(a) účet, budou Vám na ni zaslány informace k nastavení nového hesla.
- Vzdělávání


