-
Články
Top novinky
Reklama- Vzdělávání
- Časopisy
Top články
Nové číslo
- Témata
Top novinky
Reklama- Videa
- Podcasty
Nové podcasty
Reklama- Kariéra
Doporučené pozice
Reklama- Praxe
Top novinky
ReklamaPredicting the Epidemic Sizes of Influenza A/H1N1, A/H3N2, and B: A Statistical Method
Background:
The epidemic sizes of influenza A/H3N2, A/H1N1, and B infections vary from year to year in the United States. We use publicly available US Centers for Disease Control (CDC) influenza surveillance data between 1997 and 2009 to study the temporal dynamics of influenza over this period.Methods and Findings:
Regional outpatient surveillance data on influenza-like illness (ILI) and virologic surveillance data were combined to define a weekly proxy for the incidence of each strain in the United States. All strains exhibited a negative association between their cumulative incidence proxy (CIP) for the whole season (from calendar week 40 of each year to calendar week 20 of the next year) and the CIP of the other two strains (the complementary CIP) from the start of the season up to calendar week 2 (or 3, 4, or 5) of the next year. We introduce a method to predict a particular strain's CIP for the whole season by following the incidence of each strain from the start of the season until either the CIP of the chosen strain or its complementary CIP exceed certain thresholds. The method yielded accurate predictions, which generally occurred within a few weeks of the peak of incidence of the chosen strain, sometimes after that peak. For the largest seasons in the data, which were dominated by A/H3N2, prediction of A/H3N2 incidence always occurred at least several weeks in advance of the peak.Conclusion:
Early circulation of one influenza strain is associated with a reduced total incidence of the other strains, consistent with the presence of interference between subtypes. Routine ILI and virologic surveillance data can be combined using this new method to predict the relative size of each influenza strain's epidemic by following the change in incidence of a given strain in the context of the incidence of cocirculating strains.
: Please see later in the article for the Editors' Summary
Published in the journal: . PLoS Med 8(7): e32767. doi:10.1371/journal.pmed.1001051
Category: Research Article
doi: https://doi.org/10.1371/journal.pmed.1001051Summary
Background:
The epidemic sizes of influenza A/H3N2, A/H1N1, and B infections vary from year to year in the United States. We use publicly available US Centers for Disease Control (CDC) influenza surveillance data between 1997 and 2009 to study the temporal dynamics of influenza over this period.Methods and Findings:
Regional outpatient surveillance data on influenza-like illness (ILI) and virologic surveillance data were combined to define a weekly proxy for the incidence of each strain in the United States. All strains exhibited a negative association between their cumulative incidence proxy (CIP) for the whole season (from calendar week 40 of each year to calendar week 20 of the next year) and the CIP of the other two strains (the complementary CIP) from the start of the season up to calendar week 2 (or 3, 4, or 5) of the next year. We introduce a method to predict a particular strain's CIP for the whole season by following the incidence of each strain from the start of the season until either the CIP of the chosen strain or its complementary CIP exceed certain thresholds. The method yielded accurate predictions, which generally occurred within a few weeks of the peak of incidence of the chosen strain, sometimes after that peak. For the largest seasons in the data, which were dominated by A/H3N2, prediction of A/H3N2 incidence always occurred at least several weeks in advance of the peak.Conclusion:
Early circulation of one influenza strain is associated with a reduced total incidence of the other strains, consistent with the presence of interference between subtypes. Routine ILI and virologic surveillance data can be combined using this new method to predict the relative size of each influenza strain's epidemic by following the change in incidence of a given strain in the context of the incidence of cocirculating strains.
: Please see later in the article for the Editors' SummaryIntroduction
Influenza epidemics in temperate latitudes are usually characterized by the dominance of influenza B or one of two influenza A subtypes, A/H3N2 and A/H1N1. There are currently no formal methods to predict which type or subtype (henceforth referred to in this article as “strain”) will dominate in a given season or what the epidemic size of each strain might be. This paper examines how routine surveillance data collected during the course of an influenza season can be used to make predictions for that season. We also investigate whether there is support for the hypothesis that the dynamics of different strains are interdependent, and specifically whether high incidence of one strain interferes with the circulation of other strains within a season.
Previous epidemiological studies have suggested that subtypes of influenza A, and potentially influenza A and influenza B, might compete with each other. Sonoguchi and colleagues [1] studied the impact of the same-season circulation of A/H3N2 and A/H1N1 influenza in Japanese schools and concluded that infection with A/H3N2 was negatively associated with subsequent infection with A/H1N1. Cowling et al. [2] have found that those infected with seasonal influenza A during the 2008–2009 season in Hong Kong had a lower risk of laboratory-confirmed pandemic A/H1N1 infection. Ferguson et al. [3] and Tria et al. [4] concluded that strong, transient, nonspecific immunity effective against all influenza strains was necessary to produce realistic patterns of sequence diversity in simulations of influenza A and B evolution. Cobey and colleagues (personal communication) found evidence of cross-immunity between influenza A/H3N2, A/H1N1, and B in St. Petersburg, Russia. Skowronski et al. [5] found that people vaccinated against seasonal influenza in 2008–2009 were more likely to get infected in the subsequent wave of A/pandemic (H1N1) 2009 (H1N1pdm) compared to individuals who have not received seasonal influenza vaccination, an effect that may have been caused in part by reduced risk of seasonal influenza infection (owing to receipt of seasonal influenza vaccine), and hence reduced cross-subtype immunity.
In this study, US Centers for Disease Control (CDC) data between 1997 and 2009 retrieved from a publicly available database [6] were examined for epidemiological evidence of interaction in the dynamics of the three influenza strains that circulated prior to the 2009 pandemic, A/H3N2, A/H1N1, and B. We utilized two components of the CDC influenza surveillance system: virologic surveillance and outpatient ILI surveillance, described in the Methods and in more detail in [7]. For each season, we defined a proxy for strain-specific incidence (henceforth simply “incidence”) of each strain and defined the cumulative incidence proxy (CIP) for any strain at a given time as the sum of its incidence proxy since the start of the season—see the first section of the Methods for the precise definition and the discussion of its potential limitations. For every chosen (index) strain, the “complementary” CIP was defined as the sum of the CIPs of the other two strains. The index strain's CIP for the whole season and the complementary CIP early in the season were found to be negatively correlated. In particular, for each index strain, the seasons with the largest early complementary CIP were also the seasons with the smallest whole-season CIP, which is a proxy of the strain's epidemic size. This finding naturally leads to two questions: First, is there a threshold for the complementary CIP that predicts a small epidemic for the index strain? Second, if this complementary CIP threshold isn't reached, how does one predict the epidemic size of the index strain? This paper introduces a method for making these predictions. The approach is to follow the incidence of each strain from the start of a season until either the CIP of the index strain or the complementary CIP surpass certain thresholds that are delineated in this study. Once the threshold is reached, the CIP of the index strain for the whole season is predicted in terms of its recent incidence and the time that the threshold is reached. Historical data [6] were used to estimate the prediction parameters as well as the accuracy and timing of predictions.
Methods
Strain-Specific Incidence
Data from [6] for the 12 influenza seasons from 1997–1998 to 2008–2009 were used in the analysis. These data are based on two components of the CDC influenza surveillance system: virologic surveillance and outpatient ILI surveillance [7]. Virologic surveillance utilizes data from approximately 80 U.S. World Health Organization (WHO) Collaborating Laboratories and 60 National Respiratory and Enteric Virus Surveillance System (NREVSS) laboratories (which are mostly hospital laboratories) located throughout the United States. The U.S. WHO and NREVSS collaborating laboratories report the total number of respiratory specimens tested and the number positive for influenza types A and B each week. Most of the U.S. WHO collaborating laboratories also report the influenza A subtype (H1 or H3) of the viruses they have isolated. For the ILI surveillance network, each week approximately 1,800 outpatient care sites around the country report data on the total number of patients seen and the number of those patients with ILI by age group. For this system, ILI is defined as fever (temperature of 37.8°C or greater) and a cough and/or a sore throat in the absence of a known cause other than influenza.
Each influenza season was defined as the time between week 40 of one calendar year (epidemiological week 1 in our notation) and week 20 of the next calendar year (epidemiological week 33). The emergence of pandemic A/H1N1 in the 2008–2009 season changed testing and reporting patterns starting in calendar week 17. Therefore, the ending time of the 2008–2009 season was defined to be calendar week 16 of 2009.
We defined a proxy of weekly strain-specific incidence in the United States. For each of the ten regions defined by the US Department of Health and Human Services [6], the proxy for incidence was defined as the product of the proportion of ILI among all outpatient visits to sentinel physicians and the proportion of respiratory viral isolates tested that were positive for a particular strain [6]. For some influenza A isolates, subtyping was not performed. For those samples, the share of A/H1N1 and A/H3N2 was assumed to be proportional to their share among the subtyped strains. The national proxy for incidence was calculated as the sum of the regional proxies weighted by the regions' population sizes. The size of the regional population for each season between calendar years X and X+1 was estimated as the mean of the regional population estimates for July 1 for those years from census data [8].
This proxy would be a perfect measure (up to a multiplicative constant) of the incidence of infection with a particular strain if the following conditions were met: (i) the fraction of ILIs that result in medical consultations, while possibly varying by strain, does not vary by year or by week; (ii) the numbers of physician visits for all causes in the sentinel practices were consistent from week to week during the season; (iii) the sentinel practices were representative of the full population; and (iv) viral testing, which is conducted in a separate system, was performed on isolates representative of those obtained from patients consulting the sentinel practices for ILI. In reality, none of these assumptions is fully accurate; in particular, samples are selected for testing on the basis of severity of ILI, as well as a part of routine sampling. Nonetheless, we take this proxy measure as the best relative measure of influenza strain-specific incidence that can be calculated from surveillance data.
Association between the Early Activity of Other Strains and the Total Activity of Each Strain of Interest
To measure patterns in the observations, for each index strain, the complementary CIP up to each of several possible calendar weeks was compared to the CIP of the index strain for the entire influenza season. We examine the Spearman rank correlation between those pairs of numbers (i.e., complementary CIP up to a defined week and the whole season CIP of the index strain) for each calendar week for the 12 seasons in the data.
If circulation of each strain results in interference with the others, then such a negative correlation could arise by two mechanisms. First, high complementary incidence could slow the spread of the index strain. Second, large seasons of an index strain may begin early, interfering with the spread of the complementary strains by the chosen calendar week. We attempt in Text S1 to disentangle these two mechanisms.
Prediction Model for Cumulative Incidence of a Strain
Given the observed inverse association between the early complementary CIP and the whole-season CIP of each index strain (described in the early part of the Results section, below), we hypothesized that it would be possible to create a prediction algorithm for the whole-season CIP of each strain. We considered a model in which a prediction is triggered when the CIP of either the index strain or the complementary strains reaches a particular threshold. The week at which this threshold is crossed naturally varies from season to season, and the thresholds for the index strain and the complementary strains are allowed to differ. The first time a threshold is reached, the whole-season CIP of the index strain is predicted linearly in terms of a proxy X of the index strain's recent growth rate as well as the (weighted) time T of crossing the threshold.
More precisely, one follows the incidence of each strain in time from the start of a season until either the cumulative incidence of the index strain in the previous 5 wk surpasses a certain threshold h or the complementary CIP from the start of a season surpasses a certain threshold hc (both h and hc vary by index strain as the different strains have quite different distributions of epidemic sizes). The time at which one of these conditions is first met is the “stopping time” s. At time s, the whole-season CIP of the index strain is predicted. Denoting the index strain's incidence in week w as I(w), the proxy for recent growth is(1)
To elucidate the meaning of the predictor in equation (1), note that if the index strain's CIP reaches its threshold, h, first (before the complementary CIP reaches its threshold, hc) during a period of positive growth, then X is related to the recent growth rate of the index strain. If the index strain's CIP reaches its threshold first but during a period of no growth or decline, both the covariate X and index strain's whole-season CIP, which is the outcome Y, are expected to be smaller compared to the former scenario. If the complementary CIP reaches its threshold first, both the covariate X and the outcome Y are expected to be smaller compared to the two scenarios above.
For influenza B and A/H1N1, thresholds can be chosen so that the covariate X is highly correlated with the outcome Y and the linear regression of Y against X has no outliers (Text S1, section 8). However for influenza A/H3N2, the 2003–2004 season was especially large and early and is an outlier for such regression. That season was driven by the antigenically novel A/Fujian-like strain, which presumably had a larger pool of susceptibles than previous A/H3N2 strains, ensuring an early, strong season. In particular the threshold for the 2003–2004 season was crossed on calendar week 46—4 wk earlier than in any other season. The rate of transmission of a strain of influenza is affected not only by its antigenic novelty but also by seasonal forcing [9],[10]. Correspondingly, the covariate X on week 46 in 2003, being a function of the incidence's growth rate at that time, underestimates the cumulative size of A/H3N2 incidence during that year relative to other years. Similarly, for the 2010–2011 season, the proxy of influenza B incidence crossed its threshold exceptionally early compared to the 1997–2009 seasons, and prediction based on the covariate X alone is expected to significantly underestimate the whole-season CIP for influenza B for 2010–2011.
To adjust for the above phenomenon of an early crossing of the index strain's threshold h, we tested a set of models containing an additional predictor T to help explain how the threshold h relates to a strain's epidemic size. As described in Text S1, the best-performing model in this set uses a definition of T that differs for A/H3N2 versus A/H1N1 and influenza B. For A/H3N2, T equals the week s in which the threshold is crossed. For A/H1N1 and influenza B, T equals the week s in which the threshold is crossed, unless the index strain's season is small. The season is defined to be “small” if by week s, the cumulative incidence of the index strain is less than h; in this case, the covariate T is set to 0. For each strain, the predictor T is negatively associated with the outcome Y, reflecting the fact that an index strain that crosses its threshold h early in the season will have a larger epidemic. To understand the motivation behind this definition of T, we note that for A/H3N2, seasons in which the complementary threshold is crossed first are generally associated with later stopping times, and the week s ( = T) of crossing is negatively correlated with the epidemic size of A/H3N2 (outcome Y). For A/H1N1 and B, a high complementary CIP early in the season implies that the complementary threshold was crossed before the CIP threshold of the index strain, and the timing of such crossing is positively correlated with the outcome Y. For such seasons, which, in addition, have “small” CIP of the index strain since the beginning of the season (as defined above), the covariate T is set to 0.
With the covariates X and T defined above, the CIP Y is estimated by(2)The coefficients in the linear prediction above were estimated by ordinary least squares from the historical data in [6]. For influenza A/H1N1 and B, the intercept β0 was not found to be statistically significant. This result is not surprising, given that for strong complementary seasons for those strains, both the outcome and the covariates are quite small. This intercept was therefore not used in the linear regression.
A basic measure of the accuracy of the prediction given by equation (2) is the residual standard error (RSE)(3)Here Yi are the observed outcomes, are the predicted outcomes and DF is the number of degrees of freedom. We chose the thresholds h and hc for each strain by visually inspecting the RSEs for a wide range of thresholds (Text S1, figure S6) and determining the space of thresholds where RSE is low and stable.
Sensitivity Analysis
We performed extensive sensitivity analyses on the parameters used for prediction and the associations between the CIPs of various strains (Text S1).
Results
Trends in Incidence and the Association between the Epidemic Size of an Index Strain and the Early Complementary Cumulative Incidence
The weekly incidence proxies of each strain show clear differences from season to season (Figure 1). In most seasons, A/H3N2 has the highest incidence proxy in every week, and B and A/H1N1 were comparatively scarce. In three seasons, the trend is partially reversed: A/H1N1 and B are more prevalent than A/H3N2 in 2000–2001, 2002–2003, and 2008–2009. In 2006–2007, the incidence of A/H1N1 was distinctly higher than that of A/H3N2 and B.
Fig. 1. Weekly incidence proxies of A/H3N2 (green), A/H1N1 (blue), and influenza B (red) strains inferred from <em class="ref">[<b>6</b>]</em>. ![Weekly incidence proxies of A/H3N2 (green), A/H1N1 (blue), and influenza B (red) strains inferred from <em class="ref">[<b>6</b>]</em>.](https://www.prolekarniky.cz/media/cache/resolve/media_object_image_small/media/image/a20f2ea04d235af662cb122696e5d25e.png)
There is a negative correlation between the complementary CIP early in the season and the whole-season CIP of the index strain. This relation is significant for index strains A/H1N1 and A/H3N2 for each of the calendar weeks 2, 3, 4, and 5; for index strain B, this relation is significant only for calendar week 2. The relation between the complementary CIP by calendar week 3 and the index strain's whole-season CIP is plotted in Figure 2.
Fig. 2. The relationship between the cumulative complementary incidence for each of the index strains A/H1N1 (A), A/H3N2 (B), and B (C) by epidemiological week 16 (calendar week 3) and the index strain's cumulative incidence over the entire season (i.e., its epidemic size) for the 12 y in the data. 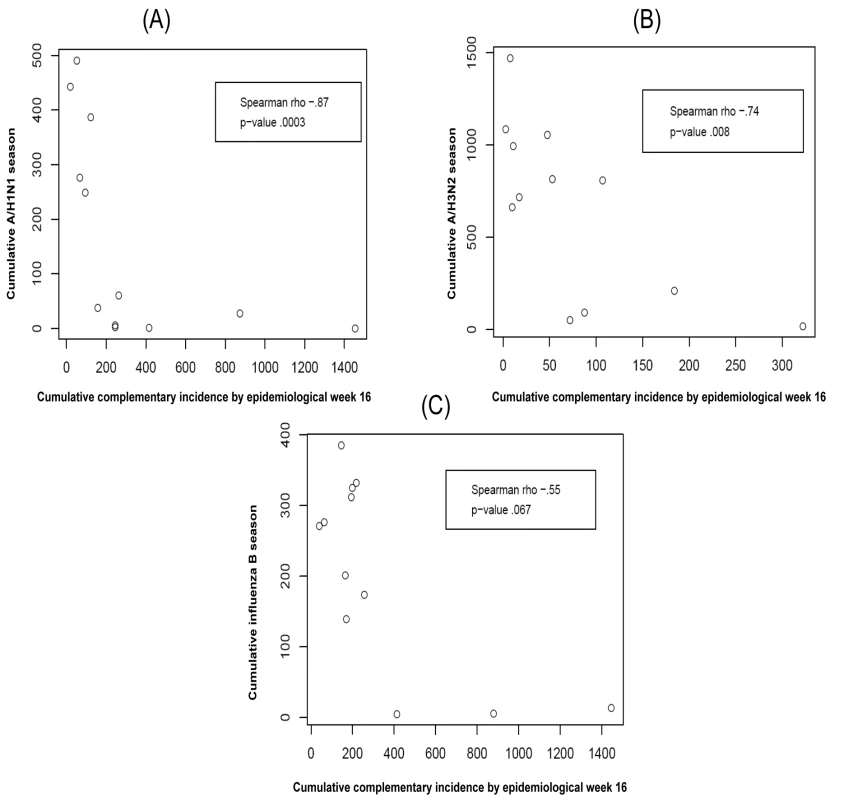
Though the association for influenza B was not statistically significant the three seasons in which complementary CIP was highest for B had the three smallest whole-season CIP for B.
Prediction of the Epidemic Size of Each Strain
This section presents prediction results for a choice of thresholds for each index strain.
For A/H1N1 the chosen thresholds are h = 140, hc = 500 (Figures 3 and 4). In the five seasons with appreciable A/H1N1 (i.e., a peak incidence exceeding 30), the prediction occurred before the peak in two seasons, at the peak in one, and following the peak in the remaining two.
Fig. 3. Predicted versus observed values for influenza A/H1N1 for the choice of thresholds <i>h</i> = 140, <i>h</i><sub>c</sub> = 500. 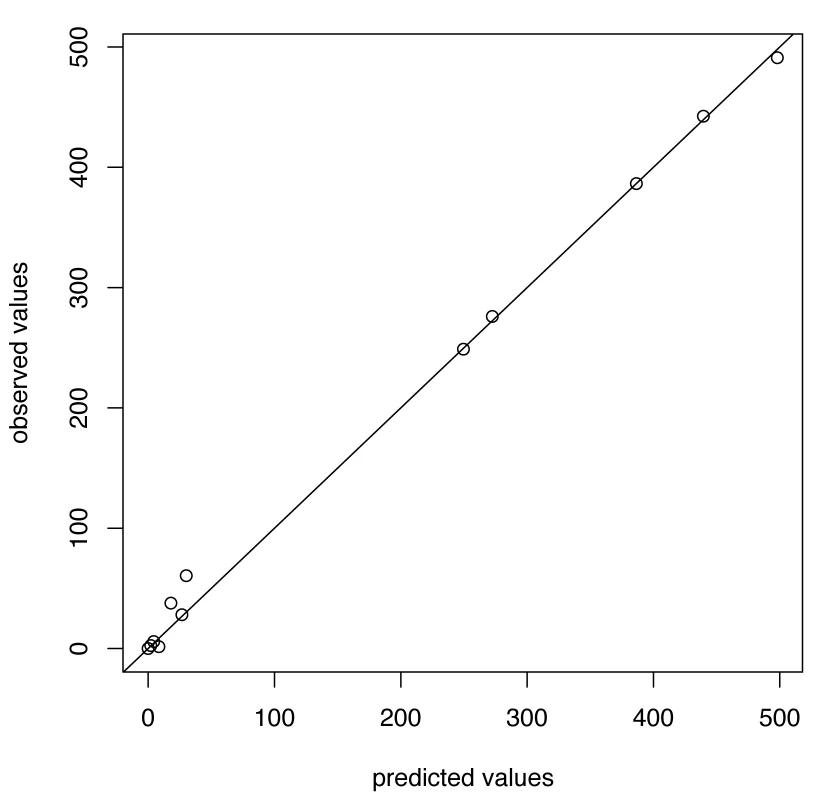
Fig. 4. Timing of prediction with regard to weekly influenza A/H1N1 incidence (week 1 = calendar week 40). 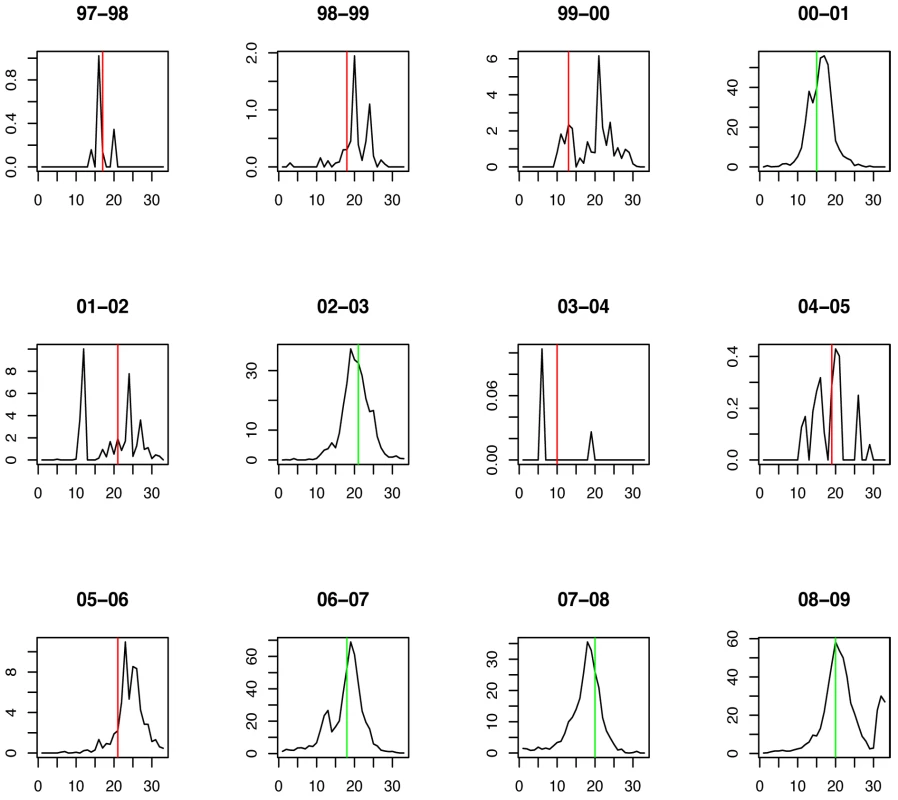
Green lines show the stopping time s in seasons in which the index strain's own threshold was crossed first; red lines indicate the stopping times in seasons in which the complementary threshold was crossed first. For A/H3N2 the chosen thresholds are h = 165, hc = 350 (Figures 5 and 6). Prediction occurs before the peak of the A/H3N2 incidence each season except for the (very small) 2000–2001 season.
Fig. 5. Predicted versus observed values for influenza A/H3N2 for the choice of thresholds <i>h</i> = 165, <i>h</i><sub>c</sub> = 350. 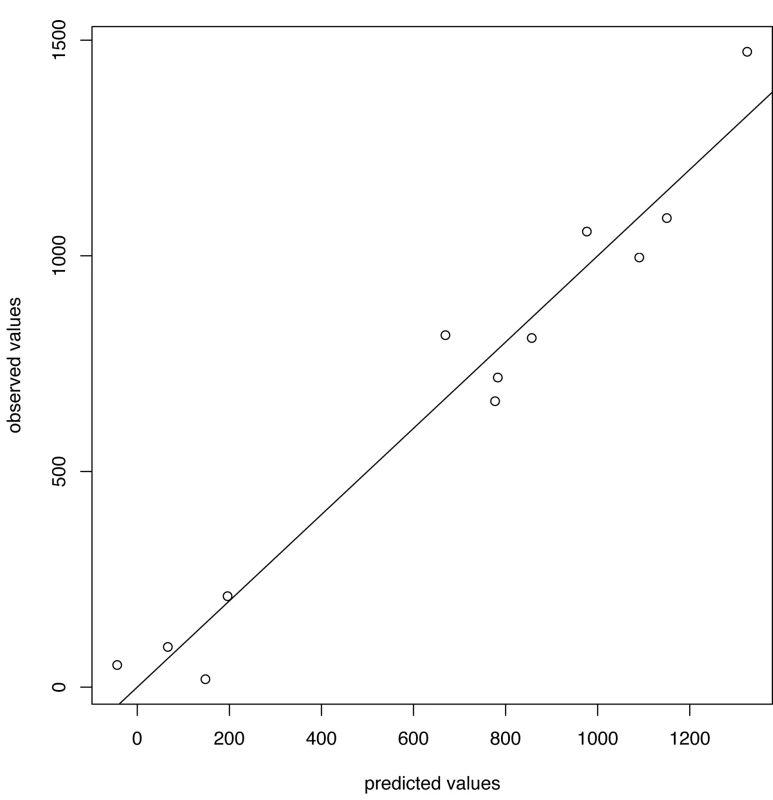
Fig. 6. Timing of prediction with regard to weekly influenza A/H3N2 incidence (week 1 = calendar week 40). 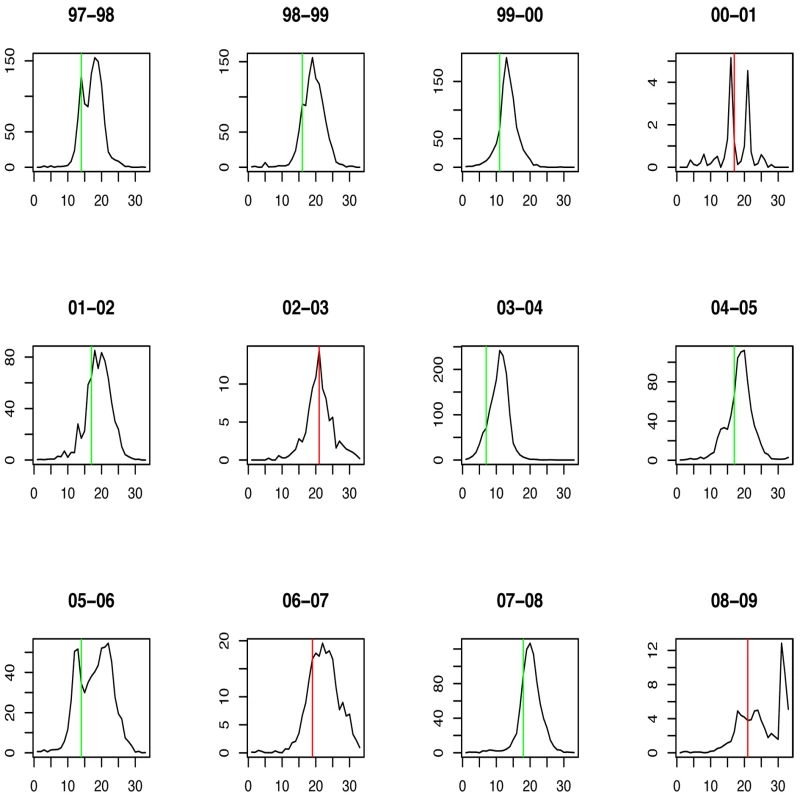
Green lines show the stopping time s in seasons in which the index strain's own threshold was crossed first; red lines indicate the stopping times in seasons in which the complementary threshold was crossed first. For influenza B the chosen thresholds are h = 80, hc = 675 (Figures 7 and 8). Prediction occurs before the peak of the B incidence each season.
Fig. 7. Predicted versus observed values for influenza B for the choice of thresholds <i>h</i> = 80, <i>h</i><sub>c</sub> = 675. 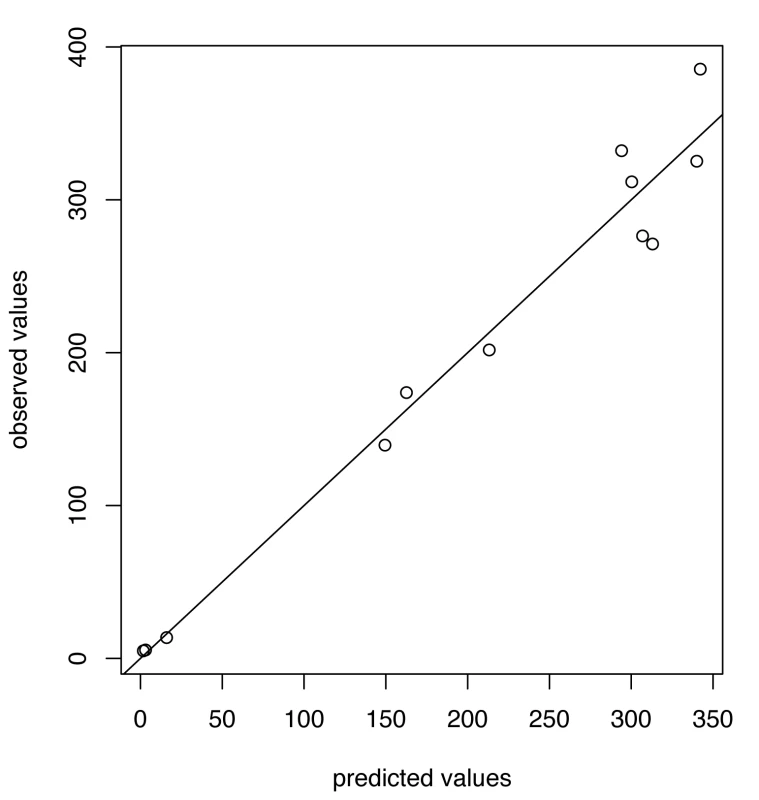
Fig. 8. Timing of prediction with regard to weekly influenza B incidence (week 1 = calendar week 40). 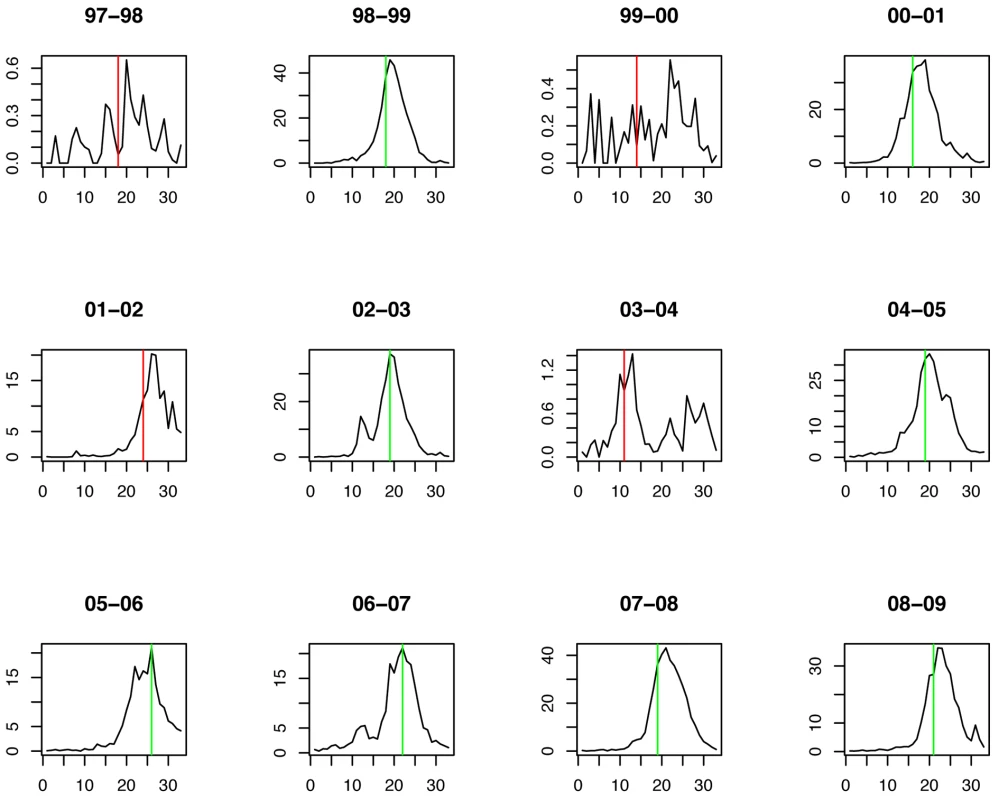
Green lines show the stopping time s in seasons in which the index strain's own threshold was crossed first; red lines indicate the stopping times in seasons in which the complementary threshold was crossed first. Table 1 summarizes the estimates and p-values for the regression coefficients, as well as the RSE for each model.
Tab. 1. Predictions of the epidemic sizes of A/H1N1 for the thresholds. 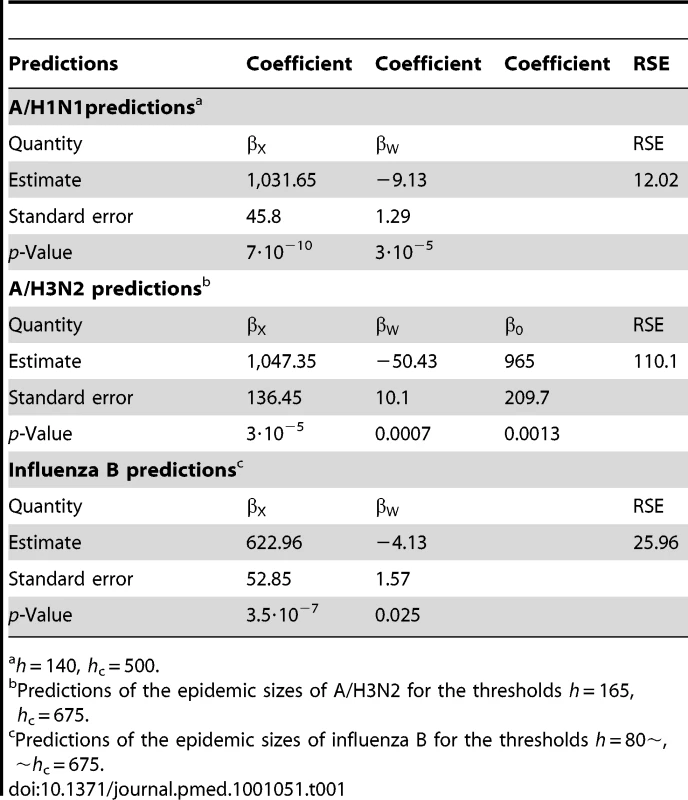
h = 140, hc = 500. Discussion
This study demonstrates how routine virologic and ILI surveillance data can be used to quantify the dynamics of cocirculating influenza strains and generate short-term predictions of the relative epidemic sizes of each strain during the course of an influenza season in the United States. This method should, in principle, be applicable to other settings/regions provided that the datasets are large enough for the estimates of the required quantities (particularly the percent of specimen testing positive for each strain) to be sufficiently robust.
Regional surveillance data on physician visits for ILI and subtyping of virologic specimens were combined to define a proxy for weekly incidence for each of the three strains, A/H3N2, A/H1N1, and B. This incidence proxy revealed for each index strain a negative association between the early CIP of the other two strains (the complementary CIP) and the CIP of the index strain for the whole season, i.e., the strain's epidemic size.
The negative association between strains' incidences suggests that high infection rates with one strain can interfere with the transmission of other strains. As noted above, this correlation may arise from either or both of two mechanisms: early complementary incidence may slow the spread of the index strain, and early, rapid spread of the index strain may slow the spread of the complementary strains. This issue is explored further in Text S1 where we examine the correlation between CIP of various strains during various time periods. Because A/H3N2 is the only strain that had large, early epidemics and showed a negative and significant correlation between its early incidence and the subsequent incidence of the other strains (Text S1), the data most strongly support the idea that A/H3N2 incidence interferes with the circulation of other strains. The negative correlation observed between a high complementary CIP and the epidemic size of A/H3N2 has multiple potential interpretations: the pattern is consistent with the interference of A/H1N1 and/or influenza B with A/H3N2 and the possibility that weak A/H3N2 seasons allowed complementary incidence to grow.
The mechanism of short-term heterologous protection may be also related to a potential impact of vaccination [11]. The population-level impact of vaccination on the proliferation of influenza strains not contained in the vaccine is currently unknown. A Canadian study found that people vaccinated for seasonal influenza had higher attack rates in the subsequent wave of A/H1N1pdm [5], an effect that was likely due at least in part to the lower heterologous protection conferred by the vaccine compared to natural infection. Vaccination against influenza A/H3N2 in mice prevented the induction of hetero-subtypic immunity against avian influenza A/H5N1 virus upon subsequent exposure to influenza A/H3N2 infection [12]. Data in [2] are more ambiguous: higher infection rates with H1N1 pdm for child recipients of seasonal influenza vaccine were recorded (32% versus 17%); however, the statistical significance of this association in the multivariate analysis depends on the adjustment method. One should note that the studies above essentially refer to the impact of the activity of influenza strains contained in the vaccine on the activity of influenza strains not contained in the vaccine, which took place shortly afterwards. The impact of a vaccine on influenza strains cocirculating within the same time period is less clear and further investigations are needed to address this question.
Because seasons with the largest early complementary CIP also had the smallest epidemics of each index strain, we tested the idea that one might be able to predict small seasons of an index strain if the complementary CIP reaches sufficiently high levels in the course of a season. Alternatively, if the index strain's incidence reaches sufficiently high levels first, one might predict the cumulative size of the index strain's incidence from its recent growth rate. We formalize these ideas by introducing thresholds for the complementary CIP and index CIP; reaching either threshold triggers a prediction of the whole-season CIP of the index strain. Because strong seasons of a strain generally start early, this prediction scheme based on threshold crossing should allow for a timely identification of a strain's strong season.
Incidence curves early in the season often have an irregular shape, which might be due to spatial heterogeneity and other factors not accounted for by the model. As a result, the threshold for the index strain's incidence should be high enough and sufficiently conservative so that the growth rate will be an accurate predictor of the epidemic size for that season. Similarly, the threshold for the complementary CIP is needed to be fairly high, potentially reflecting significant interference with the index strain. At the same time, those thresholds shouldn't be set too high or they will be reached either very late in the season (when prediction is of little interest) or never. We expressed the accuracy of the prediction as a function of the two thresholds by the RSE for the historical data [6], and we selected the thresholds in the space of thresholds where the accuracy appeared stable.
Because our model is based on only 12 seasons of observation, it might overfit the data; at the same time, its performance is probably affected by the omission of important factors. True confidence bounds for the prediction should probably be somewhat wider, as suggested by the “leave-one-out” cross-validation (Text S1). One potential source of error is the imperfection of the simple linear model and the predictor estimated from the incidence data. For example, one often sees a dent in the growth patterns of the incidence proxies around the time of winter school closures. If the index strain's threshold, h, is crossed in this period, the growth rate at that point might be underestimated. In addition, each choice of thresholds essentially corresponds to a separate model, and we have picked one that gives a good and stable fit to limited existing data. An important direction for future research will be to see if similar predictions can be made by fitting and validating simple models to longer time series.
The definition of the covariate corresponding to the timing of threshold crossing is different for influenza A/H3N2 compared to influenza A/H1N1 and B. The main reason for that difference is that A/H3N2 experienced strong and early seasons in the data. The exceptionally strong and early 2003–2004 season is the only season that has a p-value below 0.05 in the leave-one-out cross-validation. However, incorporating this season into the prediction framework should give a better adjustment for the timing of threshold crossing, which in turn should be useful for future predictions of early and strong influenza A/H3N2 seasons. For influenza A/H1N1 and B, calibration of the prediction framework based on the 1997–2009 data might not yield accurate predictions of the sizes of exceptionally strong and early seasons for the index strain. The ongoing, 2010–2011 season contains an early threshold crossing for influenza B compared to the 1997–2009 seasons; moreover, the CIP of influenza B by calendar week 10 of 2011 is already larger than the whole-season CIP of influenza B in any season in the 1997–2009 data. We expect that recalibration of the prediction framework after the current season should give a better adjustment for the timing of threshold crossing for influenza B.
Our method for prediction has several additional limitations that might affect its applicability since the apparent replacement of seasonal A/H1N1 by A/H1N1pdm. The quality of the composite proxy for true influenza infection incidence is uncertain. If the case-reporting rate of A/H1N1pdm differs from the previous seasonal A/H1N1, the predictors might require recalculation. Moreover, the ratio between this indicator and the number of true (serologic) infections may vary by year for each strain. It is unknown how the strength of cross-immunity between the strains depends on strain types and time since infection and it is consequently unknown how A/H1N1pdm might affect the strength of these associations. Answering these questions will require further efforts, including experimental immunological studies and explicit mechanistic models of transmission dynamics (e.g., [S. Cobey et al., personal communication]).
Despite its limitations, this method gives a reasonable prediction of the epidemic sizes of A/H3N2, A/H1N1, and influenza B relative to historical precedents. In particular, the model predicted the relative epidemic size of A/H3N2, the strain associated with the highest rates of mortality [13], on average several weeks before its peak in seasons in which A/H3N2 dominated. Such predictive methods may be useful to decision makers when they are trying to determine in real-time which measures to recommend for an influenza season.
Supporting Information
Zdroje
1. SonoguchiTNaitoHHaraMTakeuchiYFukumiH 1985 Cross-subtype protection in humans during sequential, overlapping, and/or concurrent epidemics caused by H3N2 and H1N1 influenza viruses. J Infect Dis 151 81 88
2. CowlingBJNgSMaESChengCKWaiW 2010 Protective efficacy of seasonal influenza vaccination against seasonal and pandemic influenza virus infection during 2009 in Hong Kong. Clin Infect Dis 51 1370 1379
3. FergusonNMGalvaniAPBushRM 2003 Ecological and immunological determinants of influenza evolution. Nature 422 428 433
4. TriaFLassigMPelitlLFranzS 2005 A minimal stochastic model for influenza evolution. J Stat Mech Theor Exp P07008
5. SkowronskiDMDe SerresGCrowcroftNSJanjuaNZBoulianneN 2010 Association between the 2008–09 seasonal influenza vaccine and pandemic H1N1 illness during Spring-Summer 2009: four observational studies from Canada. PLoS Med 7 e1000258 doi:10.1371/journal.pmed.1000258
6. CDC United States Surveillance Data. Available: http://www.cdc.gov/flu/weekly/ussurvdata.htm. Accessed 1 September 2010
7. CDC Overview of Influenza Surveillance in the United States. Available: http://www.cdc.gov/flu/weekly/overview.htm#Viral. Accessed 1 December 2010
8. CDC United States Census Estimates. Available: http://wonder.cdc.gov/population.html. Accessed 1 September 2010
9. ShamanJPitzerVEViboudCGrenfellBTLipsitchM 2010 Absolute humidity and the seasonal onset of influenza in the continental United States. PLoS Biol 8 e1000316 doi:10.1371/journal.pbio.1000316
10. ShamanJGoldsteinELipsitchM 2011 Absolute humidity and pandemic versus epidemic influenza. Am J Epidemiol 173 127 135
11. BodewesRKreijtzJHRimmelzwaanGF 2009 Yearly influenza vaccinations: a double-edged sword? Lancet Infect Dis 9 784 788
12. BodewesRKreijtzJHBaasCGeelhoed-MierasMMde MutsertG 2009 Vaccination against human influenza A/H3N2 virus prevents the induction of heterosubtypic immunity against lethal infection with avian influenza A/H5N1 virus. PLoS One 4 e5538 doi:10.1371/journal.pone.0005538
13. ThompsonWWShayDKWeintraubEBrammerLCoxN 2003 Mortality associated with influenza and respiratory syncytial virus in the United States. JAMA 289 179 186
Štítky
Interní lékařství
Článek vyšel v časopisePLOS Medicine
Nejčtenější tento týden
2011 Číslo 7- Berberin: přírodní hypolipidemikum se slibnými výsledky
- Léčba bolesti u seniorů
- Příznivý vliv Armolipidu Plus na hladinu cholesterolu a zánětlivé parametry u pacientů s chronickým subklinickým zánětem
- Jak postupovat při výběru betablokátoru − doporučení z kardiologické praxe
- Červená fermentovaná rýže účinně snižuje hladinu LDL cholesterolu jako vhodná alternativa ke statinové terapii
-
Všechny články tohoto čísla
- Retention in HIV Care between Testing and Treatment in Sub-Saharan Africa: A Systematic Review
- Health Care Systems and Conflict: A Fragile State of Affairs
- Simplified ART Delivery Models Are Needed for the Next Phase of Scale Up
- Individualized Cost-Effectiveness Analysis
- Is Scale-Up Worth It? Challenges in Economic Analysis of Diagnostic Tests for Tuberculosis
- Treatment Outcomes and Cost-Effectiveness of Shifting Management of Stable ART Patients to Nurses in South Africa: An Observational Cohort
- Risk Factors for Severe Outcomes following 2009 Influenza A (H1N1) Infection: A Global Pooled Analysis
- Predicting the Epidemic Sizes of Influenza A/H1N1, A/H3N2, and B: A Statistical Method
- GeneXpert—A Game-Changer for Tuberculosis Control?
- LED Fluorescence Microscopy for the Diagnosis of Pulmonary Tuberculosis: A Multi-Country Cross-Sectional Evaluation
- Configuring Balanced Scorecards for Measuring Health System Performance: Evidence from 5 Years' Evaluation in Afghanistan
- A Multi-Country Non-Inferiority Cluster Randomized Trial of Frontloaded Smear Microscopy for the Diagnosis of Pulmonary Tuberculosis
- Comparison of Xpert MTB/RIF with Other Nucleic Acid Technologies for Diagnosing Pulmonary Tuberculosis in a High HIV Prevalence Setting: A Prospective Study
- Global Pharmacovigilance for Antiretroviral Drugs: Overcoming Contrasting Priorities
- Evidence-Based African First Aid Guidelines and Training Materials
- Screening for HIV-Associated Tuberculosis and Rifampicin Resistance before Antiretroviral Therapy Using the Xpert MTB/RIF Assay: A Prospective Study
- PLOS Medicine
- Archiv čísel
- Aktuální číslo
- Informace o časopisu
Nejčtenější v tomto čísle- Individualized Cost-Effectiveness Analysis
- GeneXpert—A Game-Changer for Tuberculosis Control?
- Screening for HIV-Associated Tuberculosis and Rifampicin Resistance before Antiretroviral Therapy Using the Xpert MTB/RIF Assay: A Prospective Study
- Treatment Outcomes and Cost-Effectiveness of Shifting Management of Stable ART Patients to Nurses in South Africa: An Observational Cohort
Kurzy
Zvyšte si kvalifikaci online z pohodlí domova
Současné možnosti léčby obezity
nový kurzAutoři: MUDr. Martin Hrubý
Všechny kurzyPřihlášení#ADS_BOTTOM_SCRIPTS#Zapomenuté hesloZadejte e-mailovou adresu, se kterou jste vytvářel(a) účet, budou Vám na ni zaslány informace k nastavení nového hesla.
- Vzdělávání


