-
Články
Top novinky
Reklama- Vzdělávání
- Časopisy
Top články
Nové číslo
- Témata
Top novinky
Reklama- Videa
- Podcasty
Nové podcasty
Reklama- Kariéra
Doporučené pozice
Reklama- Praxe
Top novinky
ReklamaTiming and Completeness of Trial Results Posted at ClinicalTrials.gov and Published in Journals
Background:
The US Food and Drug Administration Amendments Act requires results from clinical trials of Food and Drug Administration–approved drugs to be posted at ClinicalTrials.gov within 1 y after trial completion. We compared the timing and completeness of results of drug trials posted at ClinicalTrials.gov and published in journals.Methods and Findings:
We searched ClinicalTrials.gov on March 27, 2012, for randomized controlled trials of drugs with posted results. For a random sample of these trials, we searched PubMed for corresponding publications. Data were extracted independently from ClinicalTrials.gov and from the published articles for trials with results both posted and published. We assessed the time to first public posting or publishing of results and compared the completeness of results posted at ClinicalTrials.gov versus published in journal articles. Completeness was defined as the reporting of all key elements, according to three experts, for the flow of participants, efficacy results, adverse events, and serious adverse events (e.g., for adverse events, reporting of the number of adverse events per arm, without restriction to statistically significant differences between arms for all randomized patients or for those who received at least one treatment dose).
From the 600 trials with results posted at ClinicalTrials.gov, we randomly sampled 50% (n = 297) had no corresponding published article. For trials with both posted and published results (n = 202), the median time between primary completion date and first results publicly posted was 19 mo (first quartile = 14, third quartile = 30 mo), and the median time between primary completion date and journal publication was 21 mo (first quartile = 14, third quartile = 28 mo). Reporting was significantly more complete at ClinicalTrials.gov than in the published article for the flow of participants (64% versus 48% of trials, p<0.001), efficacy results (79% versus 69%, p = 0.02), adverse events (73% versus 45%, p<0.001), and serious adverse events (99% versus 63%, p<0.001).
The main study limitation was that we considered only the publication describing the results for the primary outcomes.Conclusions:
Our results highlight the need to search ClinicalTrials.gov for both unpublished and published trials. Trial results, especially serious adverse events, are more completely reported at ClinicalTrials.gov than in the published article.
Please see later in the article for the Editors' Summary
Published in the journal: . PLoS Med 10(12): e32767. doi:10.1371/journal.pmed.1001566
Category: Research Article
doi: https://doi.org/10.1371/journal.pmed.1001566Summary
Background:
The US Food and Drug Administration Amendments Act requires results from clinical trials of Food and Drug Administration–approved drugs to be posted at ClinicalTrials.gov within 1 y after trial completion. We compared the timing and completeness of results of drug trials posted at ClinicalTrials.gov and published in journals.Methods and Findings:
We searched ClinicalTrials.gov on March 27, 2012, for randomized controlled trials of drugs with posted results. For a random sample of these trials, we searched PubMed for corresponding publications. Data were extracted independently from ClinicalTrials.gov and from the published articles for trials with results both posted and published. We assessed the time to first public posting or publishing of results and compared the completeness of results posted at ClinicalTrials.gov versus published in journal articles. Completeness was defined as the reporting of all key elements, according to three experts, for the flow of participants, efficacy results, adverse events, and serious adverse events (e.g., for adverse events, reporting of the number of adverse events per arm, without restriction to statistically significant differences between arms for all randomized patients or for those who received at least one treatment dose).
From the 600 trials with results posted at ClinicalTrials.gov, we randomly sampled 50% (n = 297) had no corresponding published article. For trials with both posted and published results (n = 202), the median time between primary completion date and first results publicly posted was 19 mo (first quartile = 14, third quartile = 30 mo), and the median time between primary completion date and journal publication was 21 mo (first quartile = 14, third quartile = 28 mo). Reporting was significantly more complete at ClinicalTrials.gov than in the published article for the flow of participants (64% versus 48% of trials, p<0.001), efficacy results (79% versus 69%, p = 0.02), adverse events (73% versus 45%, p<0.001), and serious adverse events (99% versus 63%, p<0.001).
The main study limitation was that we considered only the publication describing the results for the primary outcomes.Conclusions:
Our results highlight the need to search ClinicalTrials.gov for both unpublished and published trials. Trial results, especially serious adverse events, are more completely reported at ClinicalTrials.gov than in the published article.
Please see later in the article for the Editors' SummaryIntroduction
Without accessible and usable reports, research fails to help patients and their clinicians [1]. Over the past decades, underreporting of trial results has been increasingly acknowledged as one of the main causes of waste of research [2]–[5], contributing to biased evidence, with serious consequences for clinical practice, research, and, ultimately, patients [1]. This waste of research can occur at different stages: (1) failure to publish results of some studies, particularly those with negative results, “publication bias” [6]–[8]; (2) delay in publishing results of negative studies [9], “time-lag bias” [10]; and (3) failure to publish complete results for all prespecified outcomes, “reporting bias” [10]–[14]. Among published studies, some results may be incompletely reported and therefore cannot be included in a meta-analysis. This is the case, for example, when the difference in means between treatments is reported but not a measure of precision.
To overcome these issues, the 2007 US Food and Drug Administration Amendments Act (FDAAA) requires that the results from clinical trials of Food and Drug Administration–approved drugs and devices conducted in the United States must be made publicly available at ClinicalTrials.gov within 1 y of the completion of the trial, whether the results are published or not [15]–[18]. This US public law requires a “table of the demographic and baseline data collected overall and for each arm of the clinical trial to describe the patients who participated in the clinical trial … [and] a table of values for each of the primary and secondary outcome measures for each arm of the clinical trial, including the results of scientifically appropriate tests of the statistical significance of such outcome measures.” Researchers of other trials registered in ClinicalTrials.gov are welcome to post trial results as well. In our study, we aimed to compare the timing and completeness (i.e., whether all relevant information was fully reported) of results publicly posted at ClinicalTrials.gov and in published articles for trials of drug interventions.
Methods
We identified trials with results posted on ClinicalTrials.gov and their corresponding full-text publications in journals.
Search for Trials with Results Posted at ClinicalTrials.gov
We searched ClinicalTrials.gov on March 27, 2012, using the following keywords: “Closed study” in the Recruitment field, “With results” for Study Results, “Interventional studies” for Study Type, and “Phase III and IV” for Phase. We selected completed phase III or IV randomized controlled trials listing only drugs as intervention type. We excluded trials comparing a drug to a device. We excluded phase II/III trials, considering them to be phase II trials. Of all eligible trials (n = 1,592), we selected a random sample of 600 trials for which to search for full-text publications.
Search for Publication of Results in Journals
Whenever possible, we used the link within ClinicalTrials.gov to identify the published article. We also systematically searched MEDLINE via PubMed by using the ClinicalTrials.gov identification number (NCT number). If no publication was identified, we searched MEDLINE via PubMed again by using keywords for drug names and the condition studied. The articles identified through the search had to match the corresponding trial in terms of the information registered at ClinicalTrials.gov (i.e., same objective, same sample size, same primary outcome, same location, same responsible party, same trial phase, and same sponsor) and had to present results for the primary outcome. A second reviewer checked the matching between ClinicalTrials.gov and the published article. All disagreements were resolved by discussion between the two reviewers.
In order to compare the reporting between the ClinicalTrials.gov report and the published article, we excluded trials for which results were published in a journal that could not be retrieved or were published in a language other than English, French, or Spanish. We also excluded single-arm studies because they lacked a control group, as well as studies with four or more arms, for practical reasons.
Data Extraction
We collected the following information from ClinicalTrials.gov for the random sample of 600 trials with results posted at ClinicalTrials.gov:
-
General characteristics of the trial: primary funding sources (extracted from Study Sponsor at ClinicalTrials.gov), medical specialty (extracted from Conditions at ClinicalTrials.gov), and countries where the trial was conducted (extracted from Location Countries at ClinicalTrials.gov). We also collected trial primary completion date (defined as the date of final collection of data for the primary outcome) and date when results were first publicly posted—this date was extracted from the archive record and differs from the date on which results were first received, which is available under Study Results at ClinicalTrials.gov. The difference between these two dates is related to production and the vetting of the results by the US National Institutes of Health.
-
Design of the trial: we noted whether the trial was a phase III or IV trial. We recorded whether it was a parallel or crossover trial.
-
Interventions: details concerning interventions for experimental and control groups were extracted from Study Arm(s) at ClinicalTrials.gov.
Then, for all trials with both results posted and published, we collected the following information independently from ClinicalTrials.gov and from the published article:
-
Flow of participants in the trial: reporting of the flow of participants, including number of participants assessed for eligibility, number of participants randomized overall and per arm, number of participants who received the intervention per arm and whether the reasons for not receiving the intervention were specified, number of patients lost to follow-up and those who discontinued the intervention and whether the reasons for discontinuation were given, and number of participants analyzed per arm and whether the reasons for excluding participants from the analysis were reported.
-
Efficacy results: for the primary outcome posted at ClinicalTrials.gov, we extracted data from ClinicalTrials.gov for this outcome. If several primary outcomes were posted at ClinicalTrials.gov, we focused on the first registered. When we extracted efficacy results in the published article, we extracted data for this outcome whether it was reported as primary or secondary. If the outcome was not reported at all, we considered the data to be missing. For all types of outcomes, we collected whether numbers of patients analyzed per arm were reported. For binary outcomes, we collected whether the number of events per arm was reported. For continuous outcomes, we collected whether (1) mean (± standard deviation [SD]) or (2) median (interquartile) was reported or (3) neither of these was reported. For time-to-event outcomes, we collected whether the results of the log-rank test or Cox proportional hazard model were reported.
-
Adverse events: we noted whether adverse events were reported and whether they were reported by number per arm. We collected whether all adverse events were reported or only common events were reported or those with statistically significant differences between arms. We noted whether reporting of adverse events concerned all randomized participants or only those who received at least one treatment dose. We also collected whether withdrawals due to adverse events were reported.
-
Serious adverse events: we collected whether serious adverse events were reported, were reported per arm, and were reported with numerical data.
All data were extracted in duplicate by two reviewers in data collection forms. All disagreements were resolved by discussion to reach a consensus, including intervention of a third reviewer in case of discrepancies.
We also extracted the characteristics of the publication (i.e., the journal in which the article was published, the date of online publication, the type of journal [general medical, medical specialty], and whether the NCT number was reported in the published article).
Assessment of the Completeness of Reporting
Three experts in clinical epidemiology reached consensus on the main elements that needed to be reported for each of the following domains: the flow of participants during the trial, efficacy results, adverse events, and serious adverse events, on the basis of data required to perform meta-analyses. The reporting was considered complete for each domain if all of the included elements in Box 1 were reported and incomplete if one or more elements were missing from the items listed in Box 1.
Box 1. Definition of Completeness of Reporting
The reporting was considered complete for each domain if all of the included elements were reported and incomplete if one or more elements were missing:
Flow of participants
-
Number of patients randomized per arm and
-
Number of patients lost to follow-up per arm and
-
Number of patients analyzed per arm
Efficacy results
-
For binary outcomes:
-
Number of events per arm and
-
Number of patients analyzed per arm
-
-
For continuous outcomes:
-
Mean or median per arm and SD or SE or 95% CI or Q1–Q3 or
-
Effect size (difference in means or standardized mean difference) with 95% CI
-
-
For time-to-event outcomes:
-
Hazard ratio with 95% CI
-
Adverse events
-
Number of adverse events per arm without restriction to statistically significant differences between arms for all randomized participants or for those who received at least one treatment dose
Serious adverse events
-
Number of serious adverse events per arm
In a second step, we compared the number of elements reported at ClinicalTrials.gov and in the published article for the flow of participants, efficacy results, adverse events, and serious adverse events. We assessed the number of pairs (with percentage) for which ClinicalTrials.gov provided more information (higher number of elements reported), similar information (same number of elements reported), and less information (lower number of elements reported) as compared with the published article for the flow of participants, efficacy results, adverse events, and serious adverse events as defined above.
Statistical Analyses
Inter-rater agreement between the two reviewers was assessed by the Kappa coefficient (95% CI). Descriptive analyses of trial characteristics included numbers and percentages. Time from trial primary completion date to the date of posting of results at ClinicalTrials.gov or online publication in journals was described with the Kaplan and Meier method for trials with results both posted at ClinicalTrials.gov and published.
We compared results posted at ClinicalTrials.gov and in the published article for completeness of reporting using McNemar's test of equality of paired proportions. We tested the interaction between completeness of reporting at ClinicalTrials.gov and in the published article and the following trial characteristics: type of journal (general versus specialty), type of control (active versus placebo or no treatment), source of funding (academic, industry, both), and study design (parallel arms versus crossover) using a generalized estimation equation (GEE) model to take into account the correlation between the paired observations.
All tests were two-tailed, and p<0.05 was considered statistically significant. Analyses were conducted using R version 2.15.1 [19].
Results
Figure 1 describes the selection of trials. Briefly, from the 2,837 trials retrieved by a search of ClinicalTrials.gov on March 27, 2012, we identified 1,592 completed phase III or IV randomized drug trials with results posted at ClinicalTrials.gov. We selected a random sample of 600 trials to search for corresponding publications.
Fig. 1. Flow diagram of selection of relevant trials. 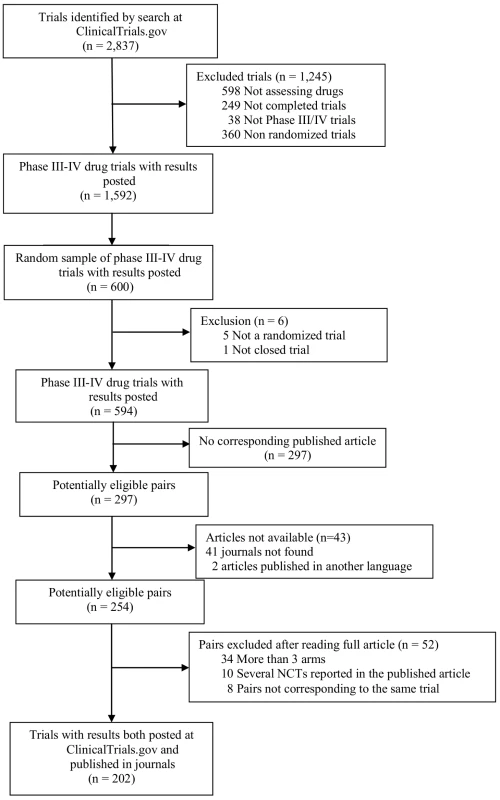
NCTs, NCT numbers. Time to Posting Results at ClinicalTrials.gov and Publication in Journals
Of the 600 trials with results posted at ClinicalTrials.gov that were randomly selected for a search for corresponding publications, we excluded five that were not randomized controlled trials, and one that was still enrolling patients. From the remaining 594 trials, 297 (50%) had no corresponding published article. The median year of completion of trials with no corresponding article was 2009 (first quartile [Q1] = 2008, third quartile [Q3] = 2009). We included 202 pairs of reports for publicly posted and published results. In total, 18 of the 202 trials (9%) had multiple publications (from two to 14). These reports concerned protocols or preliminary results such as baseline results (n = 6), interim analyses (n = 3), long-term outcomes (n = 15), other outcomes (n = 19), and/or other results (n = 1). None of the eliminated reports contained additional safety data for the same time frame as the selected report. Two of the eliminated reports contained additional safety results for longer-term follow-up. The median time between primary completion date and results first being publicly posted at ClinicalTrials.gov was 19 mo (Q1 = 14, Q3 = 30 mo); the median time between primary completion date and publication in journals was 21 mo (Q1 = 14, Q3 = 28 mo) (Figure 2).
Fig. 2. Comparison of time from primary completion date of the trial to posting of results at ClinicalTrials.gov and to online publication in journals for trials with both posted and published results. 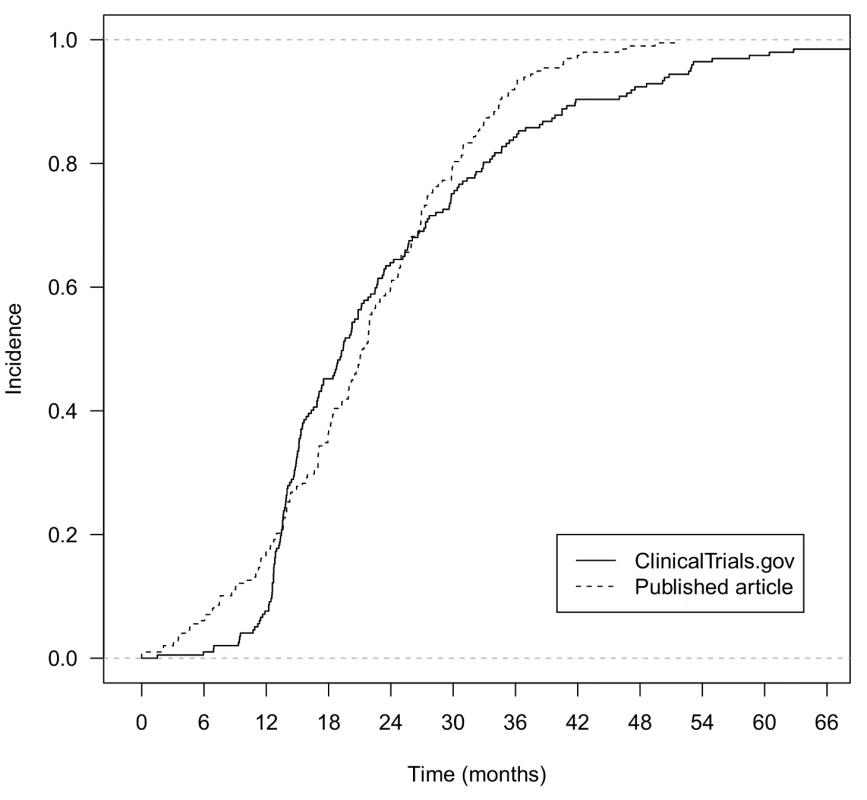
Characteristics of Trials with Both Posted and Published Results
Inter-rater agreement between the 2 reviewers was good overall, with median Kappa coefficient 0.80 (range 0.47–0.95) for qualitative variables and 0.98 (0.91–0.99) for quantitative variables.
For the 202 trials with both posted and published results, 69% (139/202) were phase III trials and 31% (63/202) were phase IV trials (Table 1). The primary source of funding was industry for 85% (173/202) of trials, academic for 10% (20/202), and both for 5% (9/202). In total, 75% (152/202) of trials had at least one site in the United States; for 68% (138/202), results were published in specialty medical journals, and for 32% (64/202) in general journals. For 79% (160/202) of trials, the NCT number was reported in the published article.
Tab. 1. Characteristics of the random sample of 600 trials with results posted at ClinicalTrials.gov for which publications were sought. 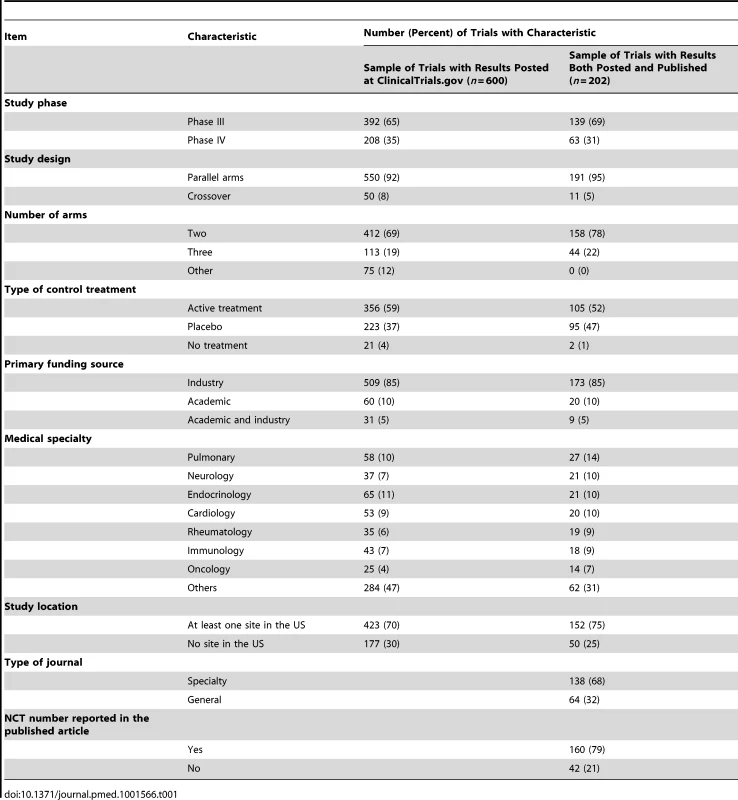
Reporting of Flow of Participants
For the 202 trials with both publicly posted and published results, the number of patients assessed for eligibility was reported for 1% (2/202) of trials at ClinicalTrials.gov and for 65% (131/202) in the published article (Table 2). The number of patients allocated to the intervention group was reported for 99% (200/202) of trials at ClinicalTrials.gov and for 95% (192/202) in the published article. The number of patients lost to follow-up per group was reported for 66% (133/202) of trials at ClinicalTrials.gov and for 53% (108/202) in the published article. The number of patients analyzed was reported for 96% (193/202) of trials at ClinicalTrials.gov and for 88% (177/202) in the published article. The reasons for participant exclusion from the analysis were reported for only 8% of trials (16/202) at ClinicalTrials.gov and 7% (14/202) of published articles.
Tab. 2. Reporting of items concerning the flow of participants during the trial at ClinicalTrials.gov and in published articles. 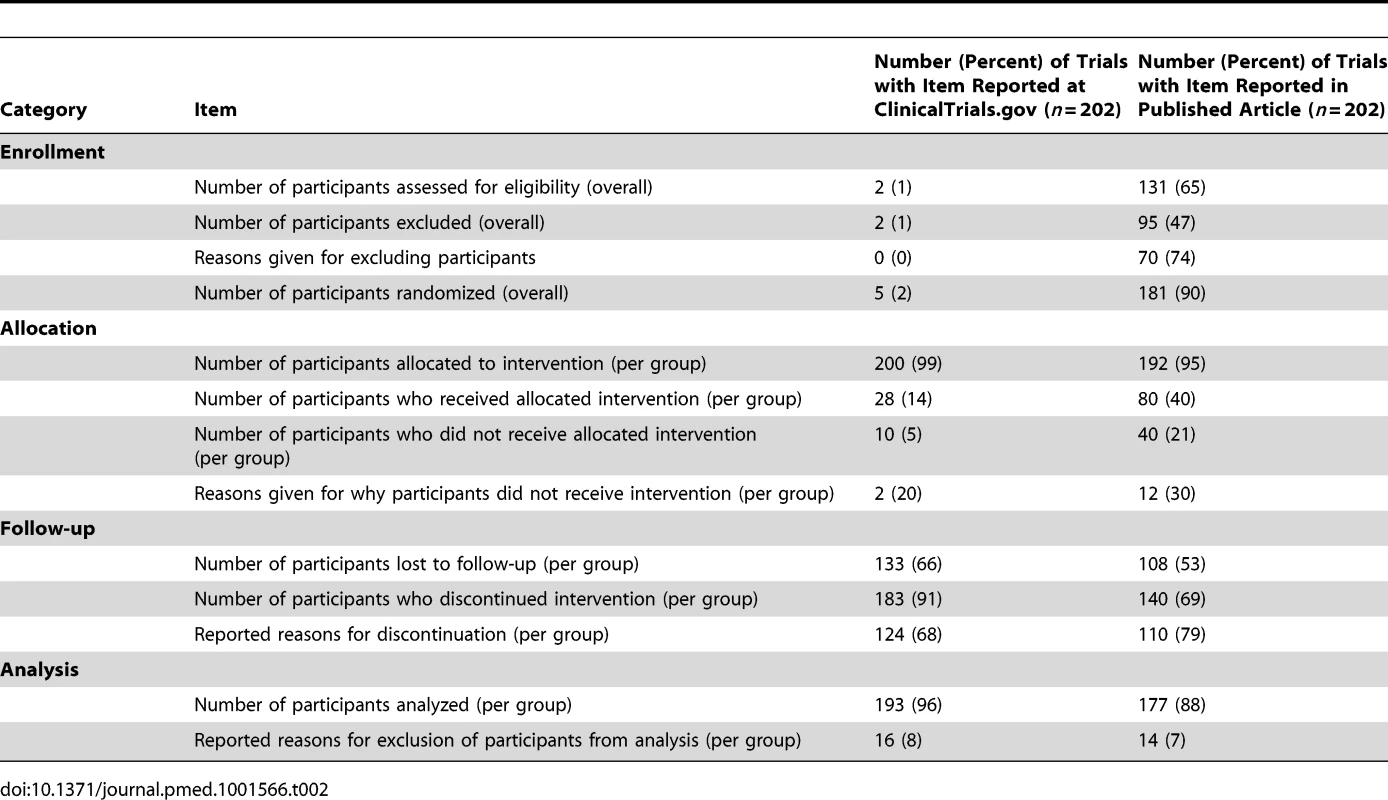
Reporting of Efficacy Results
For trials with a binary outcome (n = 73), the number of patients analyzed was reported for 97% (71/73) of trials at ClinicalTrials.gov and for 89% (65/73) in the published article (Table 3). The number of events was reported for 55% (40/73) of trials at ClinicalTrials.gov and for 66% (48/73) in the published article. For trials with a continuous outcome (n = 107), the mean or median was reported for 100% (107/107) of trials at ClinicalTrials.gov and for 90% (96/107) in the published article (Table 3). Dispersion was reported for 96% (103/107) of trials at ClinicalTrials.gov and for 64% (69/107) in the published article. For trials with a time-to-event outcome (n = 22), the median time to event was reported for 50% (11/22) of trials at ClinicalTrials.gov and for 41% (9/22) in the published article (Table 3). The number of events was reported for 32% (7/22) of trials at ClinicalTrials.gov and for 32% (7/22) in the published article. The hazard ratio with 95% CI was reported for 68% (15/22) of trials at ClinicalTrials.gov and for 73% (16/22) in the published article.
Tab. 3. Reporting of efficacy results at ClinicalTrials.gov and in published articles. 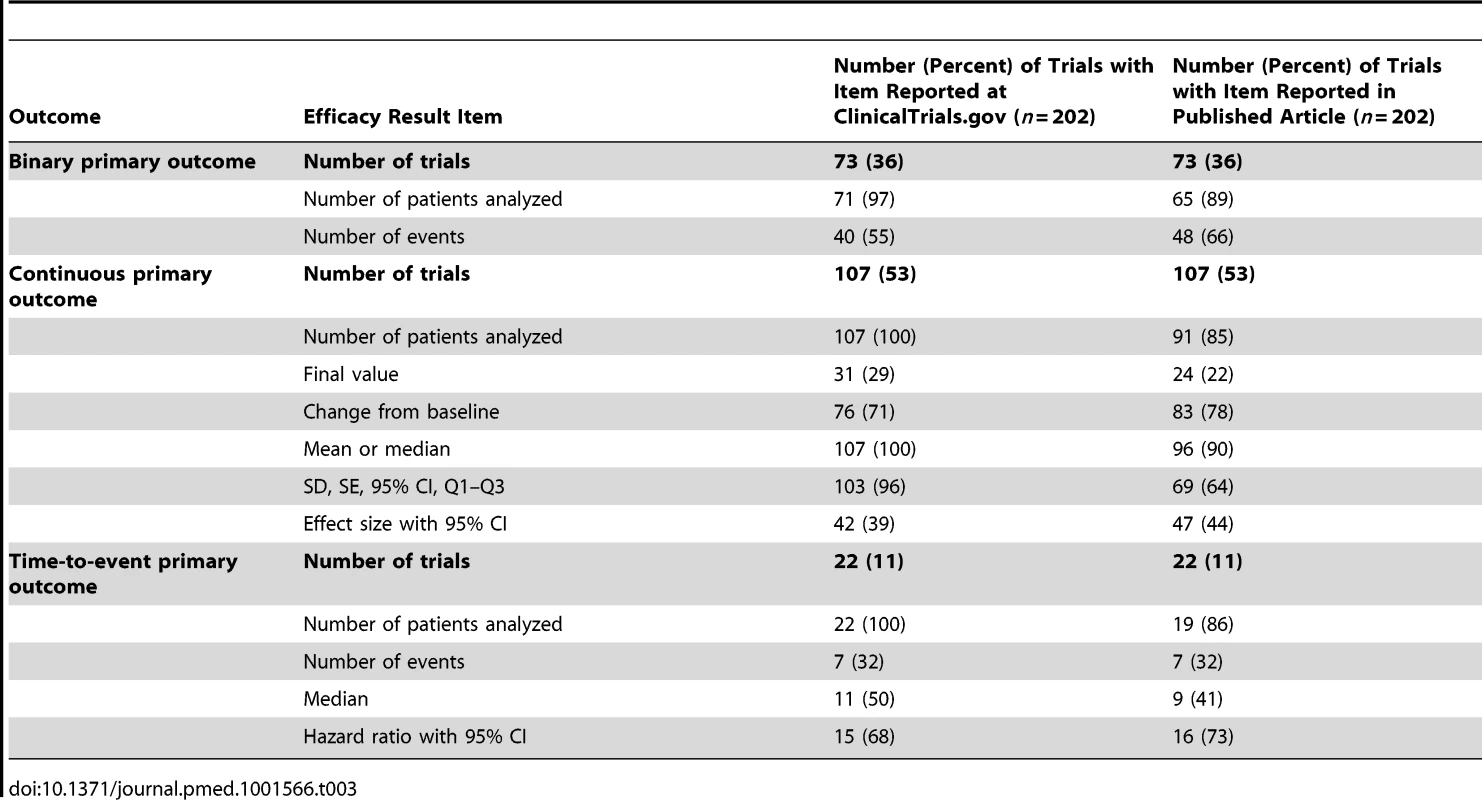
The comparison of efficacy results between ClinicalTrials.gov and the published article could not be performed in 96/202 (48%) trials:
-
For 42/73 (58%) trials with binary outcomes the comparison could not be made because of incomplete reporting of the number of events. This information was missing in 33 (79%) trials at ClinicalTrials.gov, 25 (60%) in the published article, and 16 (38%) in both data sources. For the 31 trials reporting this information both at ClinicalTrials.gov and in the published article, the numbers of events were the same for 27 (87%).
-
For 45/107 (42%) trials with continuous outcomes, the comparison could not be made: nine (20%) because of different types of analysis (e.g., the final-value mean [SD] was reported at ClinicalTrials.gov, experimental arm, 1.12 [0.54], and control arm, 1.14 [0.55], while the change-from-baseline mean [95% CI] was reported in the published article, experimental arm, 0.59 [0.47 to 0.71], and control arm, 0.54 [0.41 to 0.67]), and 36 (80%) because of incomplete or different reporting between the two sources (e.g., different rounding used; SD reported in one source and standard error [SE] reported in the other).
-
For 9/22 (41%) trials with time-to-event outcomes the comparison could not be made because of incomplete reporting of hazard ratio (95% CI). This information was missing in seven (78%) trials at ClinicalTrials.gov, six (67%) in the published article, and four (44%) in both data sources.
Reporting of Adverse Events
For the 202 pairs of trial reports, the population for analysis corresponded to all randomized participants for 57% (115/202) of trials at ClinicalTrials.gov and 36% (72/202) of published articles (Table 4). The total number of adverse events was reported for 96% (194/202) of trials at ClinicalTrials.gov and for 63% (128/202) in the published article. All adverse events per arm were reported for 13% (26/202) of trials at ClinicalTrials.gov and for 5% (10/202) in the published article. Otherwise, reporting was restricted to the most common events for 99% (174/176) of trials at ClinicalTrials.gov and for 44% (85/192) in the published article, or to statistically significant events for 15% (29/192) of trials in the published article. Withdrawals due to adverse events were reported for 80% (161/202) of trials in ClinicalTrials.gov and for 76% (153/202) in the published article. There was some mention of serious adverse events for 99% (200/202) of trials at ClinicalTrials.gov and for 71% (144/202) in the published article, and all serious adverse events were reported per arm for 99% (199/202) and 63% (127/202), respectively.
Tab. 4. Reporting of adverse events at ClinicalTrials.gov and in published articles. 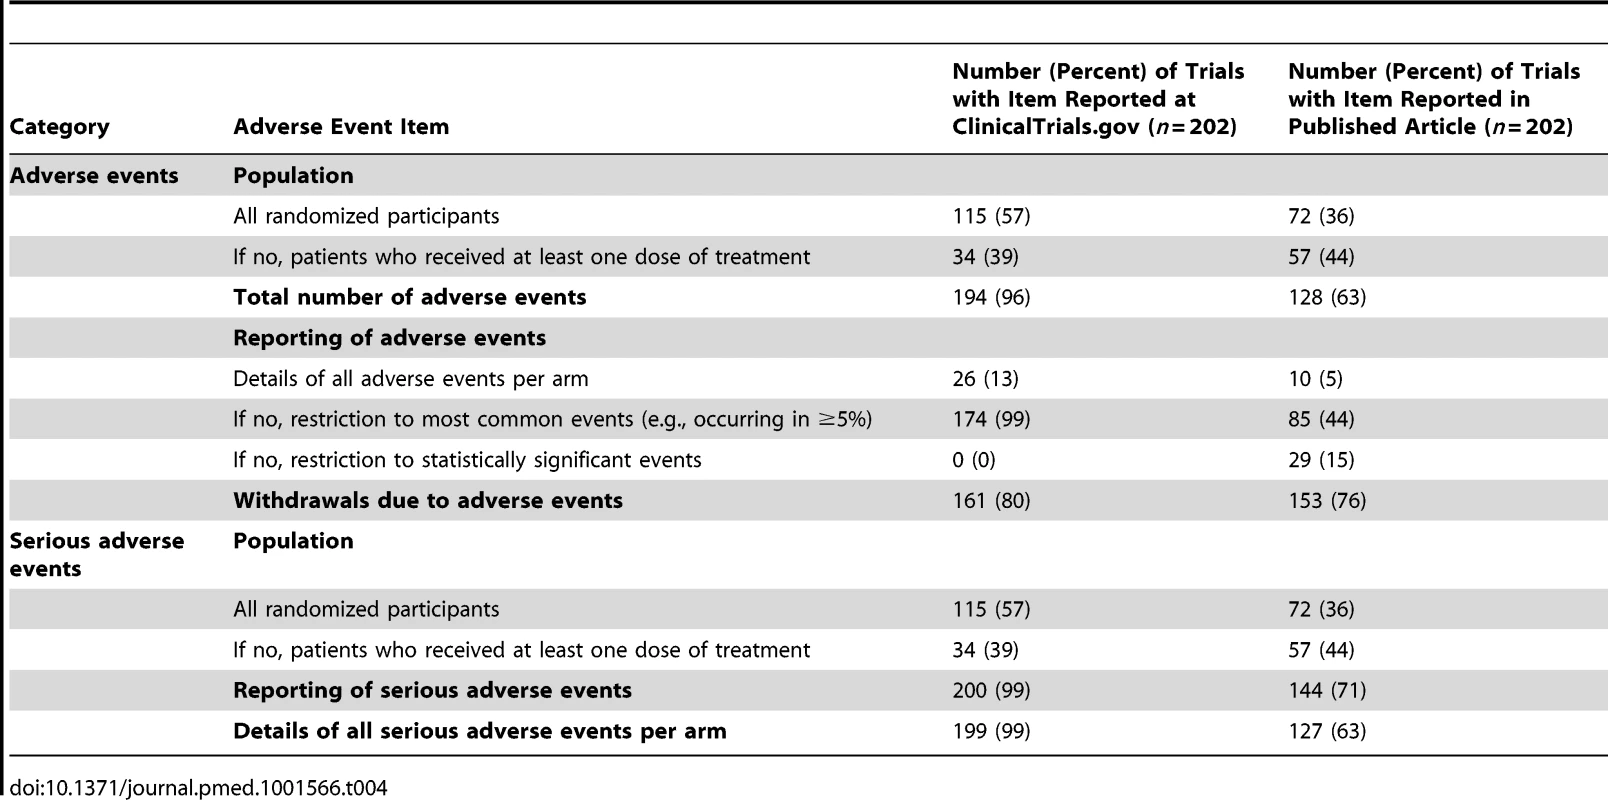
Completeness of Reporting
For the 202 pairs of trial reports, the proportion of trials with complete reporting was significantly higher at ClinicalTrials.gov than in the published article for the flow of participants (64% [129/202] versus 48% [96/202] of trials, p<0.001), efficacy results (79% [159/202] versus 69% [140/202], p = 0.02), adverse events (73% [147/202] versus 45% [91/202], p<0.001), and serious adverse events (99% [199/202] versus 63% [127/202], p<0.001) (Table 5).
Tab. 5. Completeness of reporting for the flow of participants during the trial, efficacy results, adverse events, and serious adverse events. 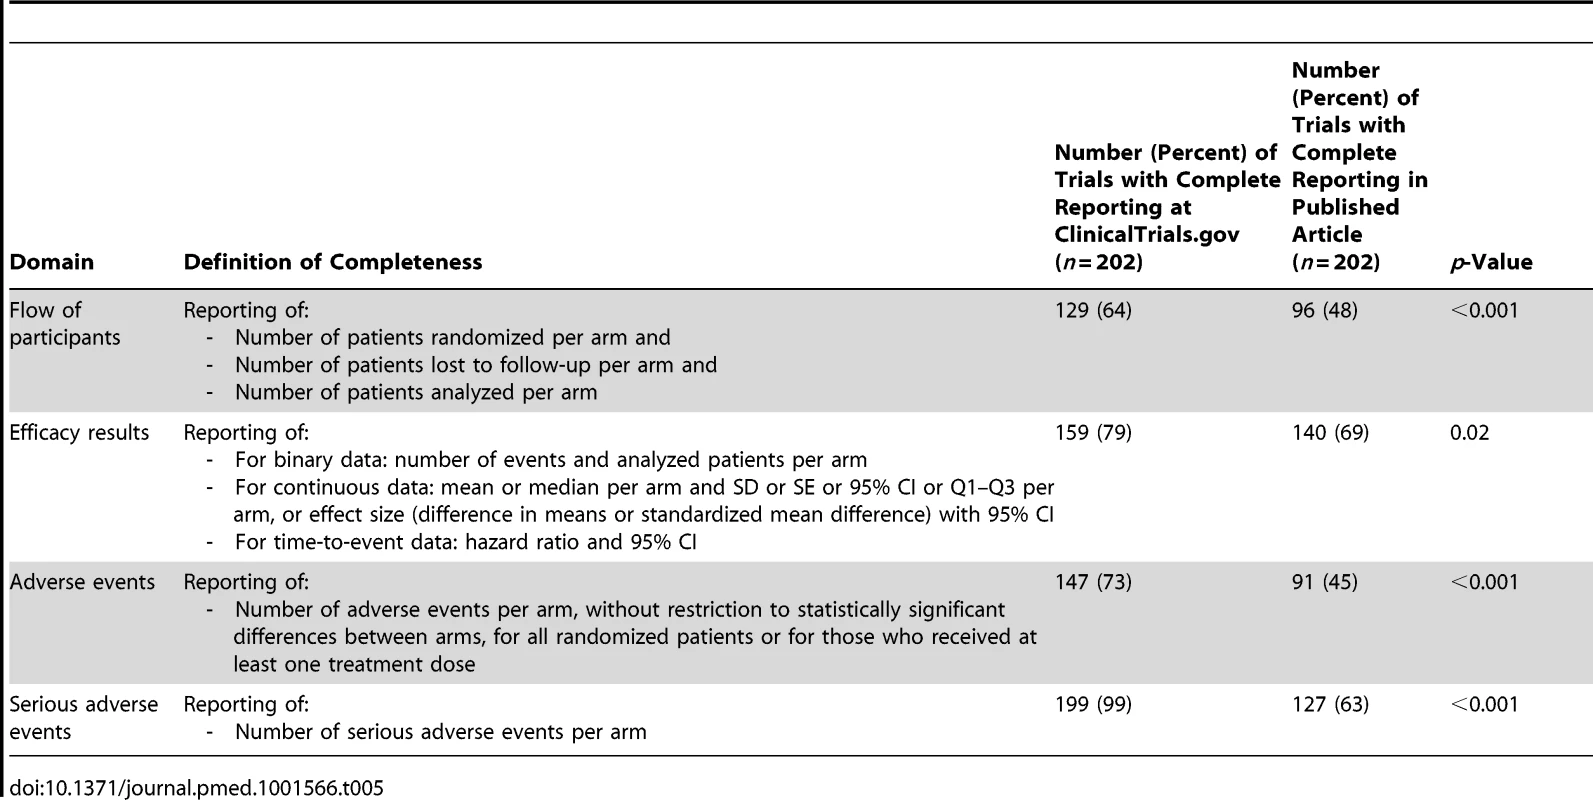
We found statistically significant interactions between completeness of reporting of adverse events and type of journal (74% and 38%, respectively, in ClinicalTrials.gov and in the published article for trials published in a specialty journal versus 70% and 59%, respectively, for trials published in a general journal, p for interaction = 0.015) as well as source of funding (75% and 5%, respectively, in ClinicalTrials.gov and in the published article for trials with academic funding; 73% and 50%, respectively, for trials with industry funding; and 56% and 33%, respectively, for trials with academic and industry funding, p for interaction = 0.01).
There was more information reported at ClinicalTrials.gov than in the published article for 29% (59/202) of trials for the flow of participants, 21% (42/202) for efficacy results, 40% (80/202) for adverse events, and 36% (73/202) for serious adverse events. There was less information in ClinicalTrials.gov than in the published article for 10% (21/202) of trials for the flow of participants, 10% (21/202) for efficacy results, 12% (24/202) for adverse events, and 1% (1/202) for serious adverse events of trials (Table 6).
Tab. 6. Comparison of information reported at ClinicalTrials.gov versus in the published article. 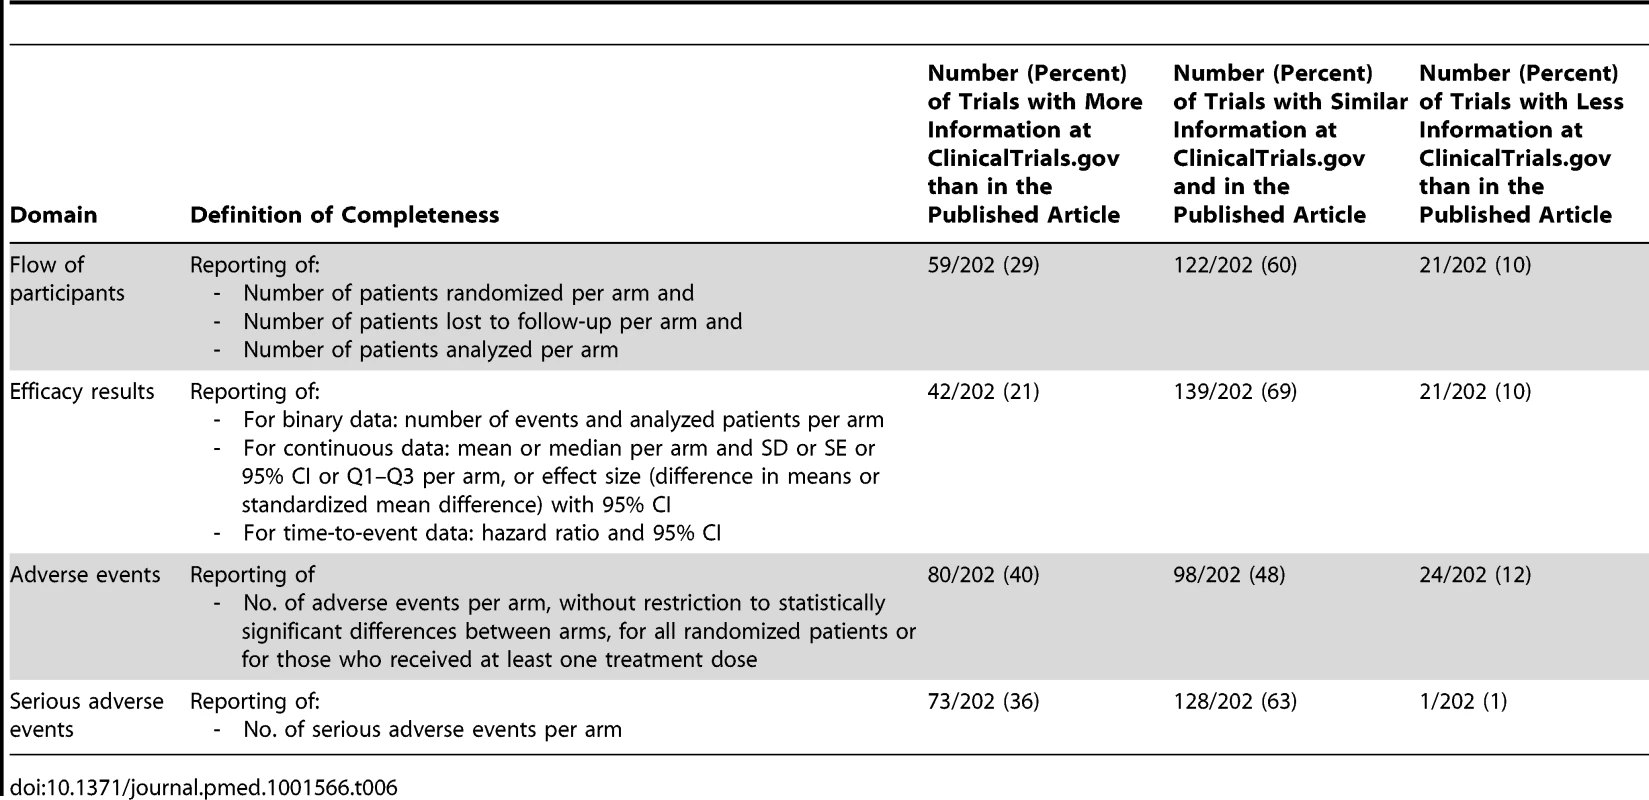
Discussion
To our knowledge, this is the first study comparing the timing and completeness of trial results publicly posted at ClinicalTrials.gov and published in articles. Our study is based on a random sample of 600 drug trials with results posted at ClinicalTrials.gov for which we searched for corresponding publications in PubMed. For half of the trials, results were not yet published. For trials with results both posted at ClinicalTrials.gov and published in journals, the median time to results being first publicly posted and published was 19 mo (Q1 = 14, Q3 = 30 mo) and 21 mo (Q1 = 14, Q3 = 28 mo), respectively, and the completeness of results was significantly better at ClinicalTrials.gov than in the corresponding published articles. In particular, serious adverse events were almost always reported at ClinicalTrials.gov.
A previous study assessed trial publication for completed trials registered at ClinicalTrials.gov and showed that fewer than half were published [20]. Other studies evaluated the quality of reporting of the World Health Organization minimum dataset in ClinicalTrials.gov [21]. A recent study published in 2012 [22] compared the quality of reporting among registry reports, clinical study reports submitted to regulatory authorities, and journal publications. The authors identified only industry registry reports, with no trials being registered in a public registry. They concluded that industry registry reports and journal publications insufficiently reported the results of clinical trials but may supplement each other. With the FDAAA requiring mandatory posting of results within 1 y after the primary completion date [15]–[17] and standardized reporting of results [17], ClinicalTrials.gov has become an interesting source of data for assessing trial results.
Implications
Our results have important implications for several stakeholders: patients and clinicians, authors, researchers performing systematic reviews and meta-analyses, methodologists, peer reviewers, developers of reporting guidelines, and journal editors.
For patients and their clinicians, our results outline the importance of registries to improve transparency in clinical research by making information about clinical trials, including results, publicly available, which is the basis for well-informed decision-making about patients' health.
Our results are important for authors because they point out inconsistencies in reporting and highlight the need for more rigorous adherence to reporting guidelines to ensure that all critical information is provided in study reports.
For researchers performing systematic reviews, our results emphasize the importance of registries [23]–[27] in reducing publication bias and time-lag bias. Actually, about half of the trials with results posted at ClinicalTrials.gov did not have published results.
Further, our results highlight the need to assess trial results systematically from both ClinicalTrials.gov and the published article when available. Based on our results, searching ClinicalTrials.gov is necessary for all published and unpublished trials to obtain more complete data and to identify inconsistencies or discrepancies between the publicly posted results and the publication. As outlined by Zarin et al., ClinicalTrials.gov is designed to complement, not replace, journal publication [28]. Nevertheless, not all trials have their results posted at ClinicalTrials.gov. Some studies previously showed low compliance with the FDAAA regarding mandatory posting of results at ClinicalTrials.gov [29]–[32]. Moreover, this law concerns trials performed in the US, with no similar law in Europe or elsewhere.
Our results also highlight the role of trial registries for researchers and methodologists exploring publication bias and selective reporting of outcomes. For example, researchers could use trial registries to assess whether studies with a significant main outcome are more likely to be published or published more quickly than those with a negative outcome using data recorded in registers.
For peer reviewers, our results emphasize the important role of trial registration during the peer-review process. Actually, reviewers and academic editors could assess whether all safety events, especially serious adverse events, are fully reported in the submitted articles. In our study, serious adverse events were reported for 99% of trials at ClinicalTrials.gov but for only 62% in the published article. A study published in 2009 found that 73% of articles published in journals with a high impact factor reported serious adverse events [33]. Nevertheless, a more recent study showed that only 34% of reviewers examined information registered in a trial registry [34].
For developers of reporting guidelines, such as the CONSORT group, and for editors, our study questions the current way of reporting trials and the peer-review process. In ClinicalTrials.gov, results are posted in a standard tabular format without discussions or conclusions. Using templates with mandatory reporting of some elements may facilitate the work of researchers by reminding them what they need to report and by standardizing their reporting. Including a template for reporting the results as part of the CONSORT guidelines could be useful to improve the completeness of trials' publication.
Furthermore, after the data results are submitted, ClinicalTrials.gov staff members review the submissions before public posting [18]. Data providers may be asked to clarify items or make corrections. This systematic verification could also contribute to the completeness of data posted. These results may help convince publishers of the value of changes in the presentation of the results section of articles (standardized tabular format rather than narrative text) or of implementation of reporting guidelines. To improve the quality of reports of clinical trials, journals—even those endorsing the CONSORT statement—must move from their current position of passive endorsement (for the vast majority of them) to a more active implementation of CONSORT guidelines [35],[36].
Although the reporting of results was more complete at ClinicalTrials.gov than in the published articles, reporting at ClinicalTrials.gov is still suboptimal and could be further improved. Some elements, such as the number of patients assessed for eligibility, are nearly never reported at ClinicalTrials.gov. Other elements can be improved upon, such as the reporting of results for binary data. At ClinicalTrials.gov, the percentage of events rather than the number of events is frequently reported. Both the number of events and the number of patients analyzed per arm are needed to perform meta-analyses of binary data. Other elements raise some important issues, including the frequent reporting of nonserious adverse events observed in more than 5% of patients, 5% being the default frequency threshold for reporting nonserious adverse events at ClinicalTrials.gov according to the FDAAA [15]–[17]. The reporting of adverse events observed at a certain frequency or threshold rate has been previously outlined as poor reporting practice [37].
Limitations
Our study has several limitations. We focused on trials with both results posted and published. It is possible that unpublished trial results could be published at a future date; some trials are submitted for publication several years after completion. When there were several publications for the same trial, we did not include all reports resulting from the trial but only the report describing the results for the primary outcomes. We chose this strategy because, according to the CONSORT statement, safety results should be reported with the main results. Only 9% of trials had multiple publications. These reports included protocols or preliminary or long-term results. None of the eliminated reports contained additional safety data for the same time frame as the selected report. Two of the eliminated reports contained additional safety results, but for longer-term follow-up. When assessing the completeness of reporting of efficacy results, we focused on a single primary outcome. If several primary outcomes were registered at ClinicalTrials.gov, we assessed the completeness of reporting for only the first primary outcome registered. Data extraction was not blinded to the source of data (ClinicalTrials.gov or published article) because blinding would have been impossible to achieve. Completeness of reporting was assessed as a binary outcome (all elements reported versus not all elements reported), so other assessment approaches may result in different findings. Finally, we could not determine whether publication, time to publication, and completeness were associated with risk of bias in trial design or conduct because ClinicalTrials.gov contained insufficient methodological information for assessing risk of bias [21],[38].
Conclusions
In conclusion, our results highlight the importance of extracting efficacy and safety data posted at ClinicalTrials.gov not only for trials whose results are not yet published, but also for those with published results, because we found that reporting was more complete at ClinicalTrials.gov. Use of templates allowing for standardized reporting of trial results in journals or broader mandatory registration of results for all trials may help further improve transparency.
Supporting Information
Zdroje
1. ChalmersI, GlasziouP (2009) Avoidable waste in the production and reporting of research evidence. Lancet 374 : 86–89.
2. AntesG, ChalmersI (2003) Under-reporting of clinical trials is unethical. Lancet 361 : 978–979.
3. ChalmersI (1990) Underreporting research is scientific misconduct. JAMA 263 : 1405–1408.
4. EasterbrookPJ, BerlinJA, GopalanR, MatthewsDR (1991) Publication bias in clinical research. Lancet 337 : 867–872.
5. LiberatiA (2004) An unfinished trip through uncertainties. BMJ 328 : 531.
6. EggerM, SmithGD (1998) Bias in location and selection of studies. BMJ 316 : 61–66.
7. HopewellS, LoudonK, ClarkeMJ, OxmanAD, DickersinK (2009) Publication bias in clinical trials due to statistical significance or direction of trial results. Cochrane Database Syst Rev 2009: MR000006.
8. TurnerEH, MatthewsAM, LinardatosE, TellRA, RosenthalR (2008) Selective publication of antidepressant trials and its influence on apparent efficacy. N Engl J Med 358 : 252–260.
9. IoannidisJP (1998) Effect of the statistical significance of results on the time to completion and publication of randomized efficacy trials. JAMA 279 : 281–286.
10. HigginsJPT, GreenS, editors. Cochrane handbook for systematic reviews of interventions, version 5.1.0. The Cochrane Collaboration
11. ChanAW, AltmanDG (2005) Identifying outcome reporting bias in randomised trials on PubMed: review of publications and survey of authors. BMJ 330 : 753.
12. ChanAW, HrobjartssonA, HaahrMT, GotzschePC, AltmanDG (2004) Empirical evidence for selective reporting of outcomes in randomized trials: comparison of protocols to published articles. JAMA 291 : 2457–2465.
13. ChanAW, Krleza-JericK, SchmidI, AltmanDG (2004) Outcome reporting bias in randomized trials funded by the Canadian Institutes of Health Research. CMAJ 171 : 735–740.
14. KirkhamJJ, DwanKM, AltmanDG, GambleC, DoddS, et al. (2010) The impact of outcome reporting bias in randomised controlled trials on a cohort of systematic reviews. BMJ 340: c365.
15. (2007) Food and Drug Administration Amendments Act of 2007. US Public Law 110–85. Washington (District of Columbia): Food and Drug Administration.
16. Clinical trials registries: towards improved access to therapeutic data. Prescrire Int 17 : 256–259.
17. TseT, WilliamsRJ, ZarinDA (2009) Reporting “basic results” in ClinicalTrials.gov. Chest 136 : 295–303.
18. TseT, WilliamsRJ, ZarinDA (2009) Update on registration of clinical trials in ClinicalTrials.gov. Chest 136 : 304–305.
19. R Development Core Team (2011). R: a language and environment for statistical computing. Vienna: R Foundation for Statistical Computing. Available: http://www.R-project.org/. Accessed 28 October 2013.
20. RossJS, MulveyGK, HinesEM, NissenSE, KrumholzHM (2009) Trial publication after registration in ClinicalTrials.gov: a cross-sectional analysis. PLoS Med 6: e1000144 doi:10.1371/journal.pmed.1000144
21. HuicM, MarusicM, MarusicA (2011) Completeness and changes in registered data and reporting bias of randomized controlled trials in ICMJE journals after trial registration policy. PLoS One 6: e25258 doi:10.1371/journal.pone.0025258
22. WieselerB, KerekesMF, VervoelgyiV, McGauranN, KaiserT (2012) Impact of document type on reporting quality of clinical drug trials: a comparison of registry reports, clinical study reports, and journal publications. BMJ 344: d8141.
23. ZarinDA, IdeNC, TseT, HarlanWR, WestJC, et al. (2007) Issues in the registration of clinical trials. JAMA 297 : 2112–2120.
24. ZarinDA, KeselmanA (2007) Registering a clinical trial in ClinicalTrials.gov. Chest 131 : 909–912.
25. ZarinDA, TseT (2008) Medicine. Moving toward transparency of clinical trials. Science 319 : 1340–1342.
26. ZarinDA, TseT, IdeNC (2005) Trial registration at ClinicalTrials.gov between May and October 2005. N Engl J Med 353 : 2779–2787.
27. CaliffRM, ZarinDA, KramerJM, ShermanRE, AberleLH, et al. (2012) Characteristics of clinical trials registered in ClinicalTrials.gov, 2007–2010. JAMA 307 : 1838–1847.
28. ZarinDA, TseT, WilliamsRJ, CaliffRM, IdeNC (2011) The ClinicalTrials.gov results database—update and key issues. N Engl J Med 364 : 852–860.
29. GopalRK, YamashitaTE, ProchazkaAV (2012) Research without results: inadequate public reporting of clinical trial results. Contemp Clin Trials 33 : 486–491.
30. NguyenTA, DechartresA, BelgherbiS, RavaudP (2013) Public availability of results of trials assessing cancer drugs in the United States. J Clin Oncol 31 : 2998–3003.
31. PrayleAP, HurleyMN, SmythAR (2012) Compliance with mandatory reporting of clinical trial results on ClinicalTrials.gov: cross sectional study. BMJ 344: d7373.
32. ShamliyanT (2010) Reporting of results of interventional studies by the information service of the National Institutes of Health. Clin Pharmacol 2 : 169–176.
33. PitrouI, BoutronI, AhmadN, RavaudP (2009) Reporting of safety results in published reports of randomized controlled trials. Arch Intern Med 169 : 1756–1761.
34. MathieuS, ChanAW, RavaudP (2013) Use of trial register information during the peer review process. PLoS ONE 8: e59910 doi:10.1371/journal.pone.0059910
35. SchulzKF, AltmanDG, MoherD (2010) CONSORT 2010 statement: updated guidelines for reporting parallel group randomized trials. Ann Intern Med 152 : 726–732.
36. TurnerL, ShamseerL, AltmanDG, SchulzKF, MoherD (2012) Does use of the CONSORT statement impact the completeness of reporting of randomised controlled trials published in medical journals? A Cochrane review. Syst Rev 1 : 60.
37. IoannidisJPA, EvansSJW, GøtzschePC, O'NeillRT, AltmanDG, et al. (2004) Better reporting of harms in randomized trials: an extension of the CONSORT statement. Ann Intern Med 141 : 781–788.
38. ReveizL, ChanA-W, Krleža-JerićK, GranadosCE, PinartM, et al. (2010) Reporting of methodologic information on trial registries for quality assessment: a study of trial records retrieved from the WHO Search Portal. PLoS One 5: e12484 doi:10.1371/journal.pone.0012484
Štítky
Interní lékařství
Článek vyšel v časopisePLOS Medicine
Nejčtenější tento týden
2013 Číslo 12- Berberin: přírodní hypolipidemikum se slibnými výsledky
- Léčba bolesti u seniorů
- Příznivý vliv Armolipidu Plus na hladinu cholesterolu a zánětlivé parametry u pacientů s chronickým subklinickým zánětem
- Červená fermentovaná rýže účinně snižuje hladinu LDL cholesterolu jako vhodná alternativa ke statinové terapii
- Jak postupovat při výběru betablokátoru − doporučení z kardiologické praxe
-
Všechny články tohoto čísla
- Editors' Wishes for an Illuminated Season and an Open New Year
- Artemisinin Combination Therapy: A Good Antimalarial, but Is the Dose Right?
- Early HIV Infection in the United States: A Virus's Eye View
- Financial Conflicts of Interest and Reporting Bias Regarding the Association between Sugar-Sweetened Beverages and Weight Gain: A Systematic Review of Systematic Reviews
- Investigating the Intersection of Policing and Public Health
- Improving Treatment of Children with Autism Spectrum Disorder in Low- and Middle-Income Countries: The Role of Non-specialist Care Providers
- Data Sharing in a Humanitarian Organization: The Experience of Médecins Sans Frontières
- Why Growing Retractions Are (Mostly) a Good Sign
- Challenges in Addressing Plagiarism in Education
- Experiences with Policing among People Who Inject Drugs in Bangkok, Thailand: A Qualitative Study
- Non-Specialist Psychosocial Interventions for Children and Adolescents with Intellectual Disability or Lower-Functioning Autism Spectrum Disorders: A Systematic Review
- Malaria and Severe Anemia: Thinking beyond
- Financing Essential HIV Services: A New Economic Agenda
- Timing and Completeness of Trial Results Posted at ClinicalTrials.gov and Published in Journals
- Circulating Mitochondrial DNA in Patients in the ICU as a Marker of Mortality: Derivation and Validation
- The Effect of Dosing Regimens on the Antimalarial Efficacy of Dihydroartemisinin-Piperaquine: A Pooled Analysis of Individual Patient Data
- Major Burden of Severe Anemia from Non-Falciparum Malaria Species in Southern Papua: A Hospital-Based Surveillance Study
- HIV-1 Transmission during Early Infection in Men Who Have Sex with Men: A Phylodynamic Analysis
- PLOS Medicine
- Archiv čísel
- Aktuální číslo
- Informace o časopisu
Nejčtenější v tomto čísle- Artemisinin Combination Therapy: A Good Antimalarial, but Is the Dose Right?
- Circulating Mitochondrial DNA in Patients in the ICU as a Marker of Mortality: Derivation and Validation
- Timing and Completeness of Trial Results Posted at ClinicalTrials.gov and Published in Journals
- Malaria and Severe Anemia: Thinking beyond
Kurzy
Zvyšte si kvalifikaci online z pohodlí domova
Současné možnosti léčby obezity
nový kurzAutoři: MUDr. Martin Hrubý
Všechny kurzyPřihlášení#ADS_BOTTOM_SCRIPTS#Zapomenuté hesloZadejte e-mailovou adresu, se kterou jste vytvářel(a) účet, budou Vám na ni zaslány informace k nastavení nového hesla.
- Vzdělávání


