-
Články
Top novinky
Reklama- Vzdělávání
- Časopisy
Top články
Nové číslo
- Témata
Top novinky
Reklama- Videa
- Podcasty
Nové podcasty
Reklama- Kariéra
Doporučené pozice
Reklama- Praxe
Top novinky
ReklamaDetermination of acid-base dissociation constants of newly synthesized arylethanolamine derivatives using capillary zone electrophoresis
Authors: Iva Kapustíková; Matej Maruniak; Ľubica Havranová-Sichrovská; Lukáš Stanzel; Ivan Malík; Eva Sedlárová
Authors place of work: Department of Pharmaceutical Chemistry, Faculty of Pharmacy, Comenius University in Bratislava, Bratislava, Slovak Republic
Published in the journal: Čes. slov. Farm., 2015; 64, 212-214
Category: 44<sup>th</sup> Conference drug synthesis and analysis
Introduction
The acid-base dissociation constant (pKa) is an important physicochemical parameter which affects drug pharmacokinetics and toxicity (ADMET: absorption, distribution, metabolism, excretion, toxicity). The early-obtained information about these drug properties may decrease the costly development process of a compound with poor pharmaceutical prospects1, 2). In the present study, dissociation constants of eight newly synthesized arylethanolamine derivatives, with potential α - and β-adrenolytic properties, are determined.
Determination of pKa using capillary zone electrophoresis is based on the measurement of the effective electrophoretic mobility of studied substances as a function of separation electrolyte pH. This relationship is then fitted by a sigmoidal curve, where pKa is the value of pH in the sigmoid inflection point. pKa values obtained in buffer solution are recalculated to thermodynamic pKTa which correspond to water medium3, 4).
Experimental methods
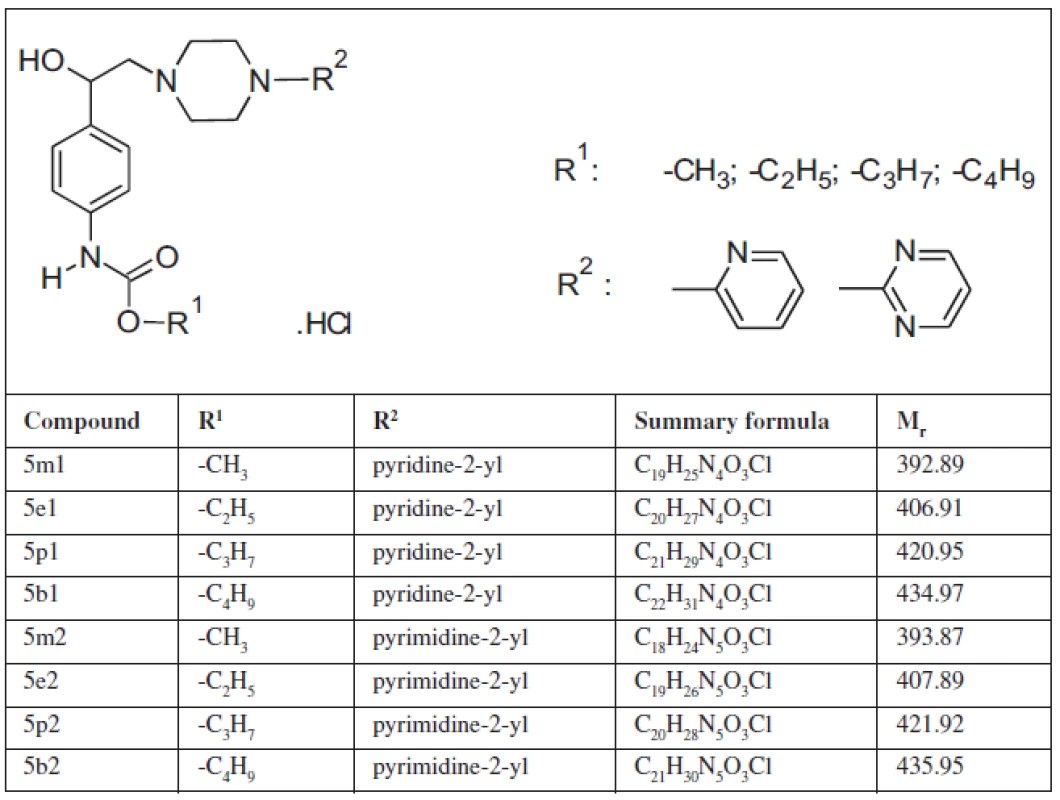
All chemicals and solvents were of analytical-reagent grade. HEPES, MES, MOPSO, TAPS were purchased from Sigma-Aldrich (Steinheim, Germany). Sodium hydroxide, mesityl oxide and sodium acetate trihydrate from Fluka (Buchs, Switzerland). Acetic and formic acid from Lachema (Brno, Czech Republic). Studied substances (Table 1), with potential α - and β-adrenolytic properties, were synthesized by PharmDr. Matej Maruniak, PhD. at Department of Pharmaceutical Chemistry, Faculty of Pharmacy, Comenius University in Bratislava5).
Experiments were carried out using an Agilent 3D CE system (Agilent Technologies, Waldbronn, Germany) equipped with a diode array detector. Results were enregistered by the system Agilent ChemStation and processed in the program SigmaPlot v. 10.0 (San Rafael, CA, USA). The pH values of used buffers were measured with a pH meter WTW InoLab pH Level 2 (Praha, Czech Republic) equipped with a combined electrode SenTix 41.
Electrophoretic measurements were performed in a fused-silica capillary of 48.5 cm total length, 40 cm effective length (from injection to detector) and 75 ∝m internal diameter. Before first using, capillary was rinsed with 0.1 mol.l–1 NaOH for 20 min, then with deionised water for 20 minutes. Between consecutive runs, the capillary was rinsed for 1 minute with 0.1 mol. l–1 NaOH solution, water and background electrolyte. When background electrolyte was changed, conditioning was extended to 15 min. The sample was injected by the pressure of 40 mbar for 4 s. A constant voltage of 15 kV was applied at 25 °C. Detection was at the wavelength of 254 nm.
Stock solution of 7.5.10–3 mol.l–1 of tested substances was prepared in deionised water. Concentration of mesityl oxide as the electroosmotic flow marker was 2.10–6 mol.l–1 in water. Working solutions were prepared by diluting the stock solution of analytes and mesityl oxide in each corresponding buffer to the final concentration of 7.5.10–4 mol.l–1 for analytes and 2.10–7 mol.l–1 for mesityl oxide.
Measurements were performed in the system of ten buffer solutions with a constant ionic strength 0.01 mol.l–1 within pH range of 4.5–8.5 (Table 2). Measurement of each compound in each of the background electrolytes was repeated four times. The online program Buffer Calculator was employed to calculate the composition of the series of background electrolytes with various pH6).
Tab. 2. Composition of background electrolyte system 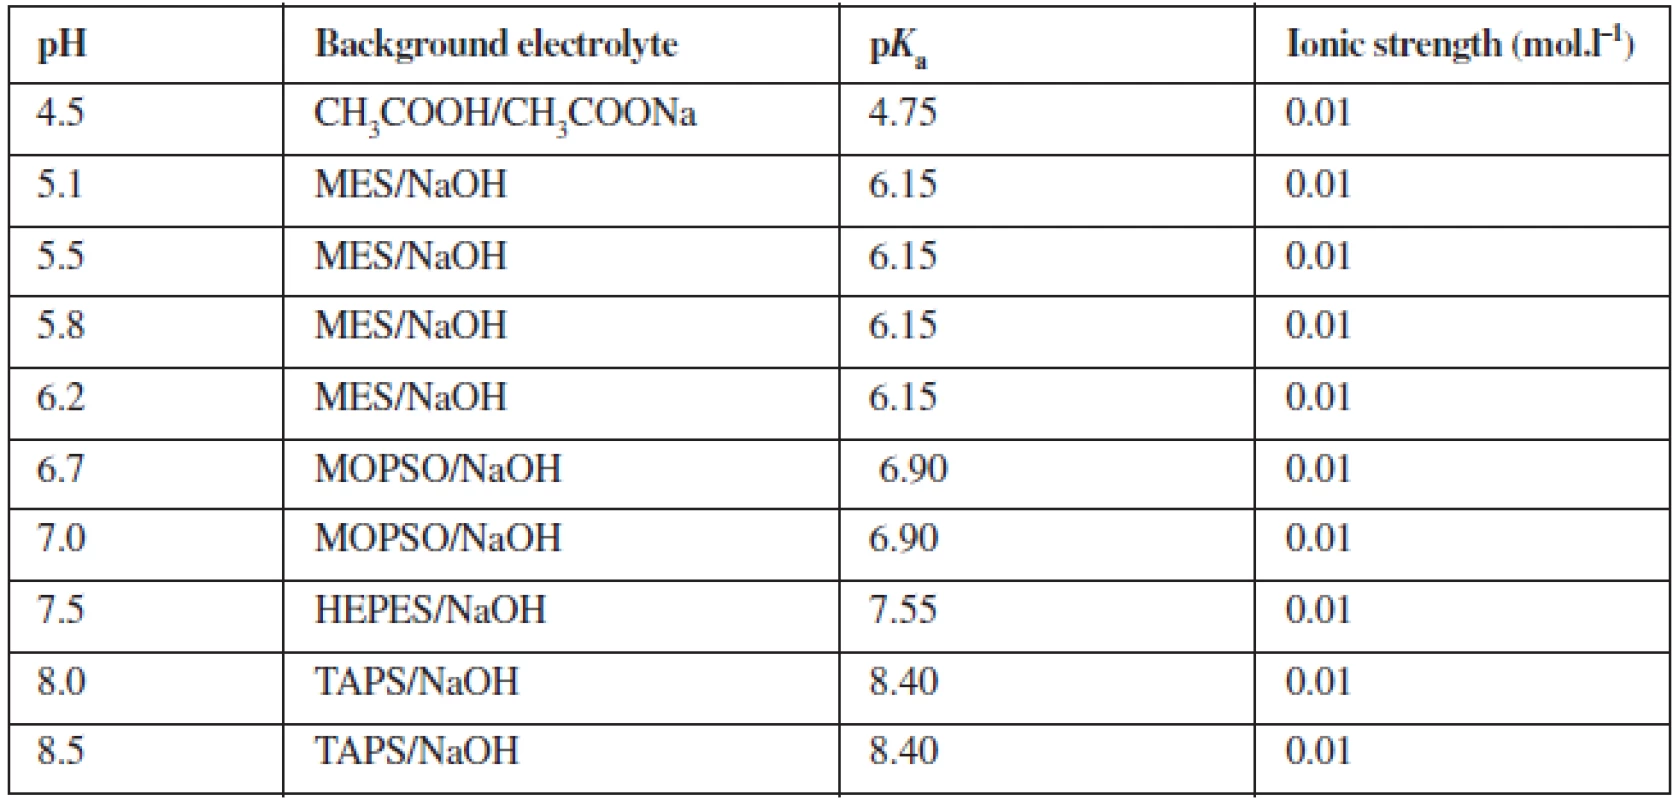
The effective electrophoretic mobilities ∝eff (m2V−-1s−-1) of analytes were calculated from observed migration times of each analyte and migration time of mesityl oxide according to the equation:
where Lt is the total length of the capillary (m), Ld is the effective length (m), U is the applied voltage (V), tmig the migration time of analyte (s) and tEOF the migration time of the electroosmotic flow marker (s)3, 4).
The sets of the experimentally obtained effective mobilities were fitted by the sigmoid curve, which is for the monoprotic weak base described by the equation:
where μBH+ is the ionic mobility of the fully protonated base. pKa of the compound is the pH in the inflexion point of the sigmoidal curve3, 4).
As the measurements are carried out in a system of buffer solutions of the ionic strength of 0.01 mol.l-1, the obtained values of pKa had to be converted to the thermodynamic dissociation constants (pKTa) which correspond to the aquatic environment of the zero ionic strength:
where for the calculation of the activity coefficients the following formula was used:
For the ionic strength of 0.01 mol.l–1 and a = 0,5 nm, logγ has a value of –0.04373, 4).
Results and discussion
Figure 1 shows an example of a typical experiment analysis. The injected mixture contained compound 5m1 and mesityl oxide, as the background electrolyte MOPSO (pH = 6,70) was used.
Fig. 1. Electropherogram of compound 5m1 (7.5.10<sup>–4</sup> mol.l<sup>–1</sup>) and mesityl oxide (2.10<sup>–6</sup> mol.l<sup>–1</sup>) in MOPSO/NaOH background electrolyte (pH = 6.70, I = 0.01 mol.l<sup>–1</sup>), injection by pressure 40 mbar for 4 s, applied voltage +15 kV, temperature 25 °C, detection at 254 nm 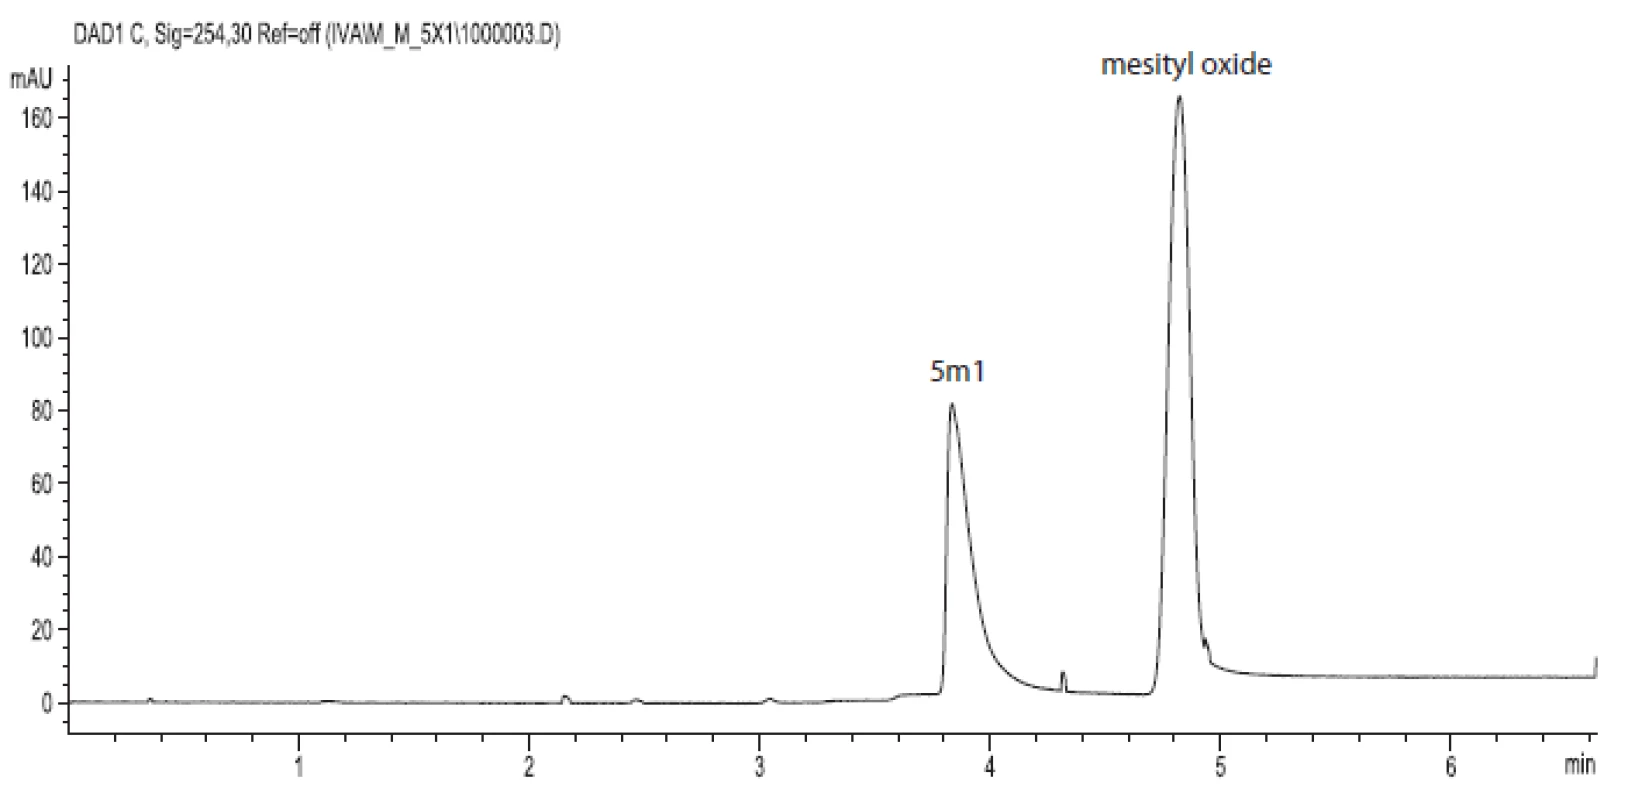
Measurements of each compound in each of the background electrolytes was repeated four times. The effective electrophoretic mobilities (m2V–1s–1) were calculated using the formula [1] where tmig is the migration time of the studied substance, whereas tEOF denotes the migration of mesityl oxide as the electroosmotic flow maker. pKa was determined using the dependence of the effective electrophoretic mobilities on the pH of the background electrolyte. This relationship was fitted in the program SigmaPlot v. 10.0 (San Rafael, CA, USA) by the sigmoidal mobility curve [2], where pKa is the value of pH in the sigmoid inflection point.
Dissociation constants obtained in buffer solvent were recalculated to the thermodynamic values (pKTa) for water medium of zero ionic strength [3, 4]. The mobility curve of the selected analyte is shown in Figure 2. The pKTa and values of individual compounds are given in Table 3.
Fig. 2. Mobility curve of substance 5m1 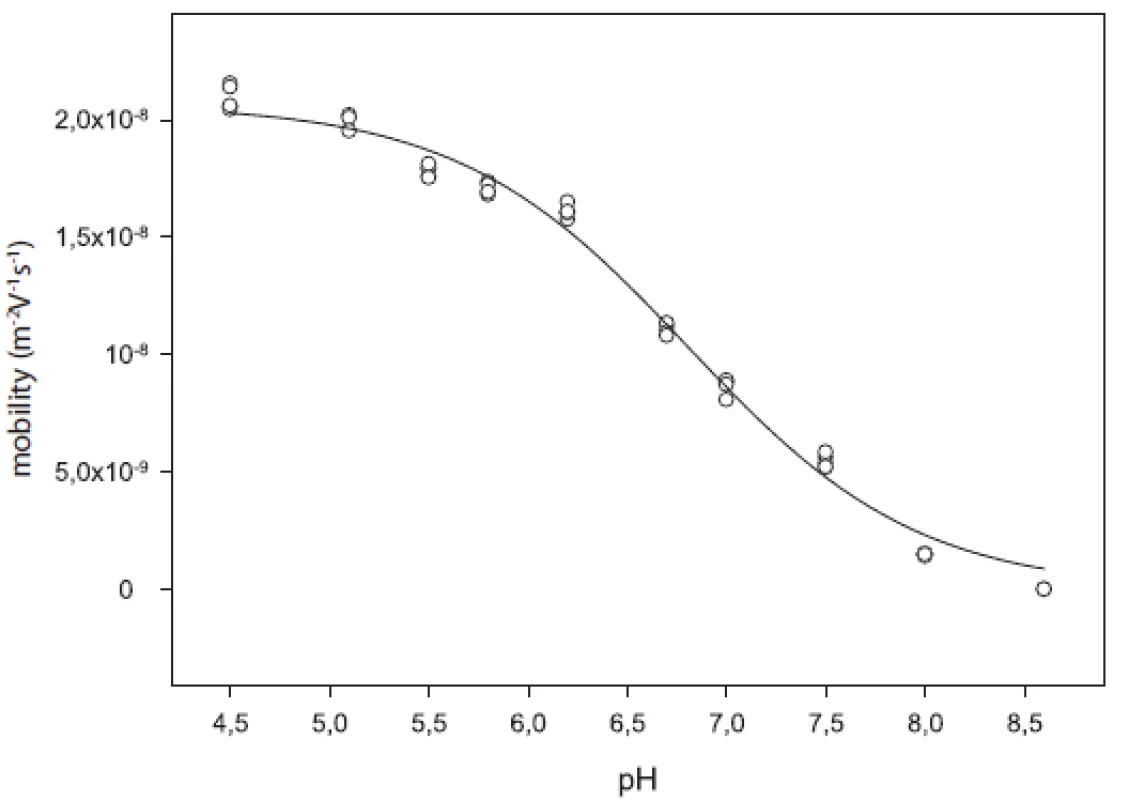
Tab. 3. Dissociation constants (pK<sub>a</sub>), thermodynamic dissociation constants (pK<sub>α</sub><sup>T</sup>, standard deviations (s<sub>d</sub>) and coefficients of determination (R<sup>2</sup>) 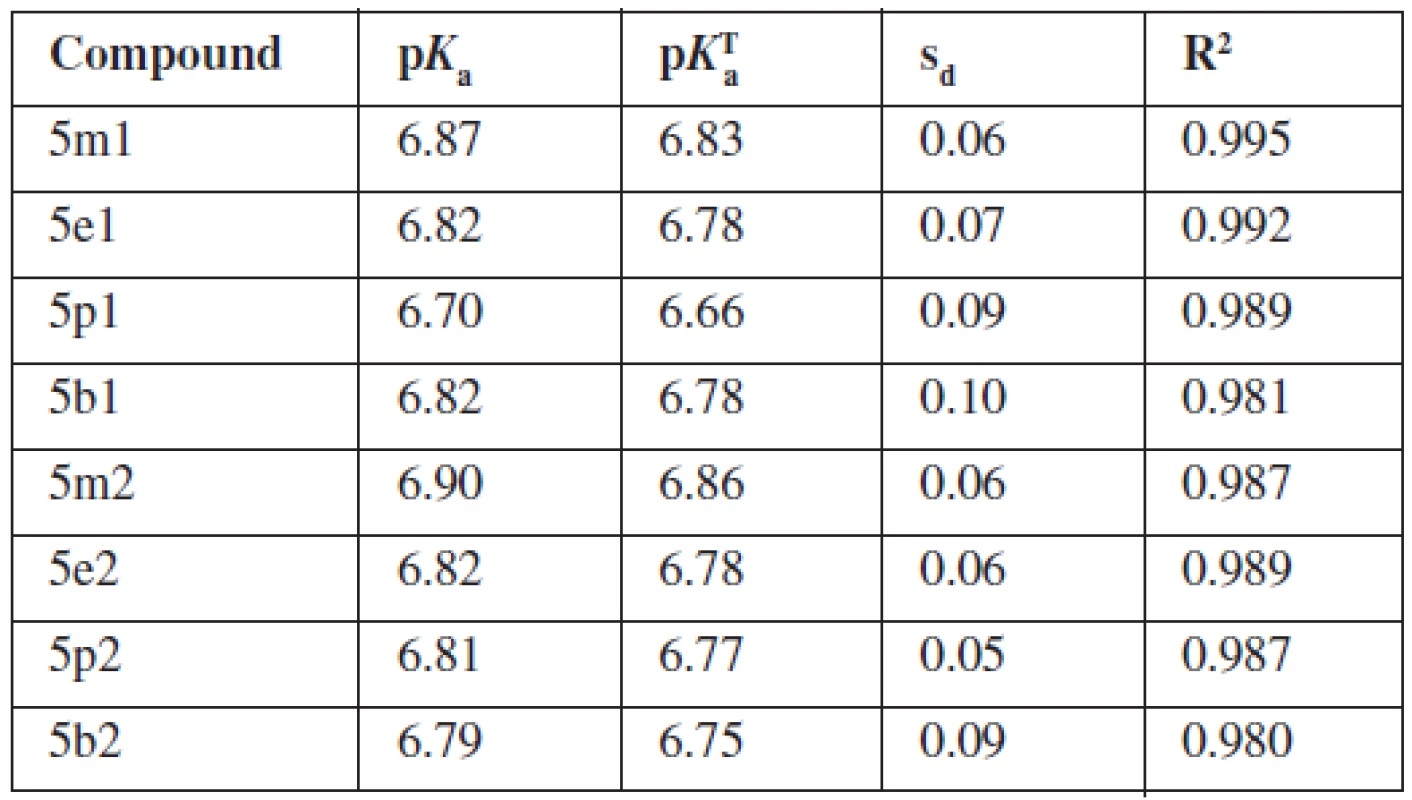
The compounds under study were monohydrochlorides of weak bases. The pH range of background electrolyte solutions was chosen in order to guarantee practically full protonation (BH+) of analytes at the lowest pH and their no protonation (B) at the highest pH. We observed a decrease in the effective mobility with increasing pH. At the lowest pH the mobility of the analyte is maximal, which indicates the predominance of cationic species. As pH increases, a new species with zero electric charge is formed by deprotonation of the analyte and its effective mobility goes to zero. In the case of our molecules, we observed one inflexion point and the pKa of the compound is the pH in this inflexion point of the sigmoid curve.
One inflexion point in the mentioned pH range confirms that analytes are monohydrochlorides and have one pKa value. As assumed previously from their chemical structure, pKa corresponds to protonated piperazine nitrogen which is closer to the arylethanolamine chain. The pKa values of compounds do not refer about any evident influence of the chemical structure on the acidity of the molecule. Influence of pyridine-2-yl or pyrimidine-2-yl on the pKa of substances was not proven. Any important influence of R1 substituents (methyl–butyl) on pKa value was not observed, either.
Conclusions
Dissociation constants were determined for eight newly synthesized potential drugs. The pKa values of the compounds under study do not refer about any evident influence of the selected substituents on the acidity of the molecule. The results will be a help to a further study of the substances, first, the prediction of their pharmacokinetics and also in the optimization of the assay conditions of other physicochemical research.
An advantage of the capillary zone electrophoresis has been a need of a small quantity of the sample without the necessity of high purity, and the possibility to operate in an aqueous medium even in the case of low water solubility of studied substances.
This work was supported by the following grants: FaF UK/63/2015; FaF UK/28/2015; FaF UK/29/2015; FaF UK/44/2015; Grant UK/346/2015; Comenius University in Bratislava Science Park supported by the Research and Development Operational Programme funded by the ERDF – Grant number: ITMS 26240220086.
Conflicts of interest: none.
PharmDr. Iva Kapustíková, PhD.
Department of Pharmaceutical Chemistry, Faculty of Pharmacy, Comenius University in Bratislava
Odbojárov 10, 832 32 Bratislava, Slovak Republic
e-mail: kapustikova3@uniba.sk
Zdroje
1. Testa B., van de Waterbeemd H., Folkers G., Guy R. Pharmacokinetic optimization in drug research. Weinheim: Wiley-VCH 2001.
2. Babić S., Horvat A. J. M., Mutavdžić Pavlović D., Kaštelan-Macan M. Determination of pKa values of active pharmaceutical ingredients. Trends Anal. Chem. 2007; 26, 1043–1061.
3. Fuguet E., Reta M., Gibert C., Rosés M., Bosch E., Ràfols C. Critical evaluation of buffering solutions for pKa determination by capillary electrophoresis. Electrophoresis 2008, 29, 2841–2851.
4. Šlampová A., Křivánková L., Gebauer P., Boček P. J. Standard systems for measurement of pKa values and ionic mobilities 2. Univalent weak bases. J. Chromatogr. A 2009; 1216, 3637–3641.
5. Maruniak M. Preparation, physico-chemical properties and biological activity evaluation of cardiovascularactive potential drugs from the group of phenylcarbamic acid derivatives (Arylethanolamines, Aryloxyaminopropanols). Dissertation thesis. Department of Pharmaceutical Chemistry, Faculty of Pharmacy, Comenius University in Bratislava 2012.
6. Robinson D. Buffer calculator. http://dbr.csoft.net/chem/bufcalc.php (24. 6. 2015).
Štítky
Farmacie Farmakologie
Článek vyšel v časopiseČeská a slovenská farmacie
Nejčtenější tento týden
2015 Číslo 5- Psilocybin je v Česku od 1. ledna 2026 schválený. Co to znamená v praxi?
- Ukažte mi, jak kašlete, a já vám řeknu, co vám je
- FDA varuje před selfmonitoringem cukru pomocí chytrých hodinek. Jak je to v Česku?
-
Všechny články tohoto čísla
- Metody používané ve farmaceutické technologii ke zvyšování biologické dostupnosti špatně rozpustných léčiv po perorálním podání
- Výdaje na léky a péči pro stárnoucí populaci
- Úroveň a faktory ovplyvňujúce pacientsku spokojnosť s lekárenskou starostlivosťou na Slovensku
-
Pracovní den sekce technologie léků České farmaceutické společnosti ČLS JEP
Pokroky v lékových formách - Drug bioavailability increasing by formulation of liquisolid systems
- Hodnocení sypných a konsolidačních vlastností prášků ve farmaceutické technologii
- Evaluation of compressibility of tableting mixtures using the compaction equation
- Branched polyesters as mucoadhesive carriers of drugs
- Formulační aspekty orodispergovatelných tablet
- Evaluation of water absorption rate of tablets by using an Enslin-Neff device
- Evaluation of the influence of lubricants on the viscoelastic properties of tablets using the stress relaxation test
-
44th Conference drug synthesis and analysis
(Brno, 2nd to 4th September 2015) – Part 1 - Determination of biologically active compounds in the fungi of the genus Cordyceps sinensis by HPLC and NMR
- Determination of CMC of cationic tenside in aqueous and mixed water-alcohol solutions
- A comparison of SiO2-, Cu-, and Ni-supported Au nanoparticles for selective glycerol oxidation to acetic acid*
- Determination of acid-base dissociation constants of newly synthesized arylethanolamine derivatives using capillary zone electrophoresis
- HPLC method for stability evaluation of pharmaceutical preparations containing sodium picosulfate
- The use of 2,6-dichloroquinone-4-chlorimide for quantitative determination of phenylephrine hydrochloride in combined tablets with paracetamol and chlorpheniramine maleate
- The utilization of radionuclide X-ray spectrometry in the determination of elements in medicinal plants and medicinal products used as antianemics
- On-line hyphenated capillary electrophoresis and tandem mass spectrometry used for the analysis of selected biogenic amines in grape leaves
- Validation of spectrophotometric methods of assaying metronidazole in capsules
- Prof. RNDr. Jaroslav Květina, DrSc. dr.h.c. FCMA – 85letý
- Farmakochemie
- Česká a slovenská farmacie
- Archiv čísel
- Aktuální číslo
- Informace o časopisu
Nejčtenější v tomto čísle- Metody používané ve farmaceutické technologii ke zvyšování biologické dostupnosti špatně rozpustných léčiv po perorálním podání
- Formulační aspekty orodispergovatelných tablet
- Prof. RNDr. Jaroslav Květina, DrSc. dr.h.c. FCMA – 85letý
- Hodnocení sypných a konsolidačních vlastností prášků ve farmaceutické technologii
Kurzy
Zvyšte si kvalifikaci online z pohodlí domova
Současné možnosti léčby obezity
nový kurzAutoři: MUDr. Martin Hrubý
Všechny kurzyPřihlášení#ADS_BOTTOM_SCRIPTS#Zapomenuté hesloZadejte e-mailovou adresu, se kterou jste vytvářel(a) účet, budou Vám na ni zaslány informace k nastavení nového hesla.
- Vzdělávání


